
Abstract
Mid-latitudinal cyclones are a key factor for understanding regional anomalies in primary meteorological parameters such as temperature or precipitation. Extreme cyclones can produce notable impacts on human society and economy, for example, by causing enormous economic losses through wind damage. Based on 41 annually initialised (1961–2001) hindcast ensembles, this study evaluates the ability of a single-model decadal forecast system (MPI-ESM-LR) to provide skilful probabilistic three-category forecasts (enhanced, normal or decreased) of winter (ONDJFM) extra-tropical cyclone frequency over the Northern Hemisphere with lead times from 1 yr up to a decade. It is shown that these predictions exhibit some significant skill, mainly for lead times of 2–5 yr, especially over the North Atlantic and Pacific. Skill for intense cyclones is generally higher than for all detected systems. A comparison of decadal hindcasts from two different initialisation techniques indicates that initialising from reanalysis fields yields slightly better results for the first forecast winter (month 10–15), while initialisation based on an assimilation experiment provides better skill for lead times between 2 and 5 yr. The reasons and mechanisms behind this predictive skill are subject to future work. Preliminary analyses suggest a strong relationship of the model's skill over the North Atlantic with the ability to predict upper ocean temperatures modulating lower troposphere baroclinicity for the respective area and time scales.
1. Introduction
In recent years, research on decadal climate prediction has evolved, responding to the growing demand for near-term climate predictions by different societal, economic and political stakeholders. This is due to the combination of increased awareness of potential implications of any climate change signal (natural or anthropogenic) on the one hand and typical time spans of economic or societal planning on the other hand. As anthropogenically forced climate change signals and natural decadal variations may be of similar magnitude for the next decades, initialised decadal predictions could be of great socio-economic value (Solomon et al., Citation2011). For this reason, the Coupled Model Intercomparison Project in its fifth phase (CMIP5) introduced a framework for initialised decadal predictions, in order to explore the ability of state-of-the-art earth system models and initialisation procedures to yield additional value to the long-term projections and to foster the scientific understanding of predictability on these time scales (see Taylor et al., Citation2012).
A well-respected paper about the challenges and problems regarding decadal predictions, coupled with a review of first associated studies was generated by Meehl et al. (Citation2009). Since then, with the now available CMIP5-experiments, more and more studies are published, dealing with decadal predictability and prediction skill. An updated review can be found in Meehl et al. (Citation2014), but some studies should be mentioned here. Most of them focus on primary meteorological parameters like mean surface air temperature and precipitation, evaluating individual model hindcasts (e.g. Müller et al., Citation2012; Boer et al., Citation2013; Goddard et al., Citation2013) or multimodel ensembles (e.g. Doblas-Reyes et al., Citation2013). Two recent studies analyse the decadal prediction skill regarding the frequency of temperature and precipitation extremes [Eade et al., Citation2012; Hanlon et al., Citation2013, both based on the Met Office Hadley Centre Decadal Prediction System (DePreSys)]. Vecchi et al. (Citation2013) evaluated the skill of a hybrid statistical–dynamical forecast system to predict North Atlantic hurricane frequency over lead times of several years.
A common result of all these studies is that there is some skill in decadal predictions, although differing over parameters, lead times and regions. This is also true for the studies on extremes, which point out that signal-to-noise ratios for these extremes over specific time scales and areas might be more favourable to predictability than those of mean quantities. An important point, highlighted by Solomon et al. (Citation2011) and illustrated impressively by van Oldenborgh et al. (Citation2012), is the fact that a large part of predictive skill on multiannual to decadal time scales is associated with external forcing, that is, a consequence of the long-term climate change signals. Thus, an initialisation with the actual state of the climate system is not necessary to exploit this skill. This is why it has to be critically examined, which additional information can be gained from initialisation. One way to answer this question is to compare against the ‘uninitialised’ climate projections.
Extra-tropical cyclones are important meteorological phenomena, particularly for the mid-latitudes. They play an important role for the transport of heat, moisture and momentum. Thus, their frequency is of great influence on other parameters like temperature (see, e.g., Raible, Citation2007), precipitation (see, e.g., Hawcroft et al., Citation2012; Pfahl and Wernli, Citation2012) and drought risk (Paredes et al., Citation2006). Additionally, intense extra-tropical cyclones can produce large fields of extreme wind speeds, causing extensive damage. According to estimates from the insurance industry (Munich Re Group, Citation2008), extra-tropical cyclones were responsible for approx. 25.2 bn€ overall losses (in values of 2006) in Europe during 1980–2006, constituting the most expensive type of natural catastrophe.
Hence, potential skill to predict enhanced or reduced frequencies of (intense) extra-tropical cyclones several months or even years ahead could be of great economic value if they enable stakeholders to decide on appropriate adaptation activities. In addition to this application-oriented motivation, analyses on decadal variabilities of cyclone frequency, their predictability and the respective prediction skill of current forecast systems will complement studies regarding other atmospheric and oceanic parameters. Thus, they will foster a better understanding of the physical processes behind potential predictive skill of several quantities, helping to clarify the reasons for existing or lacking skill of the models to predict other meteorological parameters, like the above mentioned temperature, precipitation or wind. So far – to our knowledge – no analyses in this respect beyond the seasonal time scale are available. The aim of this study is to – at least partly – fill this gap, by evaluating the skill of decadal predictions regarding northern hemispheric extra-tropical cyclones, employing the full ensembles in the sense of probabilistic forecasts.
Encouraged by the results of Renggli et al. (Citation2011a), who proved seasonal predictions of winter storm frequency for Europe and the North-East Atlantic region with a multimodel ensemble and some single-model ensembles to be significantly skilful, our study analyses the skill of probabilistic decadal predictions, concerning the frequency of (intense) cyclones over the whole extra-tropical Northern Hemisphere. Therefore, we analyse predictions produced by the Max-Planck-Institute Earth System Model in a low-resolution configuration (MPI-ESM-LR) with naturally longer lead times and for a spatially wider domain than CitationRenggli et al. (2011a), but also with enhanced spatial refinement by considering cyclone track densities, calculated on a regular grid.
Section 2 describes the data, that is, the model simulations and the chosen reanalysis. Section 3 depicts the cyclone identification and tracking algorithm, cyclone density estimation, bias and drift correction, as well as the ranked probability score (RPS) used as a verification measure. The results, containing a climatological comparison of cyclone track densities between model and reanalysis and naturally the verification results, are presented in Section 4. A summary and discussion of the results, as well as process-oriented interpretations and conclusions to be drawn are given in Section 5.
2. Data
2.1. MPI-ESM-LR-simulations
All simulations that are analysed in this study have been produced with the Max-Planck-Institute Earth System Model in a low-resolution configuration (MPI-ESM-LR, for a comprehensive description see Giorgetta et al., Citation2013) either in the context of CMIP5 or as part of MiKlip – the German initiative towards the development of an operational decadal prediction system. Its atmospheric component is ECHAM6 (see Stevens et al., Citation2013), run at a horizontal resolution of T63 with 47 vertical levels up to 0.1 hPa. The ocean component is MPIOM (see Jungclaus et al., Citation2013) with a nominal resolution of 1.5° and 40 vertical levels.
In the present study, we investigate two sets of decadal hindcasts that have been produced with this model system. A description of the first set – called baseline0 within the MiKlip-context – has been given by Müller et al. (Citation2012). Baseline0 is identical to the decadal predictions, set up as part of the CMIP5-experiment (Taylor et al., Citation2012); 10 ensemble members have been initialised every 5 yr, starting in 1961, and three ensemble members have been initialised in all remaining years (1962–1965, 1967–1970, …). Initialisation has been realised from anomaly fields of a separate assimilation experiment, the ensemble is spanned via lagged-day-initialisation. Here, we consider all initialisations for 1961–2001, thus 41 hindcasts in total, each of them run for a period of 10 yr with external forcings according to observed greenhouse gas and aerosol concentrations. Further simulations have been initialised on an annual basis for the years since 2002. These will not be taken into account here as they are extending into the future and there is no observational product to verify them against.
Müller et al. (Citation2012) show that baseline0 has skill in forecasting seasonal means of surface temperature for large parts of the extra-tropical North Atlantic, but performs poorly for the tropics beyond hindcast year 1.
The second set, called baseline1, is produced with the same model and configuration. The difference with baseline0 is the initialisation procedure: baseline1-hindcasts are initialised by nudging atmospheric fields from ERA40- and ERA-Interim-reanalyses (see Uppala et al., Citation2005; Dee et al., Citation2011) as full fields into MPI-ESM-LR, combined with a nudging of oceanic temperature and salinity anomalies from ORA-S4-reanalysis (see Balmaseda et al., Citation2013). The baseline1-hindcasts have been initialised annually from 1961, each initialisation consists of 10 ensemble members, making it equivalently 41 complete hindcasts (the last initialisation again in 2001) run over 10 yr, to be verified against observations. As for baseline0, further predictions have been annually initialised after 2001, but will be disregarded for this study.
An in-depth characterisation of this forecast system, together with analyses of the general differences between the two systems, as well as the influence of resolution can be found in Pohlmann et al. (Citation2013). Their study shows that the initialisation from reanalysis fields enabled MPI-ESM-LR to get rid of the negative predictive skill regarding surface temperatures in the tropics, while the influence on the extra-tropics is rather limited.
Analogous to other studies on decadal prediction skill, we quantify the benefit that can be gained by initialising the model from the actual states of ocean and atmosphere, by comparing hindcasts against the results of climate projections – so called uninitialised simulations – produced with basically the same model configuration. These are identical to the CMIP5-historical-experiments and contain potential prediction skill resulting solely from the long-term responses to external forcings. Overall, an ensemble of 10 simulations (three for CMIP5, seven within the MiKlip-initiative) was produced and analysed for the present study. The ensemble is generated by starting the individual runs from different phases of a pre-industrial control simulation, forced by observed aerosol and greenhouse gas concentrations over the period 1850–2005 and following the RCP4.5-scenario thereafter. In correspondence to the available hindcasts and observational data, the period 1961–2010 is analysed.
The differing ensemble size within the baseline0-system and in comparison to baseline1 and the uninitialised runs poses a challenge for a fair evaluation of forecast skill. This issue is addressed in Section 3.4.
2.2. 20th Century Reanalysis (20CR)
For the evaluation of the hindcasts, we use the 20th Century Reanalysis (20CR, Compo et al., Citation2011). 20CR has been produced by assimilating surface pressure observations only; sea surface temperatures and sea ice from the HadISST1.1-dataset (Rayner et al., Citation2003) make up the lower boundary forcing. The reanalysis is based on Ensemble-Kalman-filtering with 56 members, thus delivering uncertainty estimates. Unlike other analysis products, 20CR covers the whole period of available decadal hindcasts. The widely used NCEP/NCAR Reanalysis project 1 data (NCEP1, see Kalnay et al., Citation1996) would have been a suitable alternative. However, 20CR suffers less from inhomogeneities (for the NH in the period after 1960) than NCEP1, as supported by Wang et al. (Citation2013).
3. Methods
3.1. Cyclone identification and tracking
A fully automatic scheme identifies and tracks cyclones. This scheme was originally developed for the Southern Hemisphere by Murray and Simmonds (Citation1991a) and later adapted for the Northern Hemisphere by Pinto et al. (Citation2005). Cyclone identification is based on the laplacian of sea-level pressure (SLP). Cyclones of individual time steps are combined to a track by connecting the individual features with the help of their individual velocity vectors. Features, identified in regions of high orography are excluded to avoid artefacts from far reduction of surface pressure to sea level. In the face of the following analyses, particularly the hindcast verification on a grid-point basis, it is desirable to exclude the same areas in all datasets. Hence, the higher resolved orography of MPI-ESM-LR is used in all cases. This is possible, as the identification and tracking scheme of Murray and Simmonds (Citation1991a) includes an internal interpolation of all input data onto a 0.75°-grid.
The algorithm has been proven useful for studying extra-tropical cyclones over large parts of the Northern Hemisphere in several studies (e.g. Leckebusch and Ulbrich, Citation2004; Pinto et al., Citation2005, Citation2007; Donat et al., Citation2010; Nissen et al., Citation2013a) and has also been used within the Intercomparison of Mid-Latitude Storm Diagnostics (IMILAST) (Neu et al., Citation2013; Ulbrich et al., Citation2013) framework, comparing 15 different commonly used cyclone identification schemes.
All analyses in this paper are presented for the Northern Hemisphere poleward of 30°N. To avoid boundary effects, the cyclone identification scheme has been run for model and reanalysis data north of 20°N. The identification and all further analyses are constrained to the boreal winter half year – from October to March (ONDJFM).
Apart from considering the total number of cyclones that can be identified, intense cyclones are of particular interest. From the stakeholder perspective, these extreme events are associated with the largest impacts rendering their potential forecast skill particularly relevant. From the academic point of view, it might turn out that predictability is different for extremes compared to the totality of cyclones. To compile such a subsample of intense systems, the maximum laplacian of SLP during the life-cycle of each cyclone was used as intensity measure. In earlier studies, extreme cyclones have been defined as the strongest 5–10% of all identified systems with respect to this parameter (Leckebusch and Ulbrich, Citation2004; Pinto et al., Citation2009; Ulbrich et al., Citation2013). Nissen et al. (Citation2010, Citation2013a) could show for the Mediterranean that 25–30% of all cyclones, detected with the scheme of Murray and Simmonds (Citation1991a), can be associated with synoptic-scale fields of extreme, potentially damaging wind speeds. We extended this analysis onto the whole Northern Hemisphere, identifying this fraction to be considerably larger over the North Atlantic and Pacific and smaller over North America and Asia. On average, approximately one quarter of all northern hemispheric extra-tropical cyclones are related to features of this kind. Hence, we consider cyclones as being intense if they belong to the strongest 25% based on the winters 1961/62–2000/01. For MPI-ESM-LR the according threshold was obtained from the historical runs (all ensemble members) over the respective period.
3.2. Track densities
For seasonal and decadal predictions, as well as for climate projections, not the individual cyclone is of interest but statistics of cyclone characteristics, such as the total number of cyclones, the intensity distribution, the cyclone track density or the cyclone flux as a spatial field on a grid. Variants of the latter are the number of cyclone tracks (i.e. travelling features) crossing a region of about 1 000 000 km2 (e.g. Hodges et al., Citation2003). Sometimes, a weighting of cyclones according to their distance to the respective grid point is applied (e.g. Murray and Simmonds, Citation1991b).
Here, we calculate cyclone track densities on a regular 2.5°-grid as the number of cyclone tracks per extended winter season (ONDJFM) within a radius of 1000 km (great circle distance) around a given grid point. The reason for this comparably large area (π· 1 000 000 km2) is to allow less accuracy of the forecasts on interannual to decadal scales. This means, although the results are presented on the 2.5°-grid, the effective resolution is much coarser; thus the auto-correlation in the spatial domain needs to be accounted for when interpreting results point-wise. Track densities have been obtained for all individual hindcast and reanalysis ensemble members. The resulting 56 densities for 20CR were averaged to yield the ensemble mean for every winter season, constituting the final observational product to verify against. Track densities for grid points with orographic elevation of more than 1000 m above sea level were disregarded to comply with the aforementioned restriction to areas without pronounced orography. For this purpose, the orography of MPI-ESM-LR was bilinearly interpolated onto the 2.5°-grid, used for the track density calculation.
When evaluating forecast skill, winter 1 (10–15 months after initialisation), winter 2 (22–27 months after initialisation), as well as averages of winter 2–5 and winter 6–9 will be analysed. This temporal aggregation over several years is in compliance with the suggestions of Goddard et al. (Citation2013) when verifying decadal predictions.
3.3. Corrections for bias and potential drift
For both sets of decadal hindcasts, baseline0 and baseline1, cross-validated bias corrections according to the procedure recommended by the International CLIVAR Project Office (ICPO) (Citation2011) were carried out. The bias correction accounts for the possibility of systematic model drifts over forecast time by calculating the bias conditional on the lead time. In our case, for each initialisation and each of the nine winters hindcast, a separate bias is obtained (from all other initialisations) and subtracted. Gangstø et al. (Citation2013) suggest fitting an exponential or third order polynomial relaxation curve to the drift instead of obtaining individual estimates of the bias for increasing lead times. This procedure is motivated from the sampling problem common to most decadal hindcasts performed within CMIP5: they have a very limited number of initialisations. We tested the impact of these approaches, finding only negligible effects for our results (not shown). Apparently, the number of (41) available initialisations is high enough to permit usage of the conventional drift correction via the cross-validated bias.
3.4. Skill measure: ranked probability skill score
We confine the number of degrees of freedom by reducing the information of the individual ensemble members regarding cyclone frequency at the individual grid points into categorical forecasts, defining three equiprobable classes (below normal, normal, above normal). The appropriate forecast score is the RPS (see, e.g., Wilks, Citation2006), based on the empirical cumulative distribution function of the ensemble members:
F τ,i,k is the cumulative probability derived from the ensemble of initialisation i (with a total number of initialisations I=41) within class k (with three classes, i.e. K=3) for a specific forecast lead time τ, that is, the fraction of ensemble members forecasting the occurrence of class k or lower. O t(i,τ),k is the cumulative probability of class k from observations for the time t(i,τ), corresponding to the time of initialisation and forecast lead time. O t(i,τ),k is effectively the Heaviside step function with O t(i,τ),k =0 if a value within a class higher than k is observed or else O t(i,τ),k =1.
Several papers (Richardson, Citation2001; Müller et al., Citation2005; Ferro, Citation2007) highlighted that the RPS is biased for finite ensemble sizes (the smaller the ensemble size, the larger the bias) and developed methods to overcome this problem. A synthesis of their results has been published in the work of Ferro et al. (Citation2008), yielding the most general approach. According to their results, RPS
τ,M
, the RPS of the forecast system with hypothetical ensemble size M, can be estimated from RPS
τ,m
, the respective RPS of the existing forecast system with m ensemble members (m=10 for baseline1 and the uninitialised runs) by:2
Equation (2) yields an unbiased estimator for M→∞. Here, we additionally have to account for varying ensemble sizes of baseline0, depending on initialisation times (m
i
=10 if t(i) = 1961, 1966, … and else m
i
=3). Therefore, the forecast scores are derived from:3
An estimate of the benefit of a given decadal forecast system (fc) over some reference forecast (ref), that is, its skill, is given by the ranked probability skill score (RPSS) as an accuracy measure for a skill score:4
A popular reference forecast is the climatological forecast: RPSref,τ
=RPSclim,τ
. It will not be subject to any bias correction as in eq. (2) or (3), as the climatological forecast complies with the fully known historical probability distribution, forecasting cumulative probabilities of for any i and τ. RPSclim,τ
is calculated according to eq. (1).
As described above, the terciles for categorising the forecasts, that is, the limits dividing into three equiprobable classes, are calculated from the reanalysis track densities and their counterpart from the uninitialised runs. For some grid points these class limits are identical. This results in ambiguous class definitions, leading to the problem that some forecasts cannot be definitely classified. One example of this problem occurs at the lower latitudes which experience very few (intense) extra-tropical cyclones, detected with the here-applied scheme. Some grid points experience no cyclones in at least two thirds of all years (historically). Here, the two class limits are identically zero. The problem exists also for multiyear averages, although mitigated by the averaging. As cyclone track densities according to our calculation for single winter seasons are integers by definition, we decided to exclude grid points that show a difference between the two class limits smaller than one for reanalysis or the model, independent of averaging period.
Statistical significance for the skill scores is estimated from bootstrapping by 1000-fold re-sampling the 41 hindcasts and applying a one-sided test at the 5% level.
4. Results
4.1. Climatology
Climatological northern hemispheric ensemble mean track densities for the extended winter season (ONDJFM) have been derived for 20CR, as well as for the MPI-ESM-LR historical runs over the time period 1961/62–2000/01 (a). The differences show a positive bias for MPI-ESM-LR in most regions. The bias is particularly prominent for the North American and Eurasian continents. The subtropical North-West Pacific is the only region with a notable negative bias when considering all identified cyclones. This pattern is mostly similar to the bias of the model's predecessor ECHAM5/MPIOM as found by Pinto et al. (Citation2007, comparing to NCEP1) and Bengtsson et al. (Citation2006, comparing to ERA40).
Fig. 1 Climatological (1961/62–2000/01) track density (ensemble means) of (a) all cyclones and (b) intense cyclones as number of tracks per winter (ONDJFM) within vicinity of 1000 km for 20CR (black contours) as well as the bias of the uninitialised runs of MPI-ESM-LR (shaded); areas of high orography are masked out (grey).
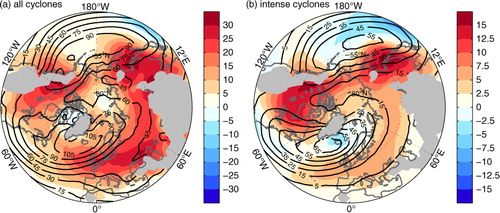
Indeed, neither of the two studies confirms the generally positive model bias which is obvious in our plots but additional investigations (not shown here) reveal that this feature arises from 20CR, showing significantly less cyclones than NCEP1 or ERA40. Both studies show a distinct cut of the Pacific storm track when reaching the North American continent, which is less pronounced in the model compared to reanalyses, probably due to under-represented orography along the North American West Coast. Pinto et al. (Citation2007) described the northeastward shift of cyclone pathways over the western subtropical North Pacific and the relative underestimation of cyclone frequency over the Baffin Bay (see their c and d). Bengtsson et al. (Citation2006) highlighted the overestimation of cyclogenesis around the Caspian Sea and over Southern China. All of these observations are in full agreement with our results for MPI-ESM-LR. However, results do not agree regarding the findings of Bengtsson et al. (Citation2006) with respect to underestimated cyclogenesis in the lee of the Rocky Mountains; here we find a major overestimation instead (cyclogenesis plots not shown here). Their study analyses a different model version, compares to a different reanalysis and uses a quite different identification and tracking algorithm (Hodges, Citation1995). Whereas their scheme uses 850 hPa relative vorticity as a basic metric and contains interpolation to a lower resolution, the algorithm of Murray and Simmonds (Citation1991a) examines the laplacian of SLP, including an interpolation to higher resolution. We assume that these identification procedures are the main source of differing results in this respect.
Restricting the comparison to intense cyclones (b), a dipole-like pattern of the bias over the North Atlantic becomes visible and the dipole over the western North Pacific relatively strengthens, mainly because of the negative bias in the subtropics. While the latter with the orientation of the negative (positive) differences along the southern (northern) edge of the 20CR storm track confirms the northward shift of the North Pacific storm track, already diagnosed from a, the Atlantic dipole points towards a too zonal storm track. Negative differences are to be found in the core of the eastern part of the North Atlantic storm track, while the southern edge coincides with positive differences. This is a very common feature for General Circulation Models (GCMs) as shown for example by Ulbrich et al. (Citation2008). Our results do agree well with their findings for the difference of the ensemble mean of 16 GCMs and NCEP1, even though they evaluated band-pass filtered SLP variability rather than cyclone track densities.
We show no significance information in to avoid informational overload. However, considering all (intense) cyclones, differences roughly beyond ±5 (±2.5) cyclones per winter can be seen as statistically significant on the 5%-level according to a two-sided t-test, although it should be stated that these differences originate not only from shortcomings of the model, but also from the specific characteristics of 20CR, which exhibits significantly less cyclones than, for example, NCEP1 over large parts of the Northern Hemisphere.
An eventual impact of the described model bias on prediction skill is to be kept in mind when interpreting further results and will be discussed in Section 5.2.
4.2. Verification of decadal hindcasts
Part of the forecast skill for decadal predictions might be a result of a long-term climate signal. The additional skill via initialisation from actual oceanic and atmospheric climate states can be obtained by comparing the decadal hindcasts to simulations which exhibit realistic long-term responses to external forcings. We found the difference of skill scores against the uninitialised runs to skill against climatological forecasts to be marginal. This indicates that a long-term climate change signal is small compared to interannual and perennial variations in the given time period, which is why we show only the results with respect to skill against the uninitialised integrations.
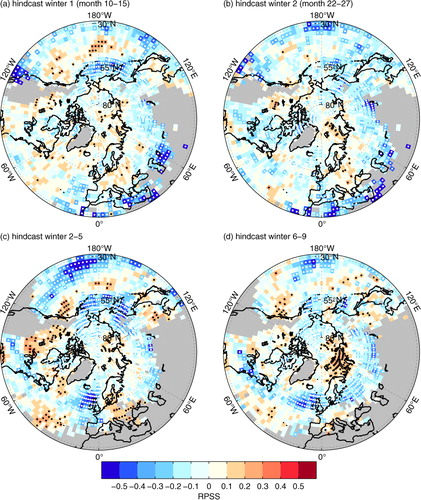
The skill of baseline0 with initialisation from the assimilation run is depicted in with respect to all identified cyclones. Positive skill for the first winter hindcast (month 10–15, a) is rather small. The skill scores across the Northern Hemisphere are scattering around zero. In light of the spatial auto-correlation resulting from our method of calculating track densities, the regions showing skill scores significant at the 5%-level are generally too small to be noteworthy or even interpretable.
Fig. 2 RPSS of baseline0 over uninitialised runs regarding the track density (number of tracks per ONDJFM in the vicinity of 1000 km) of all identified cyclones, significant skill scores (α<5%) as black/white dots, areas of high orography or ambiguous class definitions are masked out (grey).
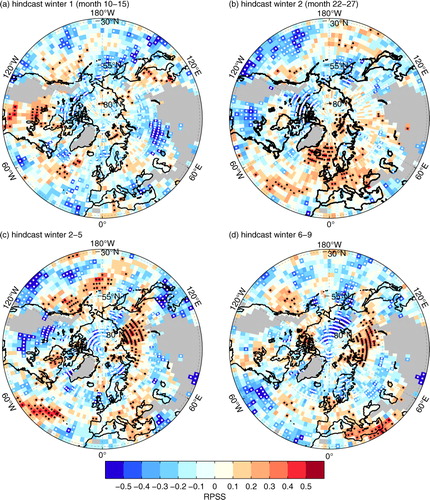
The hindcasts for winter 2 (month 22–27, b) show a remarkably different picture: while skill is significantly negative over the subtropical north-eastern Pacific and North America, the results for the North Atlantic are promising. Here, significantly positive skill can be found for a large contiguous area over the North-East Atlantic.
Overall, forecasts for perennial means of cyclone frequency are less skilful. For winters 2–5 (c), the significantly negative skill over the whole North American sector intensifies while the positive skill over the subpolar North Atlantic and most of Europe vanishes. Only the significant positive skill over the subtropical North Atlantic, at the southernmost border of the Atlantic stormtrack remains and even strengthens. Furthermore, some skill over the mid-latitudinal Pacific and over Siberia emerges.
For hindcast winters 6–9 (d) very few areas show any significant skill at all. Only the Siberian storm track and the cyclone frequency over the eastern Mediterranean seem to be predictable on these time scales; an area of similar size shows significantly negative skill scores over the Arctic Sea west of the date line.
Regarding the track density forecasts of intense cyclones, baseline0 effectively has no skill at all over the NH for the first hindcast winter (a). Winter 2 (b) shows significant positive skill over the subpolar and subtropical North Atlantic, similar to the analyses of all cyclones. However, skill is zero or negative along the Gulf Stream and for North America. On the other hand, the North Pacific is characterised by predominantly positive skill scores, peaking along the Kuroshio Extension at approx. 40°N.
Fig. 3 RPSS of baseline0 over uninitialised runs regarding the track density (number of tracks per ONDJFM in the vicinity of 1000 km) of intense cyclones only (∇2(SLP)>75th perc.), significant skill scores α.
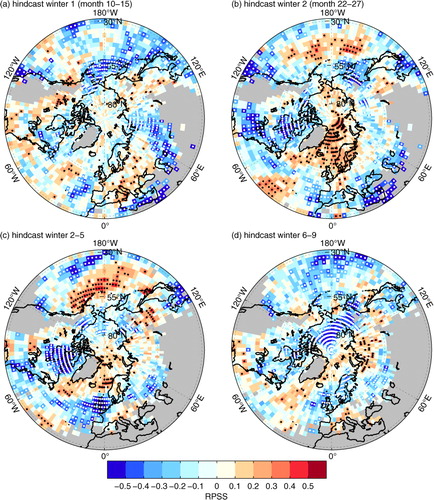
Positive skill in this area becomes even more evident when evaluating winters 2–5 (c) with skill scores up to 0.4 and beyond, slightly shifted northward into the core of the Pacific storm track along the Aleutians. The core of the Atlantic storm track is also characterised by comprehensively positive skill scores, although slightly below the chosen threshold of statistical significance, while its southern flank exhibits significantly negative skill all the way from the North American East Coast to the British Isles. The latter is also true for parts of Canada. Similar to the evaluation of all cyclones, the hindcasts for intense cyclone frequencies in winter 6–9 (d) exhibit little skill.
The baseline1-system – initialised from reanalysis data – exhibits little skill over the uninitialised runs in predicting extra-tropical cyclone frequencies over the Northern Hemisphere ( and ), no matter if all cyclones are considered or intense cyclones only. Compared to the results of baseline0, it performs slightly better in forecast winter 1 (a and 5a), especially over the North Pacific although mostly below the chosen level of statistical significance (α < 5%). Looking back on the promising results of baseline0 for winter 2 and winters 2–5, all of this skill is lost when initialising the prediction system from reanalysis fields (b, 4c, 5b and 5c). Only the eastern part of the Pacific storm track and Canada exhibit some skill for winters 2–5, whereupon this is slightly more explicit for track densities of all cyclones than for those of intense cyclones only. This feature of positive skill over the eastern North Pacific (regarding all cyclones) is even more evident for winters 6–9 (d), clearly outperforming baseline0 here.
Fig. 4 RPSS of baseline1 over the uninitialised runs regarding the track density (number of tracks per ONDJFM in the vicinity of 1000 km) of all identified cyclones, significant skill scores (α<5%) as black/white dots, areas of high orography or ambiguous class definitions are masked out (grey).
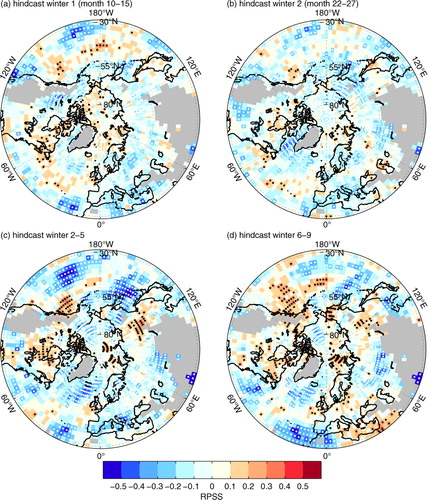
Fig. 5 RPSS of baseline1 over uninitialised runs regarding the track density (number of tracks per ONDJFM in the vicinity of 1000 km) of intense cyclones only (∇2(SLP)>75th perc.), significant skill scores α.
5. Discussion, interpretation and conclusions
5.1. Summary and discussion
We estimated the skill of probabilistic decadal forecasts of cyclone frequency made by MPI-ESM-LR within MiKlip – the German initiative for decadal predictions. The model was initialised annually from 1961–2001 and produced 41 hindcasts for 10 yr each. The hindcasts were evaluated for the extra-tropical Northern Hemisphere and skill was estimated over uninitialised runs as well as over the climatological forecast with the 20th Century Reanalysis as reference. The effect of different initialisation techniques was investigated by comparing the hindcasts of the baseline1-system to baseline0; the former was initialised from reanalysis fields and the latter from an assimilation experiment. The baseline0-system is identical to the MPI-ESM-LR decadal hindcasts produced within CMIP5.
For the first winter forecast (month 10–15), we found little skill over the uninitialised runs for both initialisation approaches. The baseline1-hindcasts show some positive skill (significant at 10%-level) for the mid-latitudinal North Pacific and North Atlantic cyclone track densities; baseline0 performs worse for this lead time with positive skill only over North America. In contrast, baseline0 exhibits remarkably positive skill for winter 2 (month 22–27) over Europe, large parts of the North Atlantic and the North Pacific. The baseline1-hindcasts however have no skill for this lead time.
Perennial averages of winters 2–5 for baseline0 perform better than those of baseline1. They show significant skill in forecasting the frequency of intense cyclones along the North Pacific and North Atlantic storm tracks. Over the North Atlantic, this is not the case if all detected cyclones are considered. Comparing prediction skill over different lead times, it is noteworthy that skill scores for baseline0 and winter 2–5 are higher than those for winter 2 alone over the North Pacific, while the opposite is true for the North Atlantic. For lead times of 6–9 yr, Northern Hemisphere cyclone frequencies do not seem to be predictable with the forecast system under consideration. One exception might be the eastern portion of the North Pacific storm track: here baseline1 shows some skill considering all detected cyclones.
Various factors influence the results obtained: the choice of the cyclone identification scheme is likely to be a minor issue, as Neu et al. (Citation2013) could show that interannual variability and long-term trends of cyclone frequency over a large area (hemispheres in their case) are rather insensitive to the choice of a specific algorithm. To test for the sensitivity to different reanalyses as reference, we calculated all skill scores presented in this study with 20CR replaced by the NCEP1-reanalysis and a combination of ECMWF reanalyses ERA40 and ERA-Interim (results not shown). Overall results are very similar, except for the baseline0-forecasts of winter 2–5: considering all detected cyclones, the estimated skill scores based on NCEP1 and ERA are lower over the Gulf Stream than those calculated based on 20CR (see c), that is, negative instead of neutral. For intense cyclones the significant skill along the North Pacific storm track (see c) vanishes with NCEP1 or ERA as reference, while skill scores over the North Atlantic storm track are in between those based on NCEP1 (higher) and ERA (lower). In this respect it seems as if the patterns over the North Atlantic are quite robust against choosing different observational datasets while this is not the case for the North Pacific. Wang et al. (Citation2013) showed that NCEP1 exhibits much stronger trends with respect to cyclonic activity over the North Atlantic and the North Pacific compared to 20CR. They speculate that this might be an artefact due to known inhomogeneities in NCEP1. The combination of ERA40 and ERA-Interim required corrections for systematic differences of mean and variance with respect to cyclone frequencies, introducing additional uncertainty. It is thus arguable whether one of these reanalyses provides a more reliable reference than 20CR when evaluating decadal hindcasts over the past 50 yr.
Consequently, it is desirable to account for uncertainties in observations when estimating skill. Besides the general opportunity to use several reanalyses (impeded by different periods covered), 20CR comes with an uncertainty estimate which could be exploited. However, the estimator of an unbiased RPS (Ferro, Citation2007; Ferro et al., Citation2008) employed in this study in the form of eq. (3) is not applicable for uncertain observations. This is the same for the suggestion of Fricker et al. (Citation2013), to not only calculate and verify predictions of perennial averages but also to conduct temporal pooling of the hindcasts for a particular period. This would be particularly useful from a climate impact perspective, as it is often a single winter exhibiting extreme frequency of intense cyclones, associated with large economic losses.
Thus, in line with the argument of Fricker et al. (Citation2013), it would be of great value to verify the predictions of these shorter time-scale predictands, but the development of an alternative estimator of an unbiased RPS – applicable for any kind of observation not necessarily constituting the Heaviside step function – is beyond the scope of this study. However, such a development would be crucial for a fair assessment of any kind of probabilistic forecast skill based on the Brier score (BS), the RPS, or the continuous ranked probability score (CRPS).
5.2. Process-oriented interpretation
In addition to these rather technical issues, questions regarding the decadal prediction system itself, as well as its abilities and deficiencies can be assumed to be important. A process-oriented interpretation of predictive skill requires analysing the skill with respect to other atmospheric and oceanic parameters. We expect the oceanic forcing of meridional temperature gradients in the lower troposphere to be the main source of skill for cyclone frequencies on interannual to decadal time scales. The ocean modulates lower tropospheric baroclinicity which is an important factor for the development of extra-tropical cyclones. The role of Atlantic SST and baroclinicity for windstorms associated with cyclones was recently supported by Renggli et al. (Citation2011a, 2011b) and Nissen et al. (Citation2013b). Targeting time-scales shorter (seasonal in the papers of Renggli et al.) and longer (multidecadal in the work of Nissen et al.), they yield similar North Atlantic SST-anomaly-patterns favourable for winter storms over Europe. This motivates us to investigate whether similar SST-patterns influence the perennial variability of (intense) extra-tropical cyclones north and north-west of continental Europe.
Based on 20CR and the underlying HadISST1.1-dataset, we could confirm that SST anomalies especially over the mid-latitudinal North Atlantic south-east of Greenland are highly important for the frequency of intense cyclones over the area from the mid-latitudinal North Atlantic to the Arctic Ocean (not shown here); a region where baseline0 exhibits significantly positive skill for cyclones for lead times of 2 and 2–5 yr (see b and 3c).
With respect to the model's ability to predict North Atlantic ocean currents, upper ocean heat content and SST, the study of Müller et al. (Citation2012) shows that the baseline0-system exhibits significant skill in predicting surface air temperatures over the mid-latitudinal North Atlantic south-east of Greenland for lead times of 2–5 yr (and the same can be shown for the closely related SST).
On the other hand, Müller et al. (Citation2012) point out that MPI-ESM-LR exhibits a zonal extension of the North Atlantic current, leading to enormous temperature biases in this region (elaborately shown by Jungclaus et al., Citation2013), which Müller et al. (Citation2012) expect to have a negative influence on the simulated atmosphere. The results of Brayshaw et al. (Citation2011) from idealised simulations with the atmosphere model HadAM3 indicate that this misrepresentation of oceanic currents (and hence SST gradients) may be partly responsible for the North Atlantic storm track being too zonal in the MPI-ESM-LR. The implications of this feature (and similarly a shift of the North Pacific storm track) for predictive skill can be expected to be large. Even if the model was able to forecast the observed temporal variability of the storm track activity after initialisation, its dislocation compared to reanalysis degrades skill. Thus, we hypothesise that a better representation of the North Atlantic currents in the model would be beneficial for the position and orientation of the model's North Atlantic storm track and hence predictive skill regarding cyclone frequency further downstream.
5.3. Dependence on initialisation and conclusions
Initialisation differs substantially for baseline1 and baseline0. Pohlmann et al. (Citation2013) show that baseline1 yields significantly better predictions compared to baseline0 (year 1 and 2–5) for surface air temperature in the tropics and global mean temperature. Results for the Northern Hemisphere extra-tropics are, however, generally worse than those of baseline0 after year 1 (see their b). This is in line with our work stating that baseline1 yields SST predictions for the mid-latitudinal North Atlantic only slightly better (but still not significant) than those of uninitialised simulations (not shown here) while there is an obvious skill for baseline0. This explains the lack of skill for baseline1 regarding the North Atlantic storm track.
Regarding the North Pacific, baseline1 performs worse than baseline0 in predicting SST (and related gradients) along the Kuroshio Extension for 2–5 yr lead time (not shown here but visible in b of Pohlmann et al., Citation2013), which might offer an explanation for the lack of skill regarding the predictions of the North Pacific storm track. However, a thorough explanation or hypothesis for the significant skill in baseline0 is still missing, as its SST predictions along the Kuroshio Extension and related SST gradients do not show significant skill over uninitialised simulations (not shown).
We could not clarify why baseline0-predictions of the second winter are generally better than those of the first winter, either. One hypothesis in this context could be some initialisation shock, introducing physical inconsistencies into the model, impeding predictive skill for the first winter but dissolved within the second forecast year. However, the initialisation strategy followed for baseline0 makes this very unlikely, as the initialisation fields for atmosphere and ocean were derived from an assimilation run, that is, originate from the model itself.
Consequently our findings in this respect should be considered as a first step in the assessment and understanding of skill for extreme events. Although we offer a physical consistent line of argument for skill over the North Atlantic at lead times from 2 to 5 yr, compatible with previous findings, we are not able to explain the difference in skill between the first and following winter cyclone frequency. The same has to be stated with respect to the yet unclear origin of baseline0's skill over the North Pacific. Further analyses in this respect are necessary to clarify these issues.
Future work in the context of predictability and prediction skill of extra-tropical cyclone frequencies will thus have to further focus on process-oriented analyses in order to foster confidence in observed predictive skill. Thereby, it potentially will help improving existing forecast systems as the ones examined in this study.
Nevertheless, the results of the present study are encouraging with respect to the perspectives of decadal predictions. They clearly show that there is potential for regional probabilistic forecasts of cyclone frequency over the Northern Hemisphere up to several years ahead. Larger ensembles and multimodel ensembles are likely to be able to deliver more stable estimations of predictive skill, spatially and temporally.
6. Acknowledgements
We acknowledge funding from the Federal Ministry of Education and Research in Germany (BMBF) through the research programme MiKlip (FKZ: 01LP1104A) and partly from Munich Re. Support for the Twentieth Century Reanalysis Project dataset is provided by the US Department of Energy, Office of Science Innovative and Novel Computational Impact on Theory and Experiment (DOE INCITE) program, and Office of Biological and Environmental Research (BER), and by the National Oceanic and Atmospheric Administration Climate Program Office.
Personally, we would like to thank Mareike Schuster and Bruno U. Schyska for their commitment to an efficient implementation of the cyclone identification scheme for the decadal forecasts.
Related Research Data
References
- Balmaseda M. A. , Mogensen K. , Weaver A. T . Evaluation of the ECMWF ocean reanalysis system ORAS4. Q. J. Roy. Meteorol. Soc. 2013; 139(674): 1132–1161.
- Bengtsson L. , Hodges K. I. , Roeckner E . Storm tracks and climate change. J. Clim. 2006; 19(15): 3518–3543.
- Boer G. , Kharin V. , Merryfield W . Decadal predictability and forecast skill. Clim. Dynam. 2013; 41: 1817–1833.
- Brayshaw D. J. , Hoskins B. , Blackburn M . The basic ingredients of the North Atlantic Storm Track. Part II: sea surface temperatures. J. Atmos. Sci. 2011; 68(8): 1784–1805.
- Compo G. P. , Whitaker J. S. , Sardeshmukh P. D. , Matsui N. , Allan R. J. , co-authors . The twentieth century reanalysis project. Q. J. Roy. Meteorol. Soc. 2011; 137(654): 1–28.
- Dee D. P. , Uppala S. M. , Simmons A. J. , Berrisford P. , Poli P. , co-authors . The ERA-Interim reanalysis: configuration and performance of the data assimilation system. Q. J. Roy. Meteorol. Soc. 2011; 137(656): 553–597.
- Doblas-Reyes F. J. , Andreu-Burillo I. , Chikamoto Y. , Garcia-Serrano J. , Guemas V. , co-authors . Initialized near-term regional climate change prediction. Nat. Commun. 2013; 4: 1715.
- Donat M. G. , Leckebusch G. C. , Pinto J. G. , Ulbrich U . European storminess and associated circulation weather types: future changes deduced from a multi-model ensemble of GCM simulations. Clim. Res. 2010; 42(1): 27–43.
- Eade R. , Hamilton E. , Smith D. M. , Graham R. J. , Scaife A. A . Forecasting the number of extreme daily events out to a decade ahead. J. Geophys. Res. Atmos. 2012; 117: D21110.
- Ferro C. A. T . Comparing probabilistic forecasting systems with the brier score. Weather Forecast. 2007; 22(5): 1076–1088.
- Ferro C. A. T. , Richardson D. S. , Weigel A. P . On the effect of ensemble size on the discrete and continuous ranked probability scores. Meteorol. Appl. 2008; 15(1): 19–24.
- Fricker T. E. , Ferro C. A. T. , Stephenson D. B . Three recommendations for evaluating climate predictions. Meteorol. Appl. 2013; 20(2): 246–255.
- Gangstø R. , Weigel A. P. , Liniger M. A. , Appenzeller C . Methodological aspects of the validation of decadal predictions. Clim. Res. 2013; 55(3): 181–200.
- Giorgetta M. A. , Jungclaus J. , Reick C. H. , Legutke S. , Bader J. , co-authors . Climate and carbon cycle changes from 1850 to 2100 in MPI-ESM simulations for the coupled model intercomparison project phase 5. J. Adv. Model. Earth Syst. 2013; 5(3): 572–597.
- Goddard L. , Kumar A. , Solomon A. , Smith D. , Boer G. , co-authors. A verification framework for interannual-to-decadal predictions experiments. Clim. Dynam. 2013; 40(1–2): 245–272.
- Hanlon H. M. , Hegerl G. C. , Tett S. F. B. , Smith D. M . Can a decadal forecasting system predict temperature extreme indices?. J. Clim. 2013; 26(11): 3728–3744.
- Hawcroft M. K. , Shaffrey L. C. , Hodges K. I. , Dacre H. F . How much Northern Hemisphere precipitation is associated with extratropical cyclones?. Geophys. Res. Lett. 2012; 39: L24809.
- Hodges K . Feature tracking on the unit-sphere. Mon. Weather Rev. 1995; 123(12): 3458–3465.
- Hodges K. I. , Hoskins B. J. , Boyle J. , Thorncroft C . A comparison of recent reanalysis datasets using objective feature tracking: storm tracks and tropical easterly waves. Mon. Weather Rev. 2003; 131(9): 2012–2037.
- International CLIVAR Project Office (ICPO). Data and Bias Correction for Decadal Climate Predictions. 2011. Online at: http://www.wcrp-climate.org/decadal/references/DCPP_Bias_Correction.pdf, compiled by CMIP-WGCM-WGSIP Decadal Climate Prediction Panel.
- Jungclaus J. H. , Fischer N. , Haak H. , Lohmann K. , Marotzke J. , co-authors. Characteristics of the ocean simulations in the Max Planck Institute Ocean Model (MPIOM) the ocean component of the MPI-Earth system model. J. Adv. Model. Earth Syst. 2013; 5(2): 422–446.
- Kalnay E. , Kanamitsu M. , Kistler R. , Collins W. , Deaven D. , co-authors. The NCEP/NCAR 40-year reanalysis project. Bull. Am. Meteorol. Soc. 1996; 77(3): 437–471.
- Leckebusch G. C. , Ulbrich U . On the relationship between cyclones and extreme windstorm events over Europe under climate change. Global Planet. Change. 2004; 44(1–4): 181–193.
- Meehl G. A. , Goddard L. , Murphy J. , Stouffer R. J. , Boer G. , co-authors. Decadal prediction – can it be skillful?. Bull. Am. Meteorol. Soc. 2009; 90(10): 1467–1485.
- Meehl G. A. , Goddard L. , Boer G. , Burgman R. , Branstator G. , co-authors . Decadal climate prediction: an update from the trenches. Bull. Am. Meteorol. Soc. 2014. 95(2), 243–267.
- Müller W. A. , Appenzeller C. , Doblas-Reyes F. J. , Liniger M. A . A debiased ranked probability skill score to evaluate probabilistic ensemble forecasts with small ensemble sizes. J. Clim. 2005; 18(10): 1513–1523.
- Müller W. A. , Baehr J. , Haak H. , Jungclaus J. H. , Kröger J. , co-authors. Forecast skill of multi-year seasonal means in the decadal prediction system of the Max Planck Institute for Meteorology. Geophys. Res. Lett. 2012; 39: L22707.
- Munich Re Group. Knowledge Series: Highs and Lows – Weather Risks in Central Europe. 2008. Online at: http://www.mroc.com/publications.html.
- Murray R. J. , Simmonds I . A numerical scheme for tracking cyclone centres from digital data. Part I: development and operation of the scheme. Aust. Meteorol. Mag. 1991a; 39: 155–166.
- Murray R. J. , Simmonds I . A numerical scheme for tracking cyclone centres from digital data. Part II: application to January and July general circulation model simulations. Aust. Meteorol. Mag. 1991b; 39: 167–180.
- Neu U. , Akperov M. G. , Bellenbaum N. , Benestad R. S. , Blender R. , co-authors . IMILAST a community effort to intercompare extratropical cyclone detection and tracking algorithms. Bull. Am. Meteorol. Soc. 2013; 94(4): 529–547.
- Nissen K. M., Leckebusch G. C., Pinto J. G., Ulbrich U. Mediterranean cyclones and windstorms in a changing climate. Reg. Environ. Change. 2013a; 1–18. Online at: http://link.springer.com/article/10.1007/s10113-012-0400-8.
- Nissen K., Ulbrich U., Leckebusch G., Kuhnel I. Decadal windstorm activity in the North Atlantic-European sector and its relationship to the meridional overturning circulation in an ensemble of simulations with a coupled climate model. Clim Dynam. 2013b; 1–11. Online at: http://dx.doi.org/10.1007/s00382-013-1975-6.
- Nissen K. M. , Leckebusch G. C. , Pinto J. G. , Renggli D. , Ulbrich S. , co-authors . Cyclones causing wind storms in the Mediterranean: characteristics, trends and links to large-scale patterns. Nat. Hazard Earth Syst. 2010; 10(7): 1379–1391.
- Paredes D. , Trigo R. M. , Garcia-Herrera R. , Trigo I. F . Understanding precipitation changes in Iberia in early spring: weather typing and storm-tracking approaches. J. Hydrometeorol. 2006; 7(1): 101–113.
- Pfahl S. , Wernli H . Quantifying the relevance of cyclones for precipitation extremes. J. Clim. 2012; 25(19): 6770–6780.
- Pinto J. G. , Spangehl T. , Ulbrich U. , Speth P . Sensitivities of a cyclone detection and tracking algorithm: individual tracks and climatology. Meteorol. Z. 2005; 14(6): 823–838.
- Pinto J. G. , Zacharias S. , Fink A. H. , Leckebusch G. C. , Ulbrich U . Factors contributing to the development of extreme North Atlantic cyclones and their relationship with the NAO. Clim. Dynam. 2009; 32(5): 711–737.
- Pinto J. G. , Ulbrich U. , Leckebusch G. C. , Spangehl T. , Reyers M. , co-authors . Changes in storm track and cyclone activity in three SRES ensemble experiments with the ECHAM5/MPI-OM1 GCM. Clim. Dynam. 2007; 29(2–3): 195–210.
- Pohlmann H. , Müller W. A. , Kulkarni K. , Kameswarrao M. , Matei D. , co-authors . Improved forecast skill in the tropics in the new MiKlip decadal climate predictions. Geophys. Res. Lett. 2013; 40: 5798–5802.
- Raible C. C . On the relation between extremes of midlatitude cyclones and the atmospheric circulation using ERA40. Geophys. Res. Lett. 2007; 34(7): L07703.
- Rayner N. A. , Parker D. E. , Horton E. B. , Folland C. K. , Alexander L. V. , co-authors . Global analyses of sea surface temperature, sea ice, and night marine air temperature since the late nineteenth century. J. Geophys. Res. Atmos. 2003; 108(D14): 4407.
- Renggli D . Seasonal predictability of wintertime windstorm climate over the North Atlantic and Europe. PhD Thesis, Department of Earth Sciences, Freie Universität Berlin . 2011b
- Renggli D. , Leckebusch G. C. , Ulbrich U. , Gleixner S. N. , Faust E . The skill of seasonal ensemble prediction systems to forecast wintertime windstorm frequency over the North Atlantic and Europe. Mon. Weather Rev. 2011a; 139(9): 3052–3068.
- Richardson D. S . Measures of skill and value of ensemble prediction systems, their interrelationship and the effect of ensemble size. Q. J. Roy. Meteorol. Soc. 2001; 127(577): 2473–2489.
- Solomon A. , Goddard L. , Kumar A. , Carton J. , Deser C. , co-authors . Distinguishing the roles of natural and anthropogenically forced decadal climate variability. Bull. Am. Meteorol. Soc. 2011; 92(2): 141–156.
- Stevens B. , Giorgetta M. , Esch M. , Mauritsen T. , Crueger T. , co-authors . Atmospheric component of the MPI-M Earth System Model: ECHAM6. J. Adv. Model. Earth Syst. 2013; 5(2): 146–172.
- Taylor K. E. , Stouffer R. J. , Meehl G. A . An overview of CMIP5 and the experiment design. Bull. Am. Meteorol. Soc. 2012; 93(4): 485–498.
- Ulbrich U. , Pinto J. G. , Kupfer H. , Leckebusch G. C. , Spangehl T. , co-authors . Changing northern hemisphere storm tracks in an ensemble of IPCC climate change simulations. J. Clim. 2008; 21(8): 1669–1679.
- Ulbrich U. , Leckebusch G. C. , Grieger J. , Schuster M. , Akperov M. , co-authors . Are Greenhouse Gas Signals of Northern Hemisphere winter extra-tropical cyclone activity dependent on the identification and tracking algorithm?. Meteorol. Z. 2013; 22(1): 61–68.
- Uppala S. , Kållberg P. , Simmons A. , Andrae U. , da Costa Bechtold V. , co-authors . The ERA-40 re-analysis. Q. J. Roy. Meteorol. Soc. 2005; 131: 2961–3012.
- van Oldenborgh G. J. , Doblas-Reyes F. J. , Wouters B. , Hazeleger W . Decadal prediction skill in a multi-model ensemble. Clim. Dynam. 2012; 38(7–8): 1263–1280.
- Vecchi G. A. , Msadek R. , Anderson W. , Chang Y. S. , Delworth T. , co-authors . Multiyear predictions of North Atlantic hurricane frequency: promise and limitations. J. Clim. 2013; 26(15): 5337–5357.
- Wang X. L. , Feng Y. , Compo G. , Swail V. , Zwiers F. , co-authors . Trends and low frequency variability of extra-tropical cyclone activity in the ensemble of twentieth century reanalysis. Clim. Dynam. 2013; 40(11–12): 2775–2800.
- Wilks D. S . Statistical Methods in the Atmospheric Sciences. 2006; 2nd ed, Amsterdam: Elsevier.