
Abstract
An extreme explosive extratropical cyclone over the northwestern Pacific Ocean (NPO) that formed in winter 2004 and went through two distinct rapid deepening periods was successfully simulated by a non-hydrostatic mesoscale model (MM5). Based on the simulation, the cyclone's rapid deepening was investigated in detail using the piecewise potential vorticity (PV) inversion method which successfully captured the characteristics of the cyclone and its associated background circulations. Results indicated that explosive development of the cyclone was dominated by forcings in the extended surface layer (ESL), which were closely related to baroclinity (temperature advection) and boundary layer processes (sensible heat exchange). In the interior layer (IL), direct effects of condensation were mainly conducive to the cyclone's development, whereas indirect effects (interactions with other layers) mainly acted conversely. Processes associated with latent heat release (LHR) were characterised by nonlinearity. Features of the precipitation, including intensity, duration, range and relative configuration to the cyclone determined the influences of condensation on the cyclone. In the upper layer (UL), tropopause-folding processes and horizontal PV advection were main influencing factors to the evolution of the cyclone. Upper-level forcings firstly exerted slight effects on the cyclone's development, since upper-level positive PV anomalies were far from the cyclone; then, as the influencing short-wave trough and the cyclone both moved northeastward, upper-level positive PV anomalies merged, enhanced and entered key areas of the cyclone, and thus both direct and indirect effects associated with the upper-level forcings strengthened significantly around the cyclone, and this dominated the cyclone's transition from a moderate explosive cyclone to an extreme one.
1. Introduction
Extratropical cyclones have formed the focus of many studies over the past 50 yr (Petterssen et al., Citation1955; Petterssen and Smebye, Citation1971; Roebber, Citation1989; Plant et al. 2003; Gray and Dacre, Citation2006; Isobe and Kako, Citation2012; Tilinina et al., Citation2013) given that they are so closely related to severe weather events. There is a very important type of extratropical cyclone called an explosive cyclone, which is characterised by explosive deepening, and a criterion for these rapid deepening lows is the central sea level pressure (SLP) falling at a rate of at least 1 Begeron (Sanders and Gyakum, Citation1980). Temporally, explosive cyclones can occur throughout the year, but winter is the dominant formative period; and spatially, explosive cyclones are mainly distributed among three regions in the Southern Hemisphere and two regions in the Northern Hemisphere (Allen et al., Citation2010). The North Atlantic Ocean and the northwestern Pacific Ocean (NPO) are the two active regions of explosive cyclones in the Northern Hemisphere (Chen et al., Citation1992; Sinclair, Citation1997; Allen et al., Citation2010; Black and Pezza, Citation2013), but explosive cyclones over these two regions are different, including their meridional moving ranges (Lim and Simmonds, Citation2002; Rudeva and Gulev, Citation2011), annual frequencies (Roebber, Citation1989) and intensities (Roebber, Citation1989; Lim and Simmonds, Citation2002).
Explosive cyclones over the NPO were classified into three types by Yoshida and Asuma (Citation2004): the Okhotsk–Japan Sea (OJ) type and Pacific Ocean–land (PO–L) type, both of which originate over the East Asian continent but develop over the Sea of Japan/Okhotsk and NPO respectively; and the Pacific Ocean–ocean (PO–O) type, which forms and develops over the NPO. In order to describe the main features of the above three cyclone types, Yoshida and Asuma (Citation2004) performed composite analyses and found that cold air over the Asian continent was vital for all types of cyclone. The Z–O (Zwack–Okossi) equation (Zwack and Okossi, Citation1986) was employed to evaluate various influences and the results revealed that contributions of temperature advection were dominant for all types of cyclone. Additionally, for PO–O cyclones, latent heat release (LHR) was also a very important factor (Chen and Dell'Osso, 1987). In order to investigate the role of LHR, Kuwano-Yoshida and Asuma (Citation2008) removed LHR from simulations of OJ, PO–L and PO–O cyclones and, based on sensitivity experiments, proposed that LHR affects cyclone development mainly through nonlinear interactions with the upper-level trough and jet.
Although the Z–O equation and sensitivity experiments have been employed to understand the rapid deepening of explosive cyclones over the NPO, quantitative contributions and relative importance of various factors in different layers, especially the role of LHR, remain unclear. The primary reasons for this are as follows. (1) The Z–O equation, based on quasi-geostrophy approximation, which is widely used to diagnose cyclones (Luo et al., Citation1992; Rausch and Smith, Citation1996; Parsons and Smith, Citation2004; Yoshida and Asuma, Citation2004), sometimes cannot retain quantitative accuracy because ageostrophic motions can rival the total wind in strength during explosive developing stages (Davis et al., Citation1996). In addition, the vertical-layer-integral results of the Z–O equation cannot reflect detailed information regarding different layers, and the calculation of LHR often features errors that cannot be ignored (Strahl and Smith, Citation2001). (2) A comparison of a control run and a corresponding dry run (without LHR) are often used to reveal the importance of LHR (Liou and Elsberry, Citation1987; Kuwano-Yoshida and Asuma, Citation2008). However, since the condensation is often coupled with other processes (nonlinearity), such a comparison can reveal whether the LHR is a necessary condition, but ascribing all differences between the control and dry runs solely to the LHR can be misleading (Davis et al., Citation1993; Wu et al., Citation2011).
The piecewise potential vorticity (PV) inversion (PPVI) method (Davis and Emanuel, Citation1991; Davis, Citation1992), which is able to provide quantitative results of various factors, can overcome the shortcomings mentioned above. Firstly, Davis et al. (Citation1996) proved by calculations that even during the most intense cyclogenesis period, the Charney balance (Charney, Citation1955) still retains quantitative accuracy. Secondly, it is unnecessary to calculate diabatic heating directly. And finally, the PPVI method can reveal contributions of various factors by inverting the corresponding PV anomalies. Indeed, the PPVI method has been proven to be very effective for clarifying the roles and relative importance of various factors relating to extratropical cyclones (Davis et al., Citation1996; Hakim et al., Citation1996; Huo et al., Citation1999; Plant et al., Citation2003; Wu et al., Citation2011). However, it should be noted that, although the PV anomaly and its associated far-fields (flow and temperature fields) are inherently linked to each other (Egger, Citation2009), there is no causal relationship between them (Spengler and Egger, Citation2012). Actually, the lack of a causal relationship does not harm the usefulness of the PPVI method: the PV anomaly and its associated far-field are different manifestations of the same phenomenon, and the invertibility of PV indicates that the PV anomaly and its associated far-field are equivalent approximately. Therefore, the process causing the PV anomaly (but not the PV anomaly itself) is the reason for a phenomenon, which can be shown both in the PV field as well as the flow and temperature fields (Hoskins et al., Citation1985).
The present work is an extended study of the PO–O cyclones, which is the strongest of the explosive cyclone types that occur over the NPO and shows the most drastic response to LHR (Yoshida and Asuma, Citation2004; Yoshiike and Kawamura, Citation2009; Iwao et al., Citation2012). The main aims are to understand the explosive development of PO–O cyclones from the PV point of view, to calculate the contributions of various factors in different layers quantitatively, to compare the relative importance of various factors during different explosive developing stages and to reveal possible interactions among different layers, especially the role of LHR.
A typical but interesting PO–O cyclone was selected in this study ( and ). The cyclone was typical because: (1) it persisted in the typical maintaining period of the PO–O cyclones (Yoshida and Asuma, Citation2004); (2) it moved along the major route of explosive cyclogenesis over the NPO (Iwao et al., Citation2012); and (3) its maximum deepening rate and minimum SLP appeared in corresponding high-density areas (Yoshida and Asuma, Citation2004; Iwao et al., Citation2012). The cyclone was interesting because: (1) it formed around the southern boundary of the explosive-cyclone active area over the NPO and moved almost from the southern to the northern boundary of the active area (Yoshida and Asuma, Citation2004; Allen et al., Citation2010); (2) it experienced two distinct explosive developing stages, with maximum deepening rates of 1.2 and 2.6 Bergerons, respectivelyFootnote ; and 3) the minimum central SLP was 956 hPa, implying that the cyclone was an extreme case (Kuwano-Yoshida and Asuma, Citation2008). It should be noted that a two-stage transition from a moderately developing explosive-cyclone to an extremely developing one is rare (Yoshida and Asuma, Citation2004), but can also been seen in other extreme cases (Kuwano-Yoshida and Asuma, Citation2008). Therefore, clarifying the main mechanisms involved in the transition is also an important objective of this study.
Fig. 1 (a) Track and central SLP (hPa) of the explosive cyclone, where the black dotted line represents the track and centres of the simulated cyclone, and the blue and red dashed lines stand for the track and centres of the observed cyclone. (b) The representative phase of the cyclone (observation), where the solid line is SLP (units: hPa) for 0600 UTC 28 December 2004; (c) and (d) are the same as (b), but for 1200 UTC 30 December 2004 and 1200 UTC 01 January 2005, respectively.
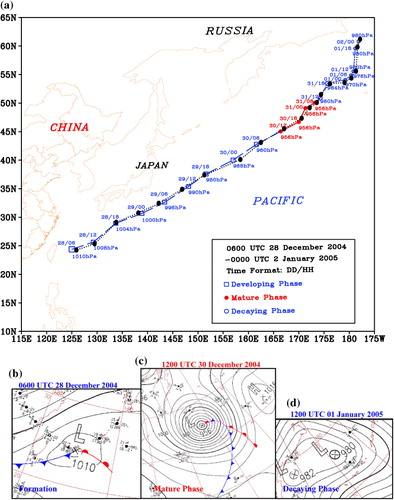
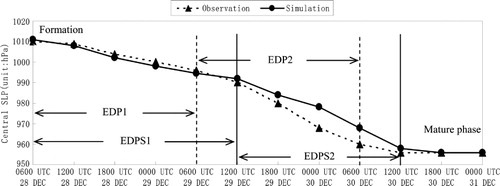
Fig. 2 The central SLP (units: hPa) of both observed and simulated explosive cyclones, where the triangles/broken line stand for observations and the circles/solid line represent simulations. EDP1 and EDP2 are the initial and latter explosive developing stages of the observed cyclone respectively.
2. Numerical simulation configuration, data and methodology
2.1. Numerical simulation configuration
The fifth-generation Pennsylvania State University–National Center for Atmospheric Research (PSU–NCAR) Mesoscale Model (MM5, version 3.7) (Grell et al., Citation1995) was used in this study and was chosen because of its proven ability to effectively simulate explosive cyclones (Martin and Otkin, Citation2004; Parson and Smith, Citation2004; Kuwano-Yoshida and Asuma, Citation2008; Roebber and Schumann, Citation2011). The model was run with two domains starting at 0600 UTC 27 December 2004 (24 hours before the cyclone formed) and integrated for 150 hours to include the entire lifetime of the cyclone. The horizontal grid spacing of the outer and inner domain is 45 and 15 km, with 181×181 and 241×211 grid points, respectively. There are 23 vertical levels and the model instantaneous outputs were saved every 3 hours. The explicit simple ice moisture scheme (Dudhia, Citation1989) was employed in the outer domain, and a mixed-phase explicit moisture scheme (Reisner et al., Citation1998) was used in the inner domain. The Grell cumulus parameterisations (Grell, Citation1993) were used for each domain.
2.2. Data
The 0.25°×0.25° TRMM (Tropical Rainfall Measuring Mission) and other satellite rainfall products (3B42) from the National Aeronautics and Space Administration (Huffman, Citation1997) were utilised to describe the rainfall events associated with the cyclone. Initial and lateral boundary conditions of the simulation were derived from National Centers for Environmental Prediction (NCEP) 1°×1° final analysis data. Weekly mean 1°×1° optimum interpolation sea surface temperature (SST) data from the National Oceanic and Atmospheric Administration–Cooperative Institute for Research in Environmental Sciences Climate Diagnostics Center (NOAA–CIRES CDC) were used for the SST conditions. Surface, rawinsonde, ship and buoy observations from the Japan Meteorological Agency (JMA) were also used to improve initial conditions of the simulation, as well as to verify the simulated results.
2.3. Cyclone deepening rate
Following Sanders and Gyakum (Citation1980), the cyclone deepening rate was calculated by ·
, where t is time (units: hours), p is the cyclone's central SLP (units: hPa) and φ is the central latitude. It should be noted that the maximum deepening rates were calculated following Yoshida and Asuma (Citation2004), in which a 12-hours pressure change is used to replace the above 24-hours one.
2.4. PPVI method
The Ertel potential vorticity (EPV; Ertel, Citation1942) is:1
where ρ is the density, η the absolute vorticity and θ the potential temperature. Davis and Emanuel (Citation1991) developed the PPVI method to obtain perturbations associated with given perturbation PV. The balance condition derived by Charney (Citation1955) is used in the PPVI method, and it is accurate in flows with large curvature since it is quite similar to the gradient wind balance.
Davis and Emanuel (Citation1991) performed linearisation of the PPVI equations (refer to the Appendix) by hiding nonlinear terms in non-constant coefficients of the linear differential operator. Effective use of the PPVI method requires a meaningful partitioning of perturbation PV. Martin and Marsili (Citation2002) proposed two requirements of partitioning as: (1) taking into account almost all of the perturbation PV and only inverting it once; (2) using a small number of partitions to describe the subject adequately and partitioning perturbation PV according to different cases. Thus, we firstly analysed the structures of the cyclone and the distributions of PV anomalies (including θ at near-surface levels). Then, we objectively attributed PV anomalies to corresponding dynamical and/or thermodynamical significances using the PV and θ budget equations and, finally, the PPVI method was carried out.
3. Overview of the explosive cyclone and verification of simulations
3.1. Classification of cyclone stages
At 0600 UTC 28 December 2004, the explosive cyclone initially formed to the east of Taiwan with a central SLP of 1010 hPa (b). During the subsequent 24 hours, the northeastward-moving cyclone (a) developed at a central SLP deepening rate of 1.0 Bergeron (maximum deepening rate of 1.2 Bergerons appeared at 1800 UTC 28 December). This period (0600 UTC 28–0600 UTC 29 December) is defined as the initial explosive deepening period.
At 0600 UTC 29 December, the central SLP of the cyclone moved to (32.5°N, 143°E), with a central SLP of 996 hPa (a). In the following 24 hours, the cyclone deepened at a more intensive deepening rate of 2.0 Bergerons (). Its central SLP decreased by 36 hPa to 960 hPa (maximum deepening rate of 2.6 Bergerons appeared at 1800 UTC 29 December). This period (0600 UTC 29–0600 UTC 30 December) is defined as the latter explosive deepening period.
At 1200 UTC 30 December 2004, the cyclone reached its minimum pressure of 956 hPa (c), and the minimum SLP maintained for 18 hours. Thus, this period (1200 UTC 30–0600 UTC 31 December) is defined as the mature stage.
The cyclone began to fill after 1200 UTC 31 December, and it dissipated at 0000 UTC 02 January. This period (1200 UTC 31 December 2004–0000 UTC 02 January 2005) was defined as the decaying stage.
3.2. Verification of the simulations with observations
The main pattern and features of the simulated background environment resembled observations well (not shown), and the simulated cyclone also formed at 0600 UTC 28 December (a). Moreover, the locations and moving track of the simulated cyclone were very close to observations. The deepening rate of the simulated cyclone was slightly stronger than the observed rate during the initial explosive developing stage (), whereas the observed cyclone deepened more quickly than the simulated one during the latter explosive developing stage. Since the simulated and observed deepening rates were quite different, the rapid deepening periods of the simulated cyclone were adjusted as follows: the periods 0600 UTC 28–1200 UTC 29 December and 1200 UTC 29–1200 UTC 30 December were defined as EDPS (explosive deepening period for simulation) 1 and EDPS2 respectively, which were 6 hours later than the observed. After the adjustments, EDPS1 and EDPS2 had deepening rates of 1.1 and 1.9 Bergerons, respectively, which were much closer to the observations (1.0 and 2.0 Bergerons, respectively).
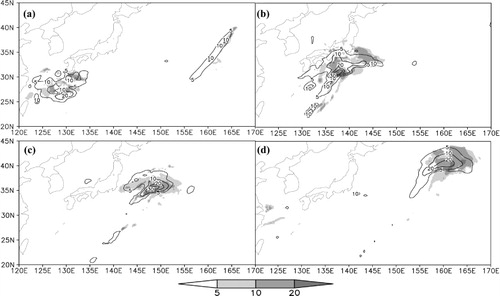
The simulated 3-hours rainfall was verified using the products of TRMM and other satellites (). The simulated rainfall areas and intensities were consistent with observations; the simulated precipitation centres were very close to those observed, and both moved northeastward with the cyclone.
Fig. 3 Three-hour precipitation of the explosive cyclone (units: mm), where shaded areas represent the 3 hours precipitation from ‘3B42’ and the solid line is simulated 3 hours rainfall (units: mm): (a) 1200 UTC 28 December 2004; (b) 0000 UTC 29 December 2004; (c) 1200 UTC 29 December 2004; and (d) 0000 UTC 30 December 2004.
In summary, features of the simulated cyclone were highly consistent with observations. Given the ability of the simulation to capture the main features of the cyclone, further analysis was based upon the model simulations.
4. Structures and evolution of the simulated explosive cyclone
To investigate the features of the explosive cyclone, representative times for each stage were selected as follows: before formation (0000 UTC 28 December); EDPS1 (0600 UTC and 1800 UTC 28 December); EDPS2 (1200 UTC 29 and 0000 UTC 30 December); and mature phase (1800 UTC 30 December).
4.1. Before formation
Before formation, there was a baroclinic short-wave trough over eastern China (a) with a strong upper-level jet (ULJ) ahead of it (a and a) and frontogenesis around Taiwan. The westward-tilting of negative geopotential height deviation indicates intense baroclinity of the system and conditions favourable to further development of the cyclone (a). The core of the ULJ was mainly located around 34°N (a), and the 1.5 PVU (1 PVU=10−6 m2 K kg−1 s−1) contour, which is defined as the typical value of the tropopause (Davis and Emanuel, Citation1991), stretched downward to 450 hPa (around 42°N), implying that intense tropopause-folding processes occurred to the north of the ULJ. In the lower troposphere, an anticyclone was located around (23°N, 136°E), and favoured by southerlies to the west of the anticyclone, warm temperature advection was intense to the east of Taiwan (not shown), which favoured the formation of positive θ anomalies below 700 hPa (a) and the falling of surface pressure. Abundant moisture was coupled with low pressure (a) and updrafts (a), which provided favourable conditions for precipitation.
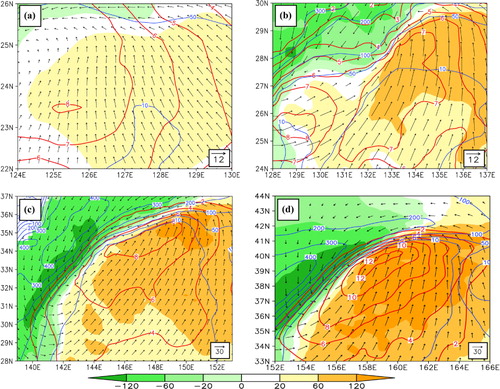
Fig. 4 Geopotential height at 500 hPa (solid, units: gpm), ULJ at 200 hPa (dashed lines, with contour intervals of 20 m s−1) and LLJ at 850 hPa (shaded, units: m s−1), where purple triangles stand for locations of the cyclone centre: (a) 0000 UTC 28 December 2004; (b) 0600 UTC 28 December 2004; (c) 1800 UTC 28 December 2004; (d) 1200 UTC 29 December 2004; (e) 0000 UTC 30 December 2004; and (f) 1800 UTC 30 December 2004.
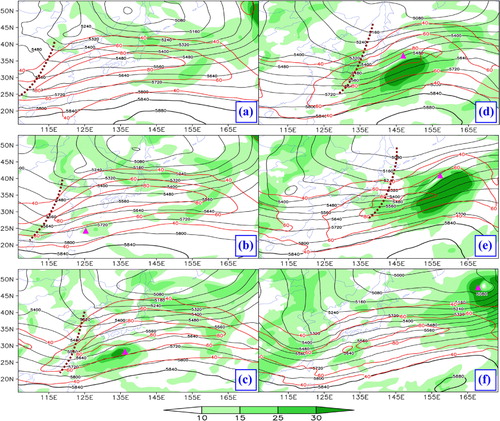
Fig. 5 Cross-sections of PV (shaded, units: PVU; the purple bold line is the 1.5-PVU contour), horizontal velocity (black solid lines, units: m s−1) and vertical velocity (blue dashed and solid lines, units: cm s−1) along central longitudes of the explosive cyclone. Green dashed lines stand for KAs of the cyclone. (a) 0000 UTC 28 December 2004; (b) 0600 UTC 28 December 2004; (c) 1800 UTC 28 December 2004; (d) 1200 UTC 29 December 2004; (e) 0000 UTC 30 December 2004; and (f) 1800 UTC 30 December 2004.
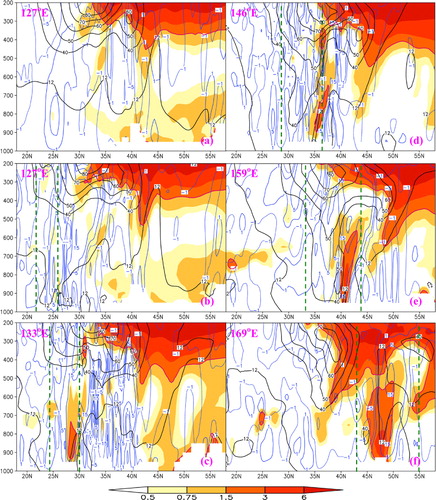
Fig. 6 Cross-sections of RH (shaded, units: %), θ anomalies (red solid lines, units: K) and geopotential height deviation (black solid and dashed lines, units: m) along central latitudes of the explosive cyclone. Blue dashed lines stand for KAs of the cyclone. (a) 0000 UTC 28 December 2004; (b) 0600 UTC 28 December 2004; (c) 1800 UTC 28 December 2004; (d) 1200 UTC 29 December 2004; (e) 0000 UTC 30 December 2004; and (f) 1800 UTC 30 December 2004.
4.2. EDPS1
During EDPS1, the cyclone was located on the right side of the ULJ-entrance region (b, c) where there were intense ascending motions (b, c). A lower-level jet (LLJ) associated with the cyclone formed and strengthened quickly (b, c), and thus temperature advection also enhanced (not shown). At near-surface levels, positive θ advection coupled with weak sensible heat flux covered more than 70% of the cyclone (a, b), whereas cold advection mainly occurred in the northwest quadrant of the cyclone where it was coupled with intense sensible heat flux, and this was similar to so-called ‘lake effects’ (Kelly, Citation1984). The simplified θ equation (Markowski and Richardson, Citation2010) is as follows:2
Fig. 7 Perturbation θ (red solid lines, units: K), horizontal wind field (vector, units: m s−1), θ advection (shaded, units: 10−5 K s−1) at 950 hPa and sensible heat flux (blue solid lines, units: W m−2), within KAs of the cyclone: (a) 0600 UTC 28 December 2004; (b) 1800 UTC 28 December 2004; (c) 1200 UTC 29 December 2004; and (d) 0000 UTC 30 December 2004.
Where V is the horizontal wind, =
+
, w is the vertical velocity, Q is the specific heating/cooling rate, c
p
is the specific heat for a constant-pressure process, T is temperature, κ∇2
θ is molecular diffusion and
is the divergence of turbulent kinematic heat flux. In order to roughly estimate the θ anomalies caused by sensible heat, the tendency caused by the last term of eq. (2) is integrated from surface to a level L
0
where turbulent kinematic heat flux is close to zero:
=
. A mean tendency of θ (
) due to sensible heat can then be derived from
/
, where ρ¯ is mean air density and
is sensible heat flux. Firstly, L
0≈5500 m, since in this case turbulent kinetic energy at 500 hPa is generally less than 10% of the maximum value in the planetary boundary layer. Therefore,
~5*103 kg m−2, i.e.
~ sensible heat*2*10−7 K m2 J−1, which can be regarded as a minimum tendency. Secondly, L
0≈1000 m, which is a common height of the planetary boundary layer in winter, then
~ sensible heat*10−6 K m2 J−1, which can be taken as the maximum tendency. From a, b, around the cyclone, the θ tendency caused by horizontal θ advection was much more important than that caused by sensible heat. Therefore, at near-surface levels, the positive θ anomaly which was equivalent to the PV anomaly (Bretherton, Citation1966) was mainly located in intense positive θ advection areas.
The PV budget equation from Koshyk and McFarlane (Citation1996) was used to evaluate variations of PV:3
Here, P is PV and F is frictional force. From b, c, below 500 hPa, there were many positive PV centres around the cyclone, which juxtaposed zones of ascending motions and abundant moisture (from c, the contour of 70% reached 450 hPa). As b, c and a–d illustrate, these positive PV anomalies were not stratospheric origin; instead, they were mainly generated by condensation (a, b), according to eq. (3). Additionally, positive horizontal PV advection associated with the short-wave trough was also favourable (not shown).
In upper troposphere, two positive PV anomaly areas appeared to the north and west of the cyclone (a, c), corresponding to two different tropopause-folding processes. The northern positive PV anomalies were closely related to the ULJ (b, c): to the north of the ULJ core, undulations in the tropopause amplified intensely, with the 1.5-PVU contour stretching downward to 550 hPa. The western positive PV anomalies were closely related to the short-wave trough (b, c). As the trough intensified (b, c), downward PV transport behind the trough (b, d) favoured the tropopause-folding process to the west of the cyclone (1.5-PVU contour reached 450 hPa), and according to eq. (3), horizontal PV advection downstream (a, c) dominated the occurrence of positive PV anomalies ahead of the trough.
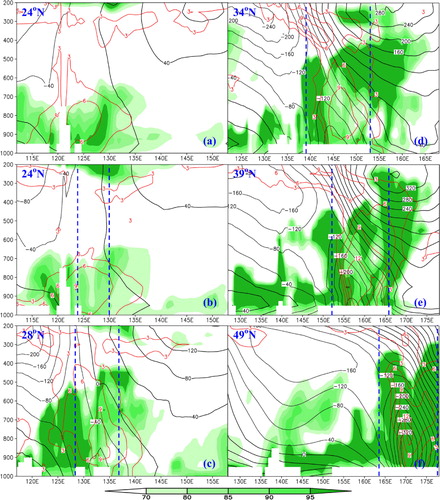
Fig. 8 Left column: horizontal PV advection (shaded, units: 10−5 PVU s−1), PV (blue solid lines, units: PVU), PV anomalies (red solid lines, units: PVU) and horizontal wind at 250 hPa (vector, units: m s−1). Right column: vertical PV advection (shaded, units: 10−5 PVU s−1), PV (blue solid lines, units: PVU), PV anomalies (red solid lines, units: PVU) and vertical velocity at 250 hPa (black solid and dashed lines, units: cm s−1). Panels (a) and (b) are for 0600 UTC 28 December 2004; (c) and (d) for 1800 UTC 28 December 2004; (e) and (f) for 1200 UTC 29 December 2004; and (g) and (h) for 0000 UTC 30 December 2004.
4.3. EDPS2
During EDPS2, the cyclone intensified remarkably (d, e), and it was mainly located on the left side of the ULJ-exit-region (d, e) where ascending motions existed (d, e). The LLJ associated with the cyclone enhanced significantly (d, e), and thus the corresponding θ advection also intensified (c, d). At near-surface levels, cold advection mainly appeared on the left side of the cyclone major-axis and dominated the reduction of θ. Warm advection was mainly located on the right side of the cyclone major-axis, and positive θ anomalies maintained strong within this region (c, d), confirming that warm advection dominated the maintenance of positive θ anomalies at near-surface levels.
In the middle and lower troposphere, intense positive PV centres formed due to persistent precipitation (c, d) caused by the coupling of abundant moisture (from d, e, the 70% contour reached 300 hPa or above) and intense updrafts (d, e). In the upper troposphere, the northern positive PV anomalies remained quasi-stationary along with the ULJ core (d, e), whereas the western positive PV anomalies moved northeastward due to intense positive PV advection ahead of the short-wave trough (e, g). Therefore, the northern and western positive PV anomalies merged during EDPS2, forming an intense positive PV anomaly area overlapping the cyclone mainly in the cyclone's northwest quadrant (e, g). The downward transport of PV to the west and north of the cyclone was favourable for tropopause-folding processes (f, h). As the cyclone moved northeastward, it entered tropopause-folding areas (f, h), with the 1.5-PVU contour (around 47°N) stretching intensely downward to 650 hPa (e).
4.4. The mature stage
When the cyclone entered the mature stage, it moved out of the ULJ region (f), whereas updrafts and the LLJ associated with the cyclone continued to be maintained (f and f). Precipitation maintained intense, as were condensation-induced PV anomalies in the middle and lower troposphere (f). The region of negative geopotential height deviation stretched upward to 300 hPa (f), implying that the system had entered its mature stage.
5. Results
5.1. Overview and the partitioning method
Properly attributing PV anomalies to corresponding physical significances is vital to the PPVI method. In Section 4, θ anomalies at near-surface levels and PV anomalies from the lower troposphere to lower stratosphere were analysed in detail, and the dominant factors influencing these anomalies were identified qualitatively by the θ and PV budget equations, respectively.
A conventional three-way partitioning method (Davis and Emanuel, Citation1991; Martin and Marsili, Citation2002; Wu et al., Citation2011) was adopted in this study: (i) the UL; (ii) the interior layer (IL); and (iii) the extended surface layer (ESL). The UL (550–150 hPa in EDPS1 and 650–150 hPa in EDPS2, according to the distributions of PV) was designed to isolate PV anomalies associated with the upper-tropospheric/lower-stratospheric air, and positive perturbation was set to 0 PVU whenever relative humidity (RH) was no less than 70%. The IL (950–450 hPa in EDPS1 and 950–300 hPa in EDPS2, according to the distributions of RH) was designed to consider condensation-induced PV anomalies only, and perturbation PV was set to 0 PVU whenever RH was less than 70% (Huo et al., Citation1999). The ESL, which includes perturbations of lower-troposphere PV (950–850 hPa) and lower-boundary θ, is closely related to baroclinity and boundary layer processes. To ensure against redundancy with other layers, in the ESL, perturbation PV was set to 0 PVU whenever RH was no less than 70%. There were actually two other parts: the saturated air processes in the UL and the dry processes in the IL (Wu et al., Citation2011). However, the effects of these two parts can be ignored in this case.
In order to focus on the cyclone, key areas (KAs; rectangles in ) are selected as follows: (1) to include the main body of the SLP centre and the 900-hPa positive vorticity centre; (2) to include the cyclone circulation at 900 hPa (take the symmetry of the cyclone into consideration); (3) to exclude other systems surrounding the cyclone; and finally, the most important requirement is that the KA-based calculations should be insensitive to relative small changes to KAs.Footnote
Based on the simulation, a total inversion (Davis and Emanuel, Citation1991) was performed. The horizontal wind and geopotential fields of the total inversion were able to reproduce the main patterns and features of the original circulation well (not shown), and this laid the foundation for the PPVI analysis.
PPVI results associated with parts (i)–(iii) (not shown) were able to reproduce positive geopotential height perturbations relating to the ridge to the east of the cyclone (), as well as the negative height perturbations and positive vorticity of horizontal perturbation wind associated with the short-wave trough and explosive cyclone. The inverted horizontal perturbation wind and negative height perturbations relating to the cyclone were highly consistent with the horizontal wind anomalies (not shown) and instantaneous height deviation (). Therefore, signals of PV anomalies could capture main features of the cyclone's explosive development, and thus the relative importance of various factors can be calculated by the PPVI results.
In this case, the height and vorticity anomalies relating to the cyclone both reached maximums around 900 hPa (). Moreover, 900 hPa was mainly above the underlying topography in our simulation domain, and thus 900 hPa was selected as the typical level for detailed analyses.
5.2. PPVI results during EDPS1 and EDPS2
5.2.1. Direct forcings from different layers during EDPS1.
In the initial stage of EDPS1, positive θ anomalies at near-surface levels were very intense (b and a), implying that influences associated with the ESL were very strong. The region of intense negative geopotential height perturbations and positive vorticity of horizontal perturbation wind was mainly located around Taiwan (a), with the explosive cyclone locating in the east of this region. This configuration was very favourable for the cyclone's rapid deepening. Since precipitation was weak and mainly located in the north and to the northwest of the cyclone centre (not shown), condensation in the IL only induced positive perturbation vorticity around western and northern boundaries of the cyclone (a), which favoured the cyclone's development. However, positive height perturbations dominated KAs of the cyclone, which slowed down the cyclone's development. Since the upper-level PV anomalies relating to tropopause-folding processes were intense (a), forcings from the UL were very strong in the middle and upper troposphere (not shown). However, because intense upper-level positive PV anomalies were far from the cyclone (a, c), in the lower troposphere, only weak negative height perturbations appeared in the west of the cyclone (a), implying that upper-level forcings only favoured the cyclone's development slightly in this stage.
Fig. 9 Geopotential height perturbations (solid and dotted lines, units: m), horizontal wind perturbations (vector, units: m s−1) and vorticity of horizontal perturbation wind (shaded, units: 10−5 s−1) at 900 hPa associated with the ESL [part (iii)], where thick broken rectangles represent KAs of the cyclone: (a) 0600 UTC 28 December 2004; (b) 1800 UTC 28 December 2004; (c) 1200 UTC 29 December 2004; and (d) 0000 UTC 30 December 2004.
![Fig. 9 Geopotential height perturbations (solid and dotted lines, units: m), horizontal wind perturbations (vector, units: m s−1) and vorticity of horizontal perturbation wind (shaded, units: 10−5 s−1) at 900 hPa associated with the ESL [part (iii)], where thick broken rectangles represent KAs of the cyclone: (a) 0600 UTC 28 December 2004; (b) 1800 UTC 28 December 2004; (c) 1200 UTC 29 December 2004; and (d) 0000 UTC 30 December 2004.](/cms/asset/f741e927-fe8f-4ba2-af5b-01200075e2c5/zela_a_11817014_f0009_ob.jpg)
Fig. 10 Geopotential height perturbations (solid and dotted lines, units: m), horizontal wind perturbations (vector, units: m s−1) and vorticity of horizontal perturbation wind (shaded, units: 10−5 s−1) at 900 hPa associated with the IL [part (ii)], where thick broken rectangles represent KAs of the cyclone: (a) 0600 UTC 28 December 2004; (b) 1800 UTC 28 December 2004; (c) 1200 UTC 29 December 2004; and (d) 0000 UTC 30 December 2004.
![Fig. 10 Geopotential height perturbations (solid and dotted lines, units: m), horizontal wind perturbations (vector, units: m s−1) and vorticity of horizontal perturbation wind (shaded, units: 10−5 s−1) at 900 hPa associated with the IL [part (ii)], where thick broken rectangles represent KAs of the cyclone: (a) 0600 UTC 28 December 2004; (b) 1800 UTC 28 December 2004; (c) 1200 UTC 29 December 2004; and (d) 0000 UTC 30 December 2004.](/cms/asset/a32411ac-e369-4dd4-8a75-5be91cc90069/zela_a_11817014_f0010_ob.jpg)
Fig. 11 Geopotential height perturbations (solid and dotted lines, units: m), horizontal wind perturbations (vector, units: m s−1) and vorticity of horizontal perturbation wind (shaded, units: 10−5 s−1) at 900 hPa associated with the UL [part (i)], where thick broken rectangles represent KAs of the cyclone: (a) 0600 UTC 28 December 2004; (b) 1800 UTC 28 December 2004; (c) 1200 UTC 29 December 2004; and (d) 0000 UTC 30 December 2004.
![Fig. 11 Geopotential height perturbations (solid and dotted lines, units: m), horizontal wind perturbations (vector, units: m s−1) and vorticity of horizontal perturbation wind (shaded, units: 10−5 s−1) at 900 hPa associated with the UL [part (i)], where thick broken rectangles represent KAs of the cyclone: (a) 0600 UTC 28 December 2004; (b) 1800 UTC 28 December 2004; (c) 1200 UTC 29 December 2004; and (d) 0000 UTC 30 December 2004.](/cms/asset/0644534f-ae6e-42db-8fa0-51ea5827a666/zela_a_11817014_f0011_ob.jpg)
In the latter stage of EDPS1, the front relating to the cyclone enhanced, as did warm advection (b), which was conducive to enhancement of near-surface positive θ anomalies. Negative height and positive vorticity perturbations associated with the ESL both strengthened significantly (b), with the cyclone centred in their extrema regions. Precipitation associated with the cyclone became more intense, and thus forcings of condensation became much stronger (b): negative height and positive vorticity perturbations associated with the IL enhanced significantly, with the cyclone locating around their extrema regions, and this favoured the cyclone's rapid deepening. Aided by the tropopause-folding processes and horizontal PV advection, upper-level positive PV anomalies to the west and north of the cyclone enhanced (c), and thus forcings from the UL intensified in the middle and upper troposphere (not shown). However, in the lower troposphere, the upper-level forcing remained weak since the cyclone was still far from the positive upper-level PV anomalies (c): weak negative height perturbations favourable for the cyclone's development mainly appeared in the west of the cyclone, whereas weak positive height perturbations detrimental to the cyclone's deepening mainly occurred east of the cyclone's centre (b).
5.2.2. Direct forcings from different layers during EDPS2.
Favoured by enhanced southwesterlies associated with the cyclone, warm advection enhanced significantly (c, d), and thus positive θ anomalies at near-surface levels became more intense. As a result, negative height and positive vorticity perturbations associated with the ESL grew much stronger (c, d). Moreover, extrema centres of height and vorticity perturbations almost coincided with the cyclone centre, and this resulted in conditions favourable for rapid deepening of the cyclone. Since upward motions (d, e) and moisture (d, e) remained well-coupled, precipitation associated with the cyclone persisted (c, d), and thus condensation-induced positive PV anomalies became more intense (d, e), as did the negative height and positive vorticity perturbations associated with LHR (c, d), which favoured the cyclone's development. As the short-wave trough and cyclone both moved northeastward (d, e), upper-level positive PV anomalies to the west and north of the cyclone merged, enhanced and entered the northwest quadrant of the cyclone (e, g). Therefore, negative height and positive vorticity perturbations associated with the UL enhanced remarkably, and the cyclone was mainly located to the east of extrema centres of height and vorticity perturbations (c, d). Intense negative height perturbations associated with the upper-level forcings appeared in KAs of the cyclone, which accelerated the cyclone's development significantly.
5.2.3. Interactions among different layers during EDPS1 and EDPS2.
Although direct forcings associated with the UL, IL and ESL were analysed in detail, additional attention must be paid to indirect effects, of which interactions among different layers are the most important because the explosive cyclogensis is a comprehensive result of both direct and indirect effects. As discussed in Section 4, horizontal advection of PV and θ were vital to variations of PV and θ in the UL and ESL respectively. Therefore, they were investigated in detail. In the IL, condensation dominated the production of positive PV anomalies. Since negative geopotential height and positive vorticity perturbations can represent the intensity of convective activities, these perturbations were selected for further study.
Interactions between the ESL and UL were shown in and . From the left column of , in the UL, signals from the ESL were very weak. The weak cyclonic perturbation circulations associated with the ESL enhanced significantly as the cyclone developed, and they were favourable for the enhancement of upper-level positive PV anomalies through horizontal positive PV advection. As the left column of shows, at near-surface levels, signals from the UL were intense. Within KAs of the cyclone, positive meridional wind perturbations associated with the UL maintained during EDPS1 () and strengthened significantly as the upper-level PV anomalies merged during EDPS2. Perturbation southerlies favoured the maintenance and enhancement of positive θ advection, which dominated the variation of positive θ anomalies at near-surface levels. As discussed above, the upper-level forcings influenced the ESL significantly, whereas the signals from the ESL reacted on the UL slightly. A weak positive feedback existed between the upper-level positive PV anomalies and near-surface positive θ anomalies during both explosive developing stages, which favoured the cyclone's development.
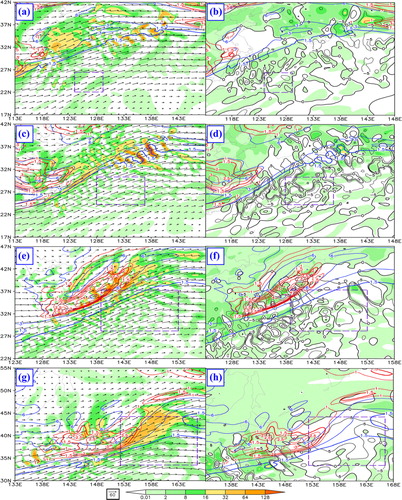
Fig. 12 Horizontal perturbation wind field at 250 hPa (vector, units: m s−1) associated with the ESL (left column) and the IL (right column), where the red solid line represents PV anomalies (units: PVU), the blue solid line is PV (units: PVU) and the rectangles represent KAs of the cyclone. Panels (a) and (b) are for 0600 UTC 28 December 2004; (c) and (d) for 1800 UTC 28 December 2004; (e) and (f) for 1200 UTC 29 December 2004; and (g) and (h) for 0000 UTC 30 December 2004.
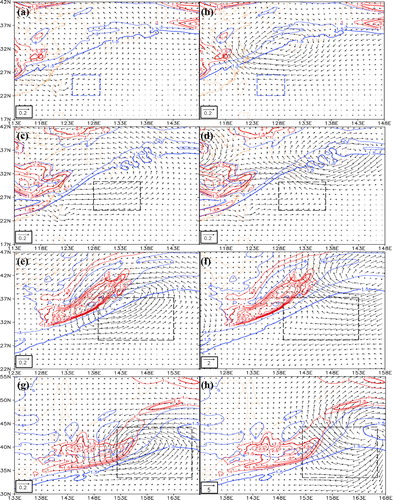
Fig. 13 Horizontal perturbation wind field at 950 hPa (vector, units: m s−1) associated with the UL (left column) and the IL (right column), where the red solid line represents θ anomalies (units: K), the blue solid line is θ (units: K) and the rectangles represent KAs of the cyclone. Panels (a) and (b) are for 0600 UTC 28 December 2004; (c) and (d) for 1800 UTC 28 December 2004; (e) and (f) for 1200 UTC 29 December 2004; and (g) and (h) for 0000 UTC 30 December 2004.
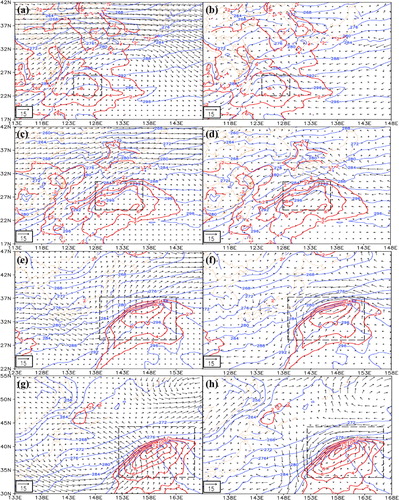
Table 1. KA-averaged zonal wind perturbations (up, units: m s−1), meridional wind perturbations (vp, units: m s−1), geopotential height perturbations (hp, units: m) and vorticity perturbations (vorp, units: 10−5 s−1) during interactions among the upper, interior and lower layers
Interactions between the UL and IL were shown in and . From the right column of , in the UL, signals from the IL were very weak during EDPS1 and then enhanced significantly during EDPS2 due to maintenance and enhancement of precipitation associated with the cyclone. During both explosive developing stages, in the vicinity of the cyclone, the condensation-induced perturbation wind mainly blew from low-PV areas to high-PV areas, causing negative horizontal PV advection around the cyclone and positive PV anomaly regions, which were detrimental for the maintenance of upper-level positive PV anomalies. From a, c, during EDPS1, since upper-level positive PV anomalies were still far from the cyclone, in the IL, forcings from the UL mainly caused weak positive height and negative vorticity perturbations within KAs (), where ascending motions and moisture were well coupled and favourable for precipitation. Therefore, the upper-level signals were mainly detrimental for precipitation during EDPS1. However, during EDPS2, a favourable configuration of positive upper-level PV anomalies and the cyclone made signals from the UL very favourable for precipitation: very intense negative height perturbations appeared around the cyclone (, e, g) and coupled with intense ascending motions as well as abundant moisture. From the above, during EDPS2, a negative feedback existed between positive PV anomalies of the upper-level and condensation-induced PV anomalies in the IL, which acted to slow down the cyclone's development.
Fig. 14 Geopotential height perturbations (black solid and dashed lines, units: m) and vorticity of horizontal perturbation wind (blue solid and dashed lines, units: 10−5 s−1) at 750 hPa associated with the UL (left column) and the ESL (right column), where the shaded areas represent RH (units: %), the red solid line is vertical velocity (units: cm s−1) and the rectangles represent KAs of the cyclone. Panels (a) and (b) are for 0600 UTC 28 December 2004; (c) and (d) for 1800 UTC 28 December 2004; (e) and (f) for 1200 UTC 29 December 2004; and (g) and (h) for 0000 UTC 30 December 2004.
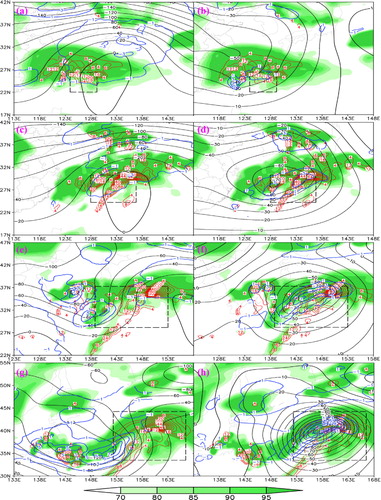
Interactions between the ESL and IL were shown in and . From b, d, during EDPS1, as precipitation began, signals from the IL strengthened at near-surface levels. The meridional wind component caused by condensation was positive and stronger than that associated with upper-level forcings (). Thus, positive θ advection associated with the IL was very favourable for maintenance and enhancement of near-surface positive θ anomalies. During EDPS2, the KA-averaged meridional wind turned to negative () due to the intense northerlies associated with the cold front in the west of the cyclone (f, h). Therefore, KA-averaged meridional wind perturbations were mainly causing cold advection, which was detrimental to the maintenance of near-surface positive θ anomalies and thus slowed down the cyclone's development. From the right column of , signals from the ESL were intense in the IL, and as the cyclone developed, the signals enhanced. The negative height and positive vorticity perturbations associated with the ESL () were well coupled with ascending motions and abundant moisture around the cyclone. Therefore, signals from the ESL were very favourable for precipitation associated with the cyclone. As mentioned above, a positive feedback existed between the condensation-induced PV anomalies in the IL and positive θ anomalies in the ESL during EDPS1, which favoured the cyclone's development; whereas as the cold front and northerlies associated with the cyclone enhanced significantly during EDPS2, a negative feedback appeared, which slowed down the cyclone's development.
5.2.4. Relative importance of forcings from different layers.
Comparing the relative importance of different forcings is vital to understand the explosive cyclogenesis. Since the direct effects were generally much more important than indirect effects, the calculation of relative importance only include the direct effects. Geopotential height perturbations were used to calculate the quantitative percentage of forcings from different layers, since the extratropical cyclone is a synoptic-scale system, and the geostrophic adjustment is accomplished by perturbation wind adjusting to perturbation height. In order to show both the maximum effect and the averaged effect, the quantitative percentage was calculated in two ways: one was by using the minimum geopotential height perturbations within the KAs; and the other was by using the KA-averaged geopotential height perturbations.
Rapid deepening of the cyclone was dominated by forcings from the ESL throughout the developing stage (), especially the initial stage of EDPS1, because positive θ anomalies at near-surface levels were very intense and coincided with the cyclone well ( and ). The positive θ advection (baroclinity) was the most favourable factor to the cyclone's development (Yoshida and Asuma, Citation2004). Moreover, sensible heat exchange was also favourable ().
Table 2. Percentage of the decrease of 900-hPa geopotential height associated with the UL [part (i)], IL [part (ii)] and ESL [part (iii)], where the values with and without parentheses are calculated by KA-averaged and minimum geopotential height perturbations within the KA respectively, and the descriptions following the values are derived from the calculation results according to the above two methods
Condensation firstly exerted slight or even detrimental effects on the cyclone's development, since precipitation during the initial stage of EDPS1 was weak and far from the cyclone centre (a and a). Then, from the latter stage of EDPS1 on, precipitation associated with the cyclone enhanced remarkably (b–d) and coupled well with the cyclone; thus, condensation-induced forcings strengthened significantly (). However, during the latter stage of EDPS2, due to forcings from the ESL and UL (d and d), the cyclone moved northward relative to precipitation (not shown), as a result, the KA-averaged condensation-induced forcings weakened significantly ().
Since intense tropopause-folding processes associated with the ULJ and short-wave trough occurred in this case ( and ), forcings from the UL were intense (). However, since upper-level positive PV anomalies were far from the cyclone during EDPS1 (a, b), upper-level forcings were therefore only slightly favourable for the cyclone's development. In EDPS2, as the short-wave trough and cyclone both moved northeastward, a favourable configuration formed (Section 4.3). Therefore, forcings from the UL enhanced significantly from a KA-averaged value of −2 to −48 m, and this accelerated the cyclone's development remarkably.
6. Discussion and conclusions
On the whole, the explosive cyclone investigated in this study developed following a Type-A-cyclone morphology (Petterssen and Smebye, Citation1971; Plant et al., Citation2003; Gray and Dacre, Citation2006), since forcings from the ESL were much stronger than those from the UL (); the separation between the upper-level trough and low-level cyclone remained almost constant ( and ) during EDPS1 and EDPS2; and baroclinity of the system was very strong ( and ).
A corresponding ‘fake dry’ run that retained the main processes of moisture but eliminated LHR was carried out, and similar results were found: the cyclone in the ‘fake dry’ run was much weaker than that in the control run, and it also spanned a much shorter lifetime (not shown). Therefore, the selected case was a typical PO–O cyclone (Kuwano-Yoshida and Asuma, Citation2008), and LHR was indeed a necessary condition for the explosive cyclogenesis.
During EDPS1, direct effects associated with LHR firstly acted detrimentally upon the cyclone's deepening (), since the precipitation was weak and far from the cyclone centre, and then condensation-induced forcings acted conversely (b), as the precipitation centre enhanced and coincided with the cyclone centre. Therefore, features of precipitation, including intensity, duration, range and relative configuration to the cyclone were all important to influences of LHR on the cyclone's development – a result that has also been found by Kuwano-Yoshida and Asuma, (Citation2008). During EDPS2, direct effects of condensation maintained intensity and favoured the cyclone's development (c, d), whereas the IL's interactions with the UL and ESL both involved negative feedbacks, which slowed down the cyclone's development. The same result was also found by Plant et al. (Citation2003).
The intensity of upper-level PV anomalies and their relative configuration to the cyclone were also very important to the cyclone's development. During EDPS2, upper-level PV anomalies merged, enhanced and entered KAs of the cyclone, and thus direct signals associated with the UL enhanced significantly and favoured the cyclone's development remarkably (, c, d). Moreover, interactions between the UL and ESL involved positive feedbacks, which also accelerated the cyclone's deepening. Although a negative feedback appeared in interactions between the UL and IL, forcings from the UL favoured precipitation during EDPS2 (), and direct effects of condensation were conducive to the cyclone's development (). Therefore, the enhancement of upper-level forcings and favourable relative configuration of the cyclone to upper-level positive PV anomalies dominated the transition from a moderate explosive cyclone to an extreme one.
Based on sensitivity experiments, Kuwano-Yoshida and Asuma (Citation2008) found that LHR affects cyclone's development mainly through nonlinear interactions with the upper-level trough and jet, and the ULJ changed significantly after removing LHR. However, the PPVI results here indicate that forcings from the ESL were more important, and the condensation only influenced the ULJ slightly ( and ). Furthermore, Kuwano-Yoshida and Asuma (Citation2008) proposed that condensation was favourable for the maintenance of upper-level positive PV anomalies. However, the PPVI results indicated that horizontal wind perturbations caused by LHR were detrimental for high-level positive PV anomalies through negative horizontal PV advection. From the above, nonlinearity associated with LHR was very important to the explosive cyclone's development.
In this study, forcings from different layers were analysed in detail to enhance understanding of PO–O cyclones. However, interactions between the cyclone and its background environment were not discussed. Actually, the background environment ‘has to’ provide favourable conditions for the cyclone to develop. In the future, energy budget equations including interactions between the cyclone and its background environment will be utilised to investigate the PO–O cyclones, and a view based on energy will be helpful to understand the rapid deepening of PO–O cyclones.
7. Acknowledgements
The authors thank the JMA, NCEP and NOAA for providing the data. Sincere thanks are also extended to Prof. Christopher A. Davis for his valuable suggestions about the PPVI method, as well as Profs. Fuqing Zhang and Jimy Dudhia for their insightful suggestions about the sensitivity experiments and configurations of the simulations. This research was supported by the National Key Basic Research and Development Project of China (2012CB417201) and the National Natural Science Foundation of China (41205027 and 41375053). The authors also thank two anonymous reviewers for many useful comments and suggestions.
Notes
1Yoshida and Asuma (2004) proposed that 1.2 Bergerons is the most common deepening rate of PO–O cyclones, whereas 2.6 Bergerons is a really rare and extreme deepening rate.
2Actually, the sensitivity to KA selection was tested as follows: in calculating , the KA-average was calculated three times: (1) using the rectangles shown in ; (2) using smaller rectangles [moving all four boundary lines of the KAs shown in inward by 1° (latitude/longitude), except for a, which used 0.5°]; and (3) using bigger rectangles [moving all four boundary lines of the KAs shown in outward by 1° (latitude/longitude), except for a, which used 0.5°]. After calculations based on all three types of KAs, although the exact KA-averaged value changed moderately, the ranking of the relative importance of different factors remained unchanged.
Related Research Data
References
- Allen J. T. , Pezza A. B. , Black M. T . Explosive cyclogenesis: a global climatology comparing multiple reanalyses. J. Clim. 2010; 23: 6468–6484.
- Black M. T. , Pezza A. B . A universal, broad-environment energy conversion signature of explosive cyclones. Geophys. Res. Lett. 2013; 40: 452–457.
- Bretherton F. P . Critical layer instability in baroclinic flows. Q. J. Roy Meteorol. Soc. 1966; 92: 325–334.
- Charney J. G . The use of primitive equations of motion in numerical prediction. Tellus. 1955; 7: 22–26.
- Chen S. J. , Dell'Osso L . A numerical case study of East Asian coastal cyclogenesis. Mon. Weather Rev. 1987; 115: 1127–1139.
- Chen S. J. , Kuo Y. H. , Zhang P. Z. , Bai Q. F . Climatology of explosive cyclones off the East Asian coast. Mon. Weather Rev. 1992; 120: 3029–3035.
- Davis C. A . Piecewise potential vorticity inversion. J. Atmos. Sci. 1992; 49: 1397–1411.
- Davis C. A. , Emanuel K. A . Potential vorticity diagnostics of cyclogenesis. Mon. Weather Rev. 1991; 119: 1929–1953.
- Davis C. A. , Grell E. D. , Shapiro M. A . The balanced dynamical nature of a rapidly intensifying oceanic cyclone. Mon. Weather Rev. 1996; 124: 3–26.
- Davis C. A. , Stoelinga M. T. , Kuo Y. H . The integrated effect of condensation in numerical simulations of extratropical cyclogenesis. Mon. Weather Rev. 1993; 121: 2309–2330.
- Dudhia J . Numerical study of convection observed during the Winter Monsoon Experiment using a mesoscale two dimensional model. J. Atmos. Sci. 1989; 46: 3077–3107.
- Egger J . Piecewise potential vorticity inversion and vortex interaction. J. Atmos. Sci. 2009; 66: 3208–3216.
- Ertel H . Ein neuer hydrodynamischer wirbelsatz. Meteorol. Z. 1942; 59: 271–281.
- Gray S. L. , Dacre H. F . Classifying dynamical forcing mechanisms using a climatology of extratropical cyclones. Q. J. Roy. Meteorol. Soc. 2006; 132: 1119–1137.
- Grell G. A . Prognostic evaluation of assumptions used by cumulus parameterizations. Mon. Weather Rev. 1993; 121: 764–787.
- Grell G. A. , Dudhia J. , Stauffer D. R . A Description of the Fifth-Generation Penn State/NCAR Mesoscale Model (MM5). 1995; 122. NCAR Tech. Note NCAR/TN–398+STR.
- Hakim G. J. , Keyser D. , Bosart L. F . The Ohio valley wave-merger cyclogenesis event of 25–26 January 1978. Part II: diagnosis using quasigeostrophic potential vorticity inversion. Mon. Weather Rev. 1996; 124: 2176–2205.
- Hoskins B. J. , McIntyre M. E. , Robertson A. W . On the use and significance of isentropic potential vorticity maps. Q. J. Roy. Meteorol. Soc. 1985; 111: 877–946.
- Huo Z. H. , Zhang D. L. , Gyakum J. R . Interaction of potential vorticity anomalies in extratropical cyclogenesis. Part I: static piecewise inversion. Mon. Weather Rev. 1999; 127: 2546–2562.
- Huffman G. J . Estimates of root-mean-square random error contained in finite sets of estimated precipitation. J. Appl. Meteorol. 1997; 36: 1191–1201.
- Isobe A. , Kako S . A role of the Yellow and East China Seas in the development of extratropical cyclones in winter. J. Clim. 2012; 25: 8328–8340.
- Iwao K. , Inatsu M. , Kimoto M . Recent changes in explosively developing extratropical cyclones over the winter Northwestern Pacific. J. Clim. 2012; 25: 7282–7296.
- Kelly R. D . Horizontal roll and boundary layer interrelationships over Lake Michigan. J. Atmos. Sci. 1984; 41: 1816–1826.
- Koshyk J. N. , McFarlane N. A . The potential vorticity budget of an atmospheric general circulation model. J. Atmos. Sci. 1996; 53: 550–563.
- Kuwano-Yoshida A. , Asuma Y . Numerical study of explosively developing extratropical cyclones in the northwestern Pacific region. Mon. Weather Rev. 2008; 136: 712–740.
- Lim E. P. , Simmonds I . Explosive cyclone development in the Southern Hemisphere and a comparison with Northern Hemisphere events. Mon. Weather Rev. 2002; 130: 2188–2209.
- Liou C. S. , Elsberry R. L . Heat budgets of analyses and forecasts of an explosively deepening maritime cyclone. Mon. Weather Rev. 1987; 115: 1809–1824.
- Luo A. R. , Smith P. J. , Zwack P . A diagnosis of the explosive development of two extratropical cyclones. Mon. Weather Rev. 1992; 120: 1490–1523.
- Markowski P. , Richardson Y . Mesoscale Meteorology in Midlatitudes. 2010; Hoboken, NJ: Wiley-Blackwell. 407.
- Martin J. E. , Marsili N . Surface cyclolysis in the North pacific Ocean. Part II: piecewise potential vorticity diagnosis of a rapid cyclolysis event. Mon. Weather Rev. 2002; 130: 1264–1281.
- Martin J. E. , Otkin J. A . The rapid growth and decay of an extratropical cyclone over the central Pacific Ocean. Weather Forecast. 2004; 19: 358–376.
- Rausch R. L. M. , Smith P. J . A diagnosis of a model simulated explosively developing extratropical cyclone. Mon. Weather Rev. 1996; 124: 875–904.
- Reisner J. R. , Rasmussen J. , Bruintjes R. T . Explicit forecasting of supercooled liquid water in winter storm using the MM5 mesoscale model. Q. J. Roy. Meteorol. Soc. 1998; 124B: 1071–1107.
- Roebber P. J . On the statistical analysis of cyclone deepening rates. Mon. Weather Rev. 1989; 117: 2293–2298.
- Roebber P. J. , Schumann M. R . Physical processes governing the rapid deepening tail of maritime cyclogenesis. Mon. Weather Rev. 2011; 139: 2776–2789.
- Rudeva I. , Gulev S. K . Composite analysis of North Atlantic extratropical cyclones in NCEP–NCAR reanalysis Data. Mon. Weather Rev. 2011; 139: 1419–1446.
- Sanders F. , Gyakum J. R . Synoptic-dynamic climatology of the “bomb”. Mon. Weather Rev. 1980; 128: 2920–2934.
- Sinclair M. R . Objective identification of cyclones and their circulation intensity, and climatology. Weather Forecast. 1997; 12: 595–612.
- Spengler T. , Egger J . Potential vorticity attribution and causality. J. Atmos. Sci. 2012; 69: 2600–2607.
- Strahl J. L. S. , Smith P. J . A diagnostic study of an explosively developing extratropical cyclone and an associated 500-hPa trough merger. Mon. Weather Rev. 2001; 129: 2310–2328.
- Tilinina N. , Gulev S. K. , Rudeva I. , Koltermann P . Comparing cyclone life cycle characteristics and their interannual variability in different reanalyses. J. Clim. 2013; 26: 6419–6438.
- Petterssen S. , Dunn G. E. , Means L. L . Report of an experiment in forecasting of cyclone development. J. Meteorol. 1955; 12: 58–67.
- Petterssen S. , Smebye S. J . On the development of extratropical cyclones. Q. J. Roy. Meteorol. Soc. 1971; 97: 457–482.
- Plant R. S. , Craig G. C. , Gray S. L . On a threefold classification of extratropical cyclogenesis. Q. J. Roy. Meteorol. Soc. 2003; 129: 2989–3012.
- Parsons K. E. , Smith P. J . An investigation of extratropical cyclone development using a scale-separation technique. Mon. Weather Rev. 2004; 132: 956–974.
- Wu L. T. , Martin J. E. , Petty G. W . Piecewise potential vorticity diagnosis of the development of a polar low over the Sea of Japan. Tellus. 2011; 63: 198–211.
- Yoshida A. , Asuma Y . Structures and environment of explosively developing extratropical cyclones in the northwestern Pacific region. Mon. Weather Rev. 2004; 132: 1121–1142.
- Yoshiike S. , Kawamura R . Influence of wintertime large-scale circulation on the explosively developing cyclones over the western North Pacific and their downstream effects. J. Geophys. Res. 2009; 114: D13110.
- Zwack P. , Okossi B . A new method for solving the quasi-geostrophic omega equation by incorporating surface pressure tendency data. Mon. Weather Rev. 1986; 114: 655–666.
8. Appendix
The PPVI equations are as follows:A1
A2
where q
n
is the perturbation PV; Φ
n
the perturbation geopotential; Ψ
n
the perturbation non-divergent stream function; f the Coriolis parameter; a the radius of the Earth; λ the longitude; κ=R/C
p
; π=C
p
(p/p
o
)
κ
, serving as the vertical coordinate; and g is gravitational acceleration. Φ* and Ψ* are defined as follows: , where A is an instantaneous meteorological variable, Ā is the time average and A′ is the deviation from Ā. With appropriate upper, lower and lateral boundary conditions, eqs. (A1)–(A2) can be solved by standard successive over-relaxation. For complete descriptions of the boundary conditions and numerical calculation methods, please refer to Davis and Emanuel (Citation1991).