
Abstract
In the summer rainy season, the Korean Peninsula is frequently influenced by severe weather phenomena such as floods and rain-induced landslides. A band-shaped precipitation system associated with unstable atmospheric conditions occurred over northwest Korea on 27 July 2011. This precipitation system produced heavy rainfall over the Seoul metropolitan area, which received over 80 mm h−1 of rainfall and suffered 70 weather-related fatalities. To investigate the precipitation system, we used diverse meteorological data of environmental condition and estimated three-dimensional wind field from dual-Doppler radar measurements of vertical air motion. Environmental conditions included high equivalent potential temperature (θ e ) of over 355 K at low levels, and low θ e of under 330 K at middle levels, causing vertical instability. Furthermore, a pressure trough was located to the northwest of Korea, favouring the development of the band-shaped precipitation system. The tip of the band-shaped precipitation system was made up of line-shaped convective systems (LSCSs) that caused flooding and landslides, and the LSCSs were continuously enhanced by merging between new cells and the pre-existing cell. The position of merging moved from the coast to offshore areas and influenced the positioning of the regions of enhanced convection. In turn, this affected the roughness of the convective cell and the internal structure of the enhanced convective regions. Onshore, the convective area was higher than in offshore areas because of strong convergence (≤−4×10⁻⁴ s−1) at low levels caused by friction over land. The strong convergence generated strong updraft (≥4 m s−1) that influenced the height of the convective area. The convective region offshore was wider than that onshore because of weak convergence (≥−2.2×10⁻⁴ s−1) at low levels. Updraft in offshore areas was weak (≤3 m s−1) compared with onshore, resulting in a lower and wider convective area. Spatial variations in surface roughness result in different structural features and profiles of divergence within LSCSs, even if they originate in the same convective region.
1. Introduction
Heavy rainfall over the Korean Peninsula frequently occurs during summer as a result of atmospheric instability, pressure troughs and severe weather (e.g. fronts, typhoons). Such rainfall can cause disasters (e.g. landslides and floods) and is usually associated with mesoscale convective systems (MCSs). The Seoul metropolitan area commonly suffers damage related to MCSs that are accompanied by line-shaped convective systems (LSCSs; Shinoda et al., Citation2009). The LSCSs occasionally occur at the western tip of a band-shaped precipitation system, and the heavy rainfall of such systems commonly results in natural disasters (Ishizuka and Kodama, Citation2001). In the case of a precipitation event on 27 July 2011, the LSCSs were continuously generated at the tip of a band-shaped precipitation system that brought heavy rainfall.
MCSs are generally divided into meso-α scale, meso-β scale and meso-γ scale systems, corresponding to length scales of 200–2000, 20–200 and 2–20 km, respectively (Orlanski, Citation1975). In Korea, meso-β scale line-shaped systems are frequently observed and there have been many observational and model studies of their development mechanism (Sun and Lee, Citation2002; Shin and Lee Citation2005; Kim and Lee, 2006; You et al., Citation2010; Ha et al., Citation2011; Jeong et al., Citation2012, Citation2013; Jang et al., 2013). Such systems are also commonly observed and studied in neighbouring countries (e.g. China and Japan) because of their potential to cause loss of life and damage to property. These studies have shown that moist air at low levels, a southwesterly low-level jet (LLJ), low-level convergence and vertical instability are important factors for the development of LSCSs, as shown in various countries (Kato, Citation1998, Citation2006; Seko et al., Citation1999; Kato and Goda, Citation2001; Geng et al., Citation2004, Citation2009; Schumacher and Johnson, Citation2008; Shinoda et al., Citation2009). Schumacher and Johnson (Citation2008) and Shinoda et al. (Citation2009) concluded that low-level convergence associated with synoptic conditions (fronts and pressure troughs) is a major cause of the occurrence of new cells. Seko (Citation2010) found that typical LSCSs in East Asia are of the back-building (BB) type, in which new convective cells are repeatedly generated at the tip of a band-shaped precipitation system.
Many studies have examined band-shaped (line-shaped) precipitation systems organized as LSCSs. Most such studies have focused on the environmental conditions of precipitation development, rather than on differences in the internal structure of LSCSs between coastal regions and land. In the United States, most studies on linear or quasi-linear precipitation systems have been carried out over the North American landmass (Bluestein and Jain, Citation1985; Schumacher and Johnson, Citation2005) and have not considered the influence of changing roughness on surface friction.
Lee et al. (Citation1998) reported that heavy rainfall in Korea exhibits meridional variability associated with the land–sea boundary. In addition, Roeloffzen et al. (Citation1986) proposed that vertical air motion in the coastal zone is strongly affected by severe weather. When precipitation cells move to the coastal zone, a sudden change in the internal structure of the precipitation system commonly occurs upstream, near the coast. It is clear that a study of the horizontal and vertical movement of air using dual-Doppler radar analysis is needed to understand the development mechanism of nearshore LSCSs in Korea.
A band-shaped precipitation system was observed over the Korean Peninsula on 27 July 2011. The western tip of the system, which was made up of LSCSs, produced intense rainfall (>80 mm h−1) on the Seoul metropolitan area. The region of heavy rainfall (>100 mm) for 3 hours was mainly located onshore, resulting in floods and landslides. Thus, it is important to consider the factors that resulted in biased rainfall distributions onshore. This study focuses on the nearshore enhancement of LSCSs in the convective region of the precipitation system. The aim of the study is to investigate the enhancement mechanism of LSCSs in the coastal region and to assess the effect of this enhancement on the internal structure of the system.
The remainder of this paper is organized as follows. The data used in this study are described in Section 2, and the rainfall event and environmental conditions are described in Section 3. The internal structure of the precipitation system, its morphological features and the propagation of the LSCSs are considered in Section 4. Section 5 discusses the causes of LSCS enhancement at the tip of the precipitation system and differences between onshore and offshore regions. Finally, a summary is provided in Section 6.
2. Data and analysis method
2.1. Data
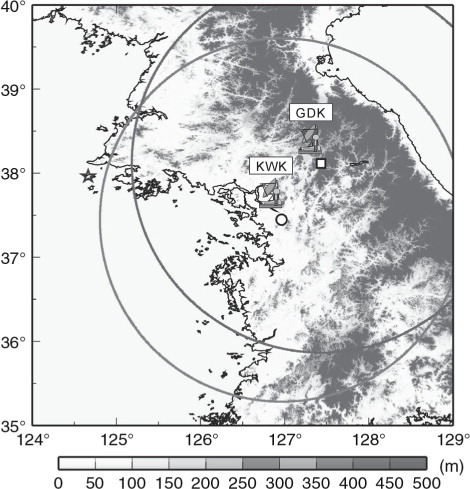
In this study, two S-band Doppler radars operated by the Korea Meteorological Administration (KMA) were used to conduct dual-Doppler radar analysis. As shown in , these radars are located on Gwanak Mountain (KWK; 37.44°N, 126.96°E) and Gwangdeok Mountain (GDK; 38.11°N, 127.43°E). The distance between the two Doppler radars is 85 km and they cover radii of 240 km (KWK) and 250 km (GDK), and record volume scans of reflectivity and Doppler velocity. The two Doppler radars have identical specifications, with a sampling resolution of 250 m in the radial direction. The volume scan of the KWK radar includes observations at 13 elevation angles (0.2°, 0.5°, 0.9°, 1.3°, 1.7°, 2.1°, 3.1°, 4.3°, 5.8°, 7.6°, 9.8°, 12.6° and 15.9°) and the GDK radar observes 12 elevation angles (0.0°, 0.1°, 0.2°, 0.3°, 0.6°, 1.0°, 1.7°, 2.8°, 4.6°, 7.6°, 12.3° and 20.0°).
Fig. 1 Observation sites of Doppler radar with geographical height. The open circle and quadrangle are the observation ranges of Doppler radar.
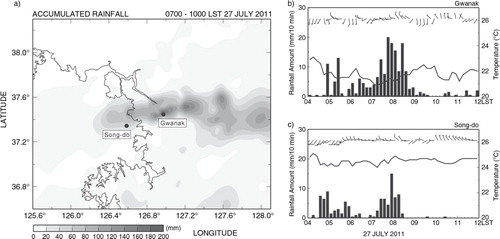
The accumulated rainfall amount, temperature and surface wind recorded by two Automatic Weather Systems (AWS) are presented in .
Fig. 2 The accumulated rainfall amount (mm) over the Korea during 3 hours (07–10 LST) and time series of temperature (°C, solid line), wind direction and speed (m s−1, barb) and rainfall amount (mm hr−1, bar graph) observed at Gwanak and Song-do AWS station on 27 July 2011. Half and full barbs are 5 and 2.5 m s−1, respectively.
The synoptic scale cloud distribution was analysed using infrared images from the Multi-functional Transport Satellite (MTSAT-IR), sourced from the Weather Satellite Image Archive, Kochi University, Japan. In addition, the analysis fields from the Japan Meteorological Agency (JMA) Meso-Scale Model (MSM) and surface weather maps were used to investigate the environmental conditions around the Korean Peninsula. We used MSM data for temperature, equivalent potential temperature, geopotential height and wind at 925 and 600 hPa.
2.2. Analysis method
The raw radar data were interpolated onto a Cartesian coordinate system using the scheme of Cressman (Citation1959) with a horizontal grid interval of 1 km and a vertical grid interval of 0.25 km. The weighting function for interpolation used horizontal and vertical effective radii of 1.5 and 1.0 km, respectively.
We produced three-dimensional (3-D) wind field data using the two Doppler radars in order to analyse the structure of the precipitation system. Generally, a variational method (wind synthesis) using the radial velocity from two or more radars can provide the 3-D wind field (Ray et al., Citation1980; Sun and Crook, Citation1997; Gao et al., Citation1999, Citation2004; Shapiro and Mewes, Citation1999). In this study, to obtain a 3-D wind field with reasonable vertical velocities, we used the variational method proposed by Liou et al. (Citation2012a). The cost function of this variational method consists of the constraints given by Liou and Chang (Citation2009) with some modifications. Although this method tends to underestimate the maximum vertical velocity (Liou et al., Citation2012b), it can produce relatively accurate horizontal winds and gives reasonable vertical velocities within the precipitation system.
Dixon and Wiener (Citation1993) reported that a radar reflectivity threshold of 35 dBZ was suitable for monitoring the development and evolution of precipitation cells. For this reason, to clearly reveal the shape, movement and evolution of cells, the threshold for precipitation cells is defined as the area with reflectivity greater than 35 dBZ at 2 km above sea level (ASL). In addition, the area with reflectivity greater than 45 dBZ is referred to as the ‘convective region’. This region corresponds to the region of intense rainfall.
Airflow in the precipitation system is only shown above the lowest level and below 8 km ASL, since the calculation error is large at upper levels due to the radar characteristics (i.e. due to noise). This is adequate to analyse the structure of the precipitation system, since most of the analysis area is below 8 km ASL.
3. Overview of heavy rainfall and the environmental of the LSCSs
3.1. Precipitation distribution
Meso-β scale LSCSs appeared over the central area of the Korean Peninsula during 0700–1000 LST on 27 July 2011. The LSCSs developed linearly and produced high amounts of rainfall around the Seoul metropolitan area. a shows the distribution of accumulated rainfall amount from LSCSs during 0700–1000 LST. Rainfall amounts over 100 mm are distributed along an east–west line, mostly onshore. The maximum rainfall amount of 173.5 mm over this time period was recorded at the Gwanak AWS station (onshore; b), while Song-do station (offshore; c) recorded 98.5 mm. The maximum intensity of rainfall was 120 mm h−1 at Gwanak and 90 mm h−1 at Song-do.
3.2. Synoptic features and cloud distribution
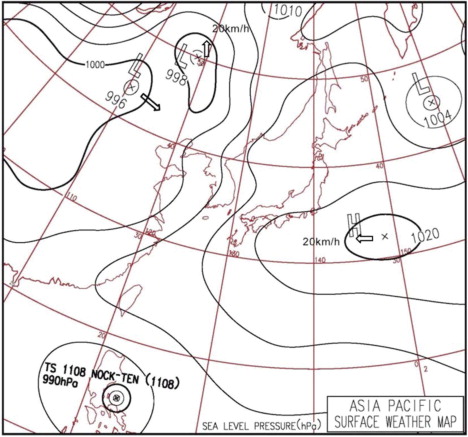
To understand the synoptic features, we present the horizontal distribution of surface atmospheric pressure in , which shows a surface weather map of East Asia at 0300 LST on 27 July 2011. Centres of high and low pressure were located southeast and northwest of the Korean Peninsula, respectively. They both moved towards the Korean Peninsula with a speed of 20 km h−1 and a trough was located over the peninsula. This distribution of trough and pressure favours the development of heavy rainfall in Korea (Lee at al., Citation1998). The other synoptic feature is the typhoon NOCK-TEN (TS 1108) located east of the Philippines, which was moving northwestwards. This typhoon played an important role in transporting warm and moist air at low levels to the Korean Peninsula.
Fig. 3 Surface weather map at 0300 LST on 27 July 2011.
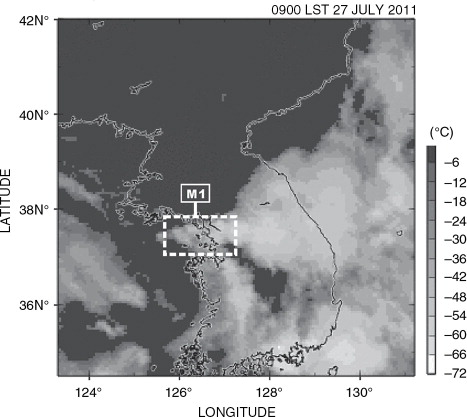
shows the cloud distribution at 0900 LST represented by the satellite black-body brightness temperature (TBB). Overall, the precipitation system is meso-α scale and extends from west to east with a clearly tapering western part. Usually the western tip of the precipitation system, where convective cells are continuously generated, is related to heavy rainfall (Ishizuka and Kodama, Citation2001). In this study, to analyse the western tip including the LSCSs, we use the M1 analysis domain, which only includes meso-β scale LSCSs.
Fig. 4 MASAT-IR black-body brightness temperature (°C) distribution over the Korean peninsula at 0900 LST on 27 July 2011. Dashed white box (M1) indicates domain for radar analysis.
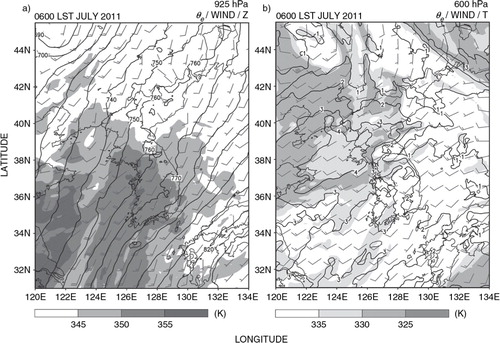
The sub-synoptic environment is shown in . A key feature during this event was the unstable conditions to the west of the Korean Peninsula, caused by the vertical difference in equivalent potential temperature between the low- and middle-level atmosphere. At low levels (a), warm and moist air (θ e >355 K) was being transported from the south-southwest at a speed of 15 m s−1. At middle levels (b), however, dry air (θ e <330 K) was being transported from the west-southwest. Kato (Citation2006) reported that the drier the middle-level air, the greater the atmospheric instability. Consequently, the continuous supply of high θ e at low levels and low θ e at middle levels played an important role in maintaining convective instability. The other factor governing atmospheric stability is the difference in wind direction. At the sub-synoptic scale, high low-level θ e and low- and middle-level θ e are supplied from the south-southwest and west-southwest, respectively. Such a difference in wind direction between low- and middle-levels has also been considered an important factor favouring the occurrence of precipitation systems similar to LSCSs (Kato, Citation2006). In addition, the weak synoptic-scale trough over the central Korean Peninsula (a) is also seen at the sub-synoptic scale and is another contributing factor to heavy rainfall. Therefore, the synoptic and sub-synoptic environmental conditions were favourable to the development of LSCSs.
Fig. 5 Mesoscale analysis for 0600 LST, 27 July 2011: (a) equivalent potential temperature θ e (K, shaded), geopotential height (gpm, contoured every 10 gpm) and horizontal wind vector and speed (m s−1, barbs); (b) θ e (K, shaded), temperature (°C, contour) and horizontal wind vector and speed (m s−1, barbs).
4. Structure of LSCSs
4.1. Structure and features
To reveal the structure and enhancement mechanism of LSCSs at meso-β scale, we analysed only the western tip of the precipitation system using radar data. shows the horizontal distribution of reflectivity in the M1 domain () at 2 km ASL at 20-minute intervals between 0700 LST and 1000 LST. The elongated pre-existing cell (C1) at 0700 LST is a LSCS with length 70 km and width 12 km. This eventually developed into a cell with length 120 km and width 20 km, with quasi-stationary characteristics, even though its shape changed.
Fig. 6 Horizontal distribution of reflectivity at 2 km ASL for (a) 0700 LST, (b) 0720 LST, (c) 0740 LST, (d) 0800 LST, (e) 0820 LST, (f) 0840 LST, (g) 0900 LST, (h) 0920 LST, (i) 0940 LST and (j) 1000 LST on 27 July 2011. The contour interval of reflectivity is 5 dBZ from 35 dBZ and small open circles indicate the location of the radar station (KWK). The tee quadrilateral boxes (S1, S2 and S3) demark the regions used for the analysis of the precipitation system.
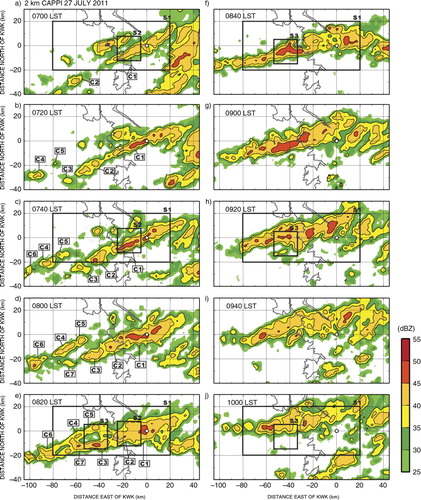
These LSCSs are of the BB type, with new cells continuously generated at the western tip of the band-shaped precipitation system. BB systems are characterised by an evolution via the merging of pre-existing and new cells. shows that the pre-existing cell (C1) grew from 70 to 90 km and developed by merging with new cells (C2 and C3) over the hour 0700–0800 LST. Subsequently, the elongated pre-existing cell (C1) was again extended and intensified at 0840 LST when C1 merged with C4, with C7 acting as a bridge.
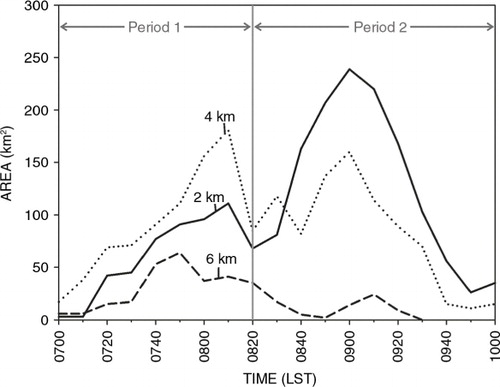
To show the evolution of the convective region in the LSCSs, we selected an analysis domain (S1) with an area of 100×40 km, including the convective region (≥45 dBZ), and examined the temporal development of the convective region. Since the pre-existing cell (C1) was quasi-stationary, the S1 domain is fixed in time. The domain boundary is depicted in . shows the temporal variation of the horizontal area of the convective region within S1 at 2, 4 and 6 km ASL every 10 minutes from 0700 LST to 1000 LST on 27 July 2011. There are two clear peaks in echo area, indicating that the precipitation system within M1 was enhanced on two occasions. The two peaks show different height profiles. The echo areas of the second peak at 4 and 6 km ASL were smaller than the first peak, while at 2 km the echo area was more than twice the first peak. The convective region associated with the first peak is therefore higher than the second peak, which has the potential to influence the height of the convective region. For this reason, the evolution of LSCSs during the 3 hours (0700–1000 LST) was separated into period 1 (0700–0820 LST) and period 2 (0820–1000 LST), based on the time of the local minimum in echo area at 2 and 4 km ASL.
Fig. 7 Time series of the horizontal area of the convective region (reflectivity greater than 45 dBZ) at 2 km (solid line), 4 km (dotted line) and 6 km (dashed line) ASL in S1 analysis domain. The boundary of the analysis domain (S1) is shown in .
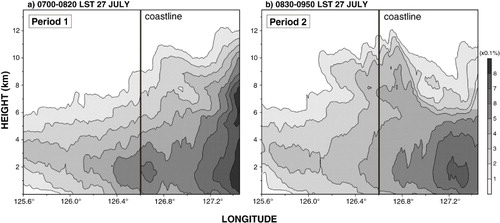
Differences between periods 1 and 2 were also seen in the location of developing convection. The convective region developed initially onshore; however, in period 2 it developed offshore. clearly shows the locations of the developing convective region. The appearance rates of radar reflectivity shown in are integrated along a north–south direction (≥10 dBZ) within the M1 analysis domain during each period. During period 1 (a), the appearance rate steeply increased up to 11 km near the onshore–offshore boundary (i.e. the coastline). Subsequently, during period 2 (b), the height of the appearance rate rapidly increased from 7 to 11 km near 126.0°E, rising up to 12 km around the coastline. This indicates that the enhanced convective regions during periods 1 and 2 were located onshore and offshore, respectively. The convective region moved following the merging of pre-existing and new cells. This merging occurred on the western side of pre-existing cell, so that the pre-existing cell was extended towards the west and the merging position shifted to the west. Eventually, this resulted in a change in the position of the convective region within the LSCSs.
Fig. 8 Appearance rate distribution of radar reflectivity of precipitation system in an east-west direction with height. This appearance rate is averaged in a south-north direction as M1 analysis domain shown in b. (a) and (b) were averaged from 0700 LST to 0820 LST and 0830 LST to 0950 LST, respectively.
4.2. Onshore convective region
shows the horizontal distribution of reflectivity (a, b), divergence (c, d) and wind vector (e, f) at 0750 and 0800 LST (period 1). During this period, most of the convective region developed onshore and the system had an elongated shape (a, b). The convective region developed at the pre-existing cell through merging with C2. c, d clearly shows the distribution of horizontal divergence at 0.5 km ASL. Most of the convergence region (negative values) was located east of the coastline (onshore). In particular, strong convergence (≤−0.5×10⁻³ s−1) occurred at the head of the onshore convective region along the coastline. The horizontal wind at 0.5 km ASL inside the LSCS was mostly southwesterly at 14 m s−1 in offshore regions, decreasing to 11 m s−1 in onshore areas with no major change in direction.
Fig. 9 Horizontal distributions of reflectivity, divergence and wind field in selected time (0750–0800 LST). A small open circle indicates the location of the radar station (KWK) and the thick grey contour line in each panel represents the coastline. The first column (a)–(b) shows the radar reflectivity at 2 km ASL. The contour interval of reflectivity is 5 dBZ from 35 dBZ and areas with reflectivity between 25 and 55 dBZ are shaded. The second column (c)–(d) shows the shaded divergence areas of 0.5 km ASL and contoured reflectivity like (a)–(b). The third column (e)–(f) shows the horizontal wind vectors and contoured reflectivity at 0.5 km ASL. The cross-section lines of (a) and (b) panels are presented in .
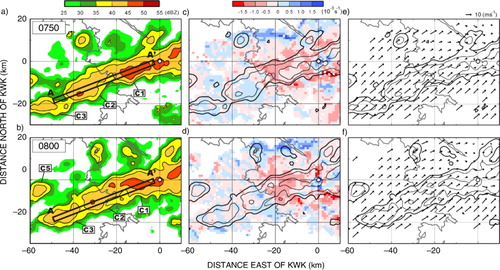
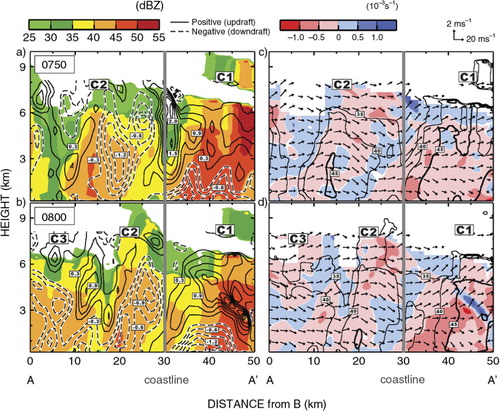
shows average vertical cross-sections along the trend labelled A–A’ (length: 50 km, width: 3 km) in a, b, to illustrate the vertical structure of the precipitation system. The trend is oriented parallel to the southwesterly wind direction and reveals the interrelation of onshore and coastal convective regions. The cells C2 and C3 moved steadily from A to A’ with an average speed 12 m s−1. The updrafts of C1 and C2 are apparent in the upstream region (a, b). In particular, the maximum updraft value (2 m s−1) occurred within the upstream region near the coastline and region of strong convergence (≤−0.5×10⁻³ s−1) were observed from low levels (the surface to 2 km ASL) on the western side of the convective region. These observations are explained as follows. The roughness of the onshore region caused the air to slow down as it crossed the water–land interface at low level, resulting in convergence near the coastline, which in turn generated updraft from low levels near the coastline. The weakening wind caused the convergence near the coastline. This convergence then generated updraft from low levels near the coastline, and this updraft strengthened the convective region onshore.
Fig. 10 The reflectivity, vertical velocity, divergence and wind fields of the vertical cross-sections averaged in the thin box (A–A’) as time of . The thick grey line on the horizontal axis indicates the coastline. The location of thin box is presented in each panel of a, b. The solid line and dashed line in (a)–(d) are positive and negative value of vertical velocity (m s−1, every 0.3), respectively. Thin contours in (e)–(h) indicate radar reflectivity from 35 dBZ with contour interval of 5 dBZ and thick contours are convective region in excess of 45 dBZ. The grey lines on the horizontal axis indicates the coastline.
4.3. Offshore convective region
shows the horizontal distribution of radar reflectivity, divergence and wind vector for the offshore convective region at two later times (0850 and 0900 LST). As shown in , the C7 cell merged with C4, which had developed as an LSCS that had merged with C1 at 0820 LST. The length of the precipitation system then increased and intensified offshore, and by 0850 the convective region was located mainly offshore (a, b). This shift from the previous onshore position was a result of the merging process (see Section 4.1).
Fig. 11 Same as . The cross-section lines of (a) and (b) panels are presented in .
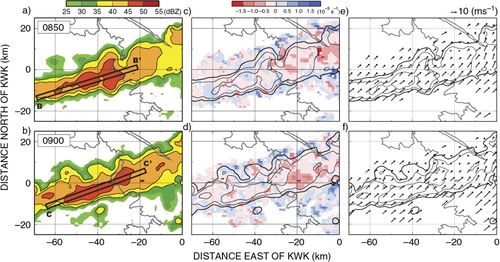
The divergence distribution at 0.5 km ASL (c, d) was similar to that an hour earlier in period 1, when the convective region was onshore (c, d). The strong offshore convergence region was not presented near the convective region at low levels. Although the strong convergence appeared onshore, it was not located directly upstream of the convective region. The horizontal southwesterly wind pattern at 2 km ASL was also similar to that in period 1.
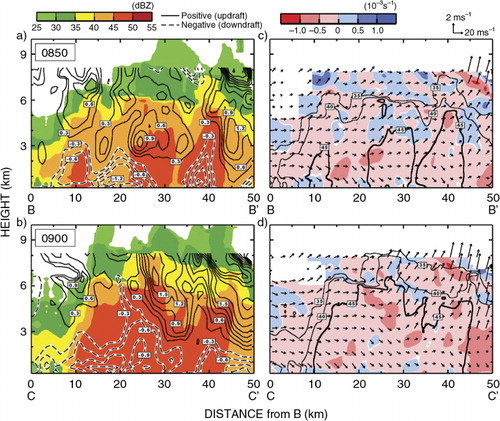
shows an average vertical cross-section along the transect lines (B–B’, C–C’) depicted in a, b. The vertical cross-sections reveal the structure of the offshore convective region in the same way as the A–A’ transect showing the onshore case. In this region, updraft was apparent mainly above 3 km ASL and downdraft was predominant below 3 km ASL. The maximum updraft in the upstream regions was 1.2 m s−1 (a, b), weaker than in the upstream region of period 1 when the convective region developed onshore. The divergence distributions along the B–B’ and C–C’ transect lines (c, d) show mostly negative values (i.e. convergence). In particular, at 0900 LST (d), the C–C’ transect line shows convergence up to approximately 6 km ASL. The strong convergence occurred mostly from 2 to 6 km and was not presented on the windward side of the convective region where it might have driven further convection.
Fig. 12 Same as except for lines B–B’ and C–C’ in a, b.
4.4. Temporal variations in onshore and offshore convection
To clearly reveal the temporal variations in precipitation system at locations with different system structures, the time variations with height of reflectivity, vertical velocity and divergence are presented in for the two 20×20 km area analysis domains, S2 (onshore) and S3 (offshore), defined in . The two domains cover the onshore and offshore convection regions.
Fig. 13 Time–height cross-section of maximum reflectivity, vertical velocity and averaged divergence for each period in the analysis domains. (a), (c) and (e) are on the onshore (S2) and (b), (d) and (f) are on the offshore (S3). The boundaries of the analysis domains are depicted in .
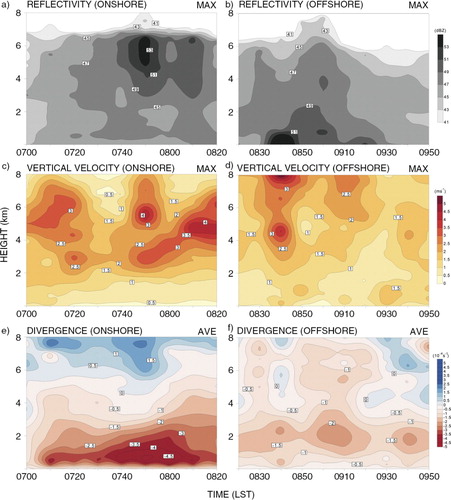
Intense reflectivity (≥49 dBZ) was presented onshore above 3 km ASL (a), higher than that offshore, where it was mostly located below 2 km ASL (b). The overall convective region (≥45 dBZ) was also higher onshore than offshore, as seen in . c, d shows the maximum vertical velocity in each region. Large vertical velocities (≥3 m s−1) occurred mostly between 4 and 6 km ASL in both regions (c, d). The largest onshore vertical velocity was stronger than 4 m s−1 at 4–6 km ASL, whereas the offshore updraft was weaker. Offshore, large vertical velocities (≥3 m s−1) occurred at 0840 LST (d) but rapidly weakened. This difference in updraft values indicates that larger vertical velocity occurred onshore, which can be explained by the strong low-level convergence caused by land friction. The plot of average divergence in e shows clearly the strong onshore low-level convergence. This strong convergence (≤−4×10⁻⁴ s−1) persisted below 1 km during the time period 0740–0810 LST when the convective region developed onshore. In contrast, divergence occurred above 6 km ASL. This vertical divergence distribution in e is distinct from the offshore case shown in f, where the low-level strong convergence is absent and weak convergence (≥−2.2×10⁻⁴ s−1) is found at 1–3 km ASL. In addition, there is deep weak convergence up to 8 km ASL offshore, in contrast to the change from convergence to divergence onshore at 6 km ASL.
5. Discussion
This study describes the environmental conditions and structural features of a precipitation system made up of LSCSs, which occurred around Seoul, Korea on 27 July 2011. In general, line type systems (such as BB-type) are typically formed in unstable conditions caused by a vertical difference in θ e , as shown in Kato (Citation2001, Citation2006). Kato (Citation2001) reported that the atmospheric instability caused by inflows of high θ e at low levels (warm and humid) and low θ e at middle levels (dry) is an important factor for developing a line type system. Dry air is not only a cause of convective instability, but possibly also of buoyancy reduction, since evaporative cooling occurs when warm and humid air mixes with dry air as it is lifted. Indeed, model results (Kato, Citation2006) have shown that dry air at middle levels acts to reduce buoyancy in convective cells. However, Kato (Citation2006) showed that middle-level dry air does not completely suppress the convective cell since the evaporative cooling effect is small, given that the precipitation system is not much colder than the surrounding air. Consequently, the remaining buoyancy is sufficient to drive convection. The present case occurred in unstable conditions with a vertical difference in θ e , and in dry air at middle levels, which affected the LSCSs. The middle-level evaporative cooling around the LSCSs was quite small, as the horizontal temperature gradient was weak (). Thus, middle-level dry air played a significant role in maintaining the instability and did not suppress the LSCSs.
In this situation, new cells were continuously generated at the tip of the band, and the pre-existing cell was nearly stationary, consistent with the BB/quasi-stationary scenario (BB; Schumacher and Johnson, Citation2005). Seko (Citation2010) defined two types of meso-β scale BB systems: BB-type and back and side building (BSB-type), based on differences in wind direction between low and middle levels. In the BB-type, the low- and middle-level winds are parallel, but in the other type (BSB-type) they are perpendicular to each other. The environmental wind directions at low and middle levels at 0600 LST on 27 July were south-southwest and west-southwest. The present case appears to be BSB-type in terms of the directional wind shear at sub-synoptic scale and the propagation direction of the precipitation system, but in fact this case corresponds more closely to the BB-type because of the local change in wind direction at low levels. As shown in b, c, the surface wind changed from south-southwest to west at the AWS stations (Gwanak and Song-do) when the LSCSs occurred. This change of low-level wind direction to west meant that it was parallel with the middle-level wind direction and could be classified as BB-type. However, the present case does not conform completely to the BB-type since the outflow boundary of the pre-existing cell on the windward side was not clear at the surface. Outflow on the cool side is an important factor in explaining the development of a new cell at the upstream region of a pre-existing cell (Fovell and Ogura, Citation1988), but another factor could also be responsible for developing new cells. That is, the low-level convergence associated with the front has been suggested as another factor generating new cells (Schumacher and Johnson, Citation2005; Watanabe, Citation2007; Shinoda et al., Citation2009). The new cells of the present case were little affected by the cold outflow of the pre-existing cell since it is hard to distinguish between outflow and the decrease in surface temperature caused by evaporative cooling, which was less than 2 K when the LSCSs were developed (b). Kato (Citation1998) concluded that the mechanism for generating new cells from a pre-existing cell does not apply in a moist environment as there is no evaporative cooling. For this reason, the outflow induced by the pre-existing cell in the present case does not generate new cells, and the low-level convergence found in synoptic features like troughs ( and ) is the only source of new cells.
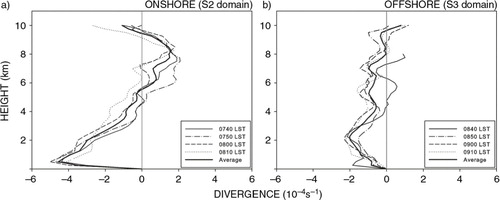
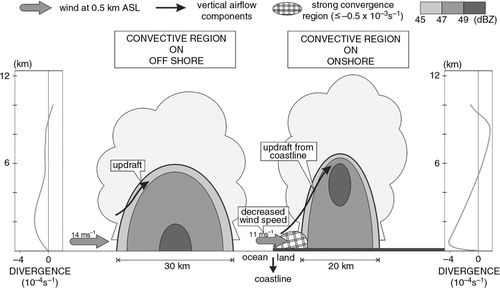
This study also shows that the convective region of LSCSs is different according to the merging position. The pre-existing cell of the present case extended from onshore to offshore (windward) through merging with new cells. Over this period, merging between the pre-existing cell and new cells was mainly responsible for elongating and enhancing the cloud cells. The enhanced convective region within the system had different features depending on whether it was located offshore or onshore, as shown schematically in . When the merging position was close to the coast (period 1), the convective area within the pre-existing cell (C1) rapidly increased onshore and was located at approximately 6.5 km ASL ( and a). However, subsequent to this time, the convective region offshore was lower (approximately 6.0 km ASL) and wider than that in the onshore ( and ). As already mentioned, this difference was caused by the surface roughness. The change in roughness induced an onshore decrease in wind speed, resulting in strong convergence near the coastline, thereby generating stronger updraft at the coastline and forcing the convective region higher. Furthermore, the height of the precipitation core () changed in response to the different convective structure. a shows the mean profile of divergence, with strong convergence at low levels onshore. During period 1 (0740–0810 LST), the strongest convergence occurred at 0.5 km ASL, which indicates that the strong low-level convergence was caused by onshore friction, as the frictional effect is usually important below 1 km ASL. This profile of divergence (a) shows the typical divergence structure found in tropical convective cloud (Mapes and Houze, Citation1993; Houze, Citation1997), except that the strongest convergence level existed in the low layer. However, the offshore case (b) has a different divergence profile. The layer from the surface to 4 km ASL is similar to typical convective cloud, but above 4 km there is a convergence layer up to 8 km ASL (except at 0840 LST). However, the deep convergence does not make the offshore convective region higher than 6 km ASL. These results indicate that the shallow and strong near-surface onshore convergence caused higher and stronger convection.
Fig. 14 Mean profiles of divergence in S2 (onshore) and S3 (offshore) analysis domain at selected times.
6. Summary
We investigated the environmental conditions and internal structure of band-shaped precipitation system using various meteorological data, including 3-D wind structure data, to reveal how the western tip of LSCSs were influenced and enhanced by processes over the coastal region. Estimated wind field data were sufficient to examine features of the LSCSs, given the reasonable airflow patterns within the precipitation system.
At 0600 LST on 27 July 2011, a warm and moist south-southwesterly airflow at low levels and dry middle-level west-southwesterly airflow caused conditions of vertical instability over the Korean Peninsula. The isobaric trough was situated near the Seoul metropolitan area. Thus, the synoptic environment was favourable for the development of line type systems, and a band-shaped precipitation system occurred on 27 July.
The western tip of the band-shaped precipitation system consisting of LSCSs produced heavy rainfall (>80 mm h−1) and biased rainfall distribution onshore. At the western tip of the system, new cells were continuously generated and merged with the pre-existing cell (LSCS), continuously enhancing the precipitation system. The pre-existing cell was quasi-stationary near the Seoul metropolitan area as opposed to the new cells, which moved at 12 m s−1 to the northeast. For this reason, the pre-existing cell could extend westward through merging with new cells, which meant that the location of cell development changed over time.
The LSCSs in the analysis domain (S1) showed temporally varying characteristics for the development of precipitation depending on their location (onshore or offshore), because of the shifting position of merging. The onshore convective region was continuously affected by strong low-level convergence (≤−4×10⁻⁴ s−1; below 1 km) that caused strong updrafts (≥4 m s−1) along the coastline, and this was important in producing a convective region and reflectivity cores located higher than those in the offshore area (). Onshore, the convective area was located at ~6.5 km ASL and the intense reflectivity core (≥49 dBZ) was above 3 km ASL. In contrast, the profile of divergence offshore was relatively weak (≥−2.2×10⁻⁴ s−1) but deeper (up to 8 km ASL), with a weaker updraft (≤3 m s−1). In addition, the convective area was located at ~6.0 km ASL and the intense reflectivity offshore was mostly located below 2 km ASL. The differences in convergence and updraft intensity were induced by the surface type and a subsequence decrease in horizontal wind speed (by ~2 m s−1) at low levels onshore compared with offshore, and these differences between onshore and offshore areas were the direct causes of the different internal structures (e.g. vertical air motion, precipitation core, height and length) of the enhanced LSCSs.
Fig. 15 Schematic representation of convective region in precipitation system at offshore and onshore. Shading region indicates variation in the reflectivity of radar. Thick arrows shaded grey colour and thin black arrows are horizontal wind at 0.5 km ASL and vertical airflow components, respectively.
The results show that enhancement occurs differently in onshore and offshore regions. However, this study did not consider cloud microphysics. There are differences in the internal structure that must result from additional forcing, possibly associated with differences in cloud microphysics and hydrometeor distribution. Therefore, further studies are required considering hydrometeors and microphysics. Furthermore, additional statistical analysis is required to reveal the different structural features more clearly between onshore and offshore.
7. Acknowledgements
This research was supported by the National Research Foundation of Korea (NRF) through a grant provided by the Korean Ministry of Education, Science & Technology (MEST) in 2014 (no. K200603874). This research was partially supported by the Korea Meteorological Administration Research and Development Program under Grant CATER 2012-2071. Partly, this study was also funded by a grant from the National Fisheries Research and Development Institute (RP-2014-ME-001) of Korea.
References
- Bluestein H. B , Jain M. H . Formation of mesoscale lines of precipitation: severe squall lines in Oklahoma during the spring. J. Atmos. Sci. 1985; 42: 1711–1732.
- Cressman G. P . An operational objective analysis system. Mon. Weather Rev. 1959; 87: 367–374.
- Dixon M , Wiener G . TITAN: thunderstorm identification, tracking, analysis, and nowcasting – a radar-based methodology. J. Atmos. Ocean. Technol. 1993; 10: 785–797.
- Fovell R. G , Ogura Y . Numerical simulation of a midlatitude squall line in two dimensions. J. Atmos. Sci. 1988; 45: 3846–3879.
- Gao J , Xue M , Brewster K , Droegemeier K. K . A three-dimensional variational data analysis method with recursive filter for Doppler radars. J. Atmos. Ocean. Technol. 2004; 21: 457–469.
- Gao J , Xue M , Shapiro A , Droegemeier K. K . A variational method for the analysis of three-dimensional wind fields from two Doppler radars. Mon. Weather Rev. 1999; 127: 2128–2142.
- Geng B , Yamada H , Reddy K. K , Uyeda H , Fujiyoshi Y . An observation study of the development of a rainband on a Meiyu front causing heavy rainfall in the downstream region of the Yangtze River. J. Meteorol. Soc. Jpn. 2004; 82(4): 1095–1115.
- Geng B , Yamada H , Reddy K. K , Uyeda H , Fujiyoshi Y . Mesoscale development and along-frontal variation of a Meiyu/Baju front and precipitation observed in the downstream region of the Yangtze River. J. Meteorol. Soc. Jpn. 2009; 87(3): 423–457.
- Ha J.-H , Kim H.-W , Lee D.-K . Observation and numerical simulations with radar and surface data assimilation for heavy rainfall over central Korea. Adv. Atmos. Sci. 2011; 28(3): 573–590.
- Houze Jr., R. A . Stratiform precipitation regions of convection: a meteorological paradox?. Bull. Am. Meteorol. Soc. 1997; 78(10): 2179–2196.
- Ishizuka M , Kodama Y.-M . An observational study on a carrot-shaped cloud system developed to the south of Kyushu Island based on TRMM multi-sensor observations. Tenki. 2001; 48: 673–687. (in Japanese with English abstract).
- Jang S.-M , Lee D.-I , Jeong J.-H , Park S.-H , Shimizu S , co-authors . Radar reflectivity and wind field analysis by using two X-band Doppler radars at Okinawa, Japan from 11 to 12 June 2007. Meteorol. Appl. 2013. 10.1002/met.1427.
- Jeong J.-H , Lee D.-I , Wang C.-C , Jang S.-M , Park S.-H , co-authors . Structure and evolution of line-shaped convective system associated with Changma front during GRL PHONE-09: 6 July 2009 case. Meteorol. Appl. 2013. 10.1002/met.1418.
- Jeong J.-H , Lee D.-I , Wang C.-C , Jang S.-M , You C.-H , co-authors . Environment and morphology of mesoscale convective systems associated with the Changma front during 9–10 July 2007. Ann. Geophys. 2012; 30: 1235–1248.
- Kato T . Numerical simulation of the band-shaped torrential rain observed over southern Kyushu, Japan on 1 August 1993. J. Meteorol. Soc. Jpn. 1998; 76: 97–123.
- Kato T . Structure of the band-shaped precipitation system inducing the heavy rainfall observed over northern Kyushu, Japan on 29 June 1999. J. Meteorol. Soc. Jpn. 2006; 84: 129–153.
- Kato T , Goda H . Formation and maintenance processes of a stationary band-shaped heavy rainfall observed in Niigata on 4 August 1998. J. Meteorol. Soc. Jpn. 2001; 79: 899–924.
- Kim H.-W , Lee D.-K . An observation study of mesoscale convective systems with heavy rainfall over the Korean Peninsula. Weather Forecast. 2006; 21: 125–148.
- Lee D.-K , Lee H.-R , Hong S.-Y . Heavy rainfall over Korea during 1980–1990. Kor. J. Atmos. Soc. 1998; 1: 32–50.
- Liou Y.-C , Chang Y.-J . A variational multiple-Doppler radar three-dimensional wind synthesis method and its impacts on thermodynamic retrieval. Mon. Weather Rev. 2009; 137: 3992–4010.
- Liou Y.-C , Chang S.-F , Sun J . An application of the immersed boundary method for recovering the three-dimensional wind fields over complex terrain using multiple-Doppler radar data. Mon. Weather Rev. 2012a; 140: 1603–1619.
- Liou Y.-C , Chen W. T.-C , Tsai Y.-C , Tang Y.-S , Lin P.-L , co-authors . Structure of precipitating systems over Taiwan's complex terrain during Typhoon Morakot (2009) as revealed by weather radar and rain gauge observations. J. Hydrol. 2012b. DOI: 10.1016/j.jhydrol.2012.09.004.
- Mapes B , Houze Jr., R. A . An integrated view of the 1987 Australian monsoon and its mesoscale convective systems. Part II: vertical structure. Q. J. Roy. Meteorol. Soc. 1993; 119: 733–754.
- Orlanski I . A rational subdivision of scales for atmospheric processes. Bull. Am. Meteorol. Soc. 1975; 56: 527–530.
- Ray P. S , Ziegler C. L , Bumgarner W , Serafin R. J . Single- and multiple-Doppler radar observations of tornadic storms. Mon. Weather Rev. 1980; 108(10): 1607–1625.
- Roeloffzen J. C , Van Den Berg W. D , Oerlemans J . Frictional convergence at coastlines. Tellus A. 1986; 38(5): 397–411.
- Schumacher R. S , Johnson R. H . Organization and environmental properties of extreme-rain producing mesoscale convective systems. Mon. Weather. Rev. 2005; 133: 961–976.
- Schumacher R. S , Johnson R. H . Mesoscale processes contributing to extreme rainfall in a midlatitude warm-season flash flood. Mon. Weather. Rev. 2008; 136: 3964–3986.
- Seko H . Study of the shapes and maintenance mechanisms of meso-β scale line-shaped precipitation systems in the middle-latitudes. J. Meteorol. Res. Jpn. 2010; 62(1–3): 1–74 (In Japanese).
- Seko H , Kato T , Saito K , Yoshizaki M , Kusunoki K , co-authors . Analytical and numerical studies of a Quasi-Stationary precipitation band observed over the Kanto Area associated with Typhoon 9426 (Orchid). J. Meteorol. Soc. Jpn. 1999; 77(4): 929–948.
- Shapiro A , Mewes J. J . New formulation of dual-Doppler wind analysis. J. Atmos. Ocean. Technol. 1999; 16: 782–792.
- Shin C.-S , Lee T.-Y . Development mechanisms for the heavy rainfalls of 6–7 August 2002 over the middle of the Korean Peninsula. J. Meteorol. Soc. Jpn. 2005; 83: 683–709.
- Shinoda T , Amano T , Uyeda H , Tsuboki K , Minda H . Structure of line-shaped convective systems obliquely training to the Baiu front observed around the Southwest Islands of Japan. J. Meteorol. Soc. Jpn. 2009; 87(4): 739–745.
- Sun J , Crook N. A . Dynamical and microphysical retrieval from Doppler radar observations using a cloud model and its adjoint. Part I: model development and simulated data experiments. J. Atmos. Sci. 1997; 54: 1642–1661.
- Sun J , Lee T.-Y . A numerical study of an intense quasi-stationary convection band over the Korean Peninsula. J. Meteorol. Soc. Jpn. 2002; 80: 1221–1245.
- Watanabe H . Structure of a stationary line-shaped heavy rainfall system in Fukui (18 July 2004) simulated by the JMA nonhydrostatic model. Tenki. 2007; 54: 449–455. (In Japanese).
- You C. H , Lee D.-I , Jang S.-M , Jang M , Uyeda H , co-authors . Characteristics of rainfall systems accompanied with Changma front at Chujado in Korea, Asia-Pacific. J. Atmos. Sci. 2010; 46: 41–51.