
Abstract
The impact of dense saltwater inflows on the phosphorus dynamics in the Baltic Sea is studied from tracer experiments with a three-dimensional physical model. Model simulations showed that the coasts of the North West Gotland Basin and the Gulf of Finland, the Estonian coast in the East Gotland Basin are regions where tracers from below the halocline are primarily lifted up above the halocline. After 1 yr tracers are accumulated at the surface along the Swedish east coast and at the western and southern sides of Gotland. Elevated concentrations are also found east and southeast of Gotland, in the northern Bornholm Basin and in the central parts of the East Gotland Basin. The annual supplies of phosphorus from the deeper waters to the productive surface layers are estimated to be of the same order of magnitude as the waterborne inputs of phosphorus to the entire Baltic Sea. The model results suggest that regionally the impact of these nutrients may be quite large, and the largest regional increases in surface concentrations are found after large inflows. However, the overall direct impact of major Baltic inflows on the annual uplift of nutrients from below the halocline to the surface waters is small because vertical transports are comparably large also during periods without major inflows. Our model results suggest that phosphorus released from the sediments between 60 and 100 m depth in the East Gotland Basin contributes to the eutrophication, especially in the coastal regions of the eastern Baltic Proper.
1. Introduction
The Baltic Sea is a semi-enclosed, brackish and shallow sea with a mean depth of 54 m and a limited water exchange with the open ocean (e.g. Leppäranta and Myrberg, Citation2009) (). The atmospheric forcing causes a large variability in motions and physical processes in the shallow Baltic Sea (e.g. Leppäranta and Myrberg, Citation2009). The freshwater supply from rivers causes large salinity gradients between the northern sub-basins and the entrance area and between the well-mixed brackish surface layer and the saltier bottom layer. Generally only intermittent major Baltic inflows with denser surface waters from Kattegat ventilate and oxygenate the deepest parts (Fischer and Matthäus, Citation1996). Oxygen deficiency is therefore a frequent problem that also influences eutrophication by the redox dependent phosphorus (P) fluxes from the sediments (Conley et al., Citation2009). This causes a large variability of P concentrations in the deeper parts of the Baltic Sea (cf. ). In fact, the large scale variations of the pools of inorganic P caused by the intermittent major Baltic inflows may be up to two orders of magnitude larger than the variations in the external P input (e.g. Savchuk, Citation2010).
Fig. 1 Maps showing the RCO model bathymetry and nine standard monitoring stations (left, a) and the division of the model domain into Baltic Sea sub-basins (right, b). The bottom area at 60–99 m depth in the East Gotland Basin (black colour) used for the experiment with emulated sediment release of tracers (Btm tracer) is shown in the right panel. The model domain has an open boundary in the northern part of the Kattegat. Sub-basin abbreviations: Entrance area (ENT, including the Kattegat, the Danish sounds and the Arkona Basin), Bornholm Basin (BH), East Gotland Basin (GO), North-West Gotland Basin (NW), Gulf of Riga (GR), Gulf of Finland (GF) and the Gulf of Bothnia (BOT, including the Åland Sea, the Archipelago Sea, the Bothnian Sea and the Bothnian Bay). The volumes of the sub-basins are presented in The Baltic Proper includes the NW, GO, BH and the Arkona Basin.
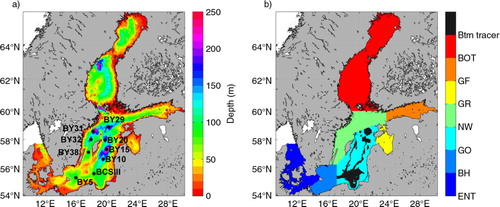
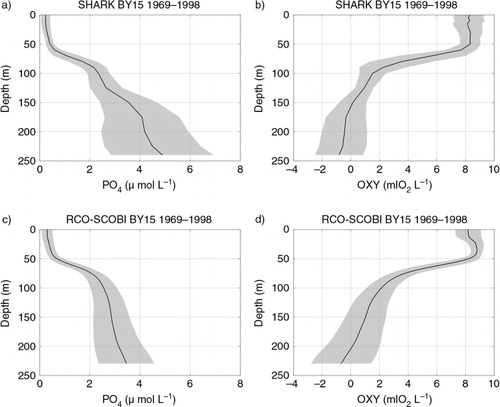
Fig. 2 Mean profiles and ±1 standard deviation (grey shaded area) from GO (station BY15) in the period 1968–1998 of phosphate (µmol PO4 L−1) and oxygen (ml O2 L−1) in left and right panels, respectively. Observations (from the Swedish Oceanographic Data Centre (SHARK) at the Swedish Meteorological and Hydrological Institute, http://www.smhi.se) are shown in the upper panels (a and b) and the corresponding RCO-SCOBI results are shown in the lower panels (c and d).
Measurements of nutrients and oxygen in the Baltic Sea have been done for more than 100 yr with regular monitoring starting in the 1950s, though the earliest nutrient measurements from the beginning of the last century are regarded as unreliable (e.g. Fonselius and Valderrama, Citation2003; Feistel et al., Citation2008). The central part of the Eastern Gotland Basin () which have the longest historical data records, is often used as a representative area for studies of the basic physical and biogeochemical dynamics in the Baltic Sea (e.g. Nausch et al., Citation2003; Stigebrandt and Gustafsson, Citation2007; Reissmann et al., Citation2009; Schneider, Citation2011). Schneider (Citation2011) studied the changes in the mean phosphate (PO4) and total inorganic carbon (CT) below 150 m depth in the East Gotland Deep (BY15, see ) after the major Baltic inflow in 2003. He observed a drop of PO4 from 4.9 µmol L−1 to 3.0 µmol L−1 (39%) within 6 weeks after the inflow and a further drop to a minimum of 2.0 µmol L−1 (60%) within 1 yr. The CT concentrations that are not redox sensitive dropped similarly to PO4 due to dilution during the initial weeks (Schneider, Citation2011). Because of on-going organic matter mineralisation, CT concentrations started to increase again already in the autumn when the water exchange slowed down. The release of PO4 from the sediment was, however, according to Schneider (Citation2011) most likely very small after the inflow when the water turned from anoxic to oxic. A possible explanation for this is that the PO4 can bind to hydrated metal oxides (e.g. Fe) in the Baltic Sea sediments as discussed, e.g. by Mort et al. (Citation2010) and Schneider (Citation2011).
P is a major nutrient that often limits productivity in the Baltic Sea and the sinking of P bound in organic matter mainly causes its downward transport. High-resolution model simulations have been used to study the transports and the sedimentation-resuspension dynamics of organic P (Almroth Rosell et al., Citation2011) as well as of the fate of river-borne P in the Baltic Sea (Radtke et al., Citation2012). Eilola et al. (Citation2012) studied the horizontal transport patterns and the net exchange of P between the open sea and the regions shallower than 30 m depth in present climate as well as in climate-change scenarios. An overview of the present knowledge about mechanisms driving the physical dynamics and mixing processes of the inflowing waters and the vertical transports of salt and nutrients to the surface layers is given in the review by Reissmann et al. (Citation2009), but all details of the processes are still not fully understood. One example is the passive vertical transports of dissolved P from the deep waters to the surface layers, which needs further attention as pointed out by Reissmann et al. (Citation2009).
The aim of the present paper is to perform high-resolution model experiments to simulate the renewal of the East Gotland Deep water and to follow the fate of the accumulated pools of P in the Baltic deep water. Previously Meier (Citation2007) calculated the pathways and ages of various water masses in the Baltic Sea with the ocean circulation model RCO (Rossby Centre Ocean model) which is also used in the present study. For the surface layers, he found that mean ages associated to inflowing saline water from Kattegat ranged from about 26 yr in the south to 42 yr in the most northern Baltic Sea. Meier (Citation2007) used the age tracing concept described by Delhez et al. (Citation1999, Citation2004) and Deleersnijder et al. (Citation2001). Radtke et al. (Citation2012) combined the age concept with a source attribution technique to describe pathways and time scales between the input of nutrients to the Baltic Sea and their arrival in different sub-basins and the residence times of the nutrients in the ecosystem. They studied especially the discharges of the Oder, Vistula and Daugava rivers and found that after an average time of 1.4 yr, 95% of riverine nitrogen was lost by denitrification in sediments. The residence time of riverine phosphorus exceeded the simulated period of 35 yr. These tracer techniques can be used to trace nutrients for long periods through the food web at the cost of additional state variables and copies of the equations involved in the biogeochemical cycles. A similar concept was used by Almroth-Rosell et al. (Citation2011) to follow the transports of resuspended organic matter in the Baltic Sea.
We will investigate the impacts of modelled inflows occurring during the period 1961–2009, when the stagnant deep water usually became anoxic and rich in phosphate before the next deep water renewal took place (e.g. Stigebrandt and Gustafsson, Citation2007), and use passive tracer experiments to examine the role of water masses from different regions () and different depth layers. This tracer study aims to investigate if there are specific regions where the deep water usually is lifted above the halocline, and also, if there are regions where we might expect a possible addition to the spring primary production from the excess phosphorus annually lifted up from the layers below the halocline. The relative importance of inflows on the average uplift of tracers will be quantified from a set of years having stronger and weaker inflows respectively, compared to years with no inflows. The results from the present model study may support the planning of future field studies of vertical transports and mixing as well as the model developments in the Baltic Sea.
The paper is organised as follows. In Section 2, the model setup and details about the tracer methods are presented. The results of the modelled tracer dynamics are discussed in Section 3 and compared to the in-situ tracer experiment in 2007–2009 by Holtermann et al. (Citation2012) and the data analysis of the inflow in 2003 by Schneider (Citation2011). Finally the horizontal and vertical dispersion of the tracers are discussed and some concluding remarks are given.
2. Methods
2.1. Overview
The RCO (e.g. Meier et al., Citation2003; Meier, Citation2007), is coupled to the Swedish Coastal and Ocean Biogeochemical model (SCOBI) (e.g. Eilola et al., Citation2009; Almroth Rosell et al., Citation2011) that has been used in several applications for the Baltic Sea (e.g. Eilola et al., Citation2012; Meier et al., Citation2012). The coupled model system has shown good performance compared to other Baltic Sea models and observations (Eilola et al., Citation2011) and the 30-yr (1969–1998) means and standard deviations of phosphate and oxygen are shown in comparison to the observations from the central Eastern Gotland Basin in . One may note that the main features of the stratification and variability are satisfactory reproduced though the position of the halocline is slightly too high in the water column as seen from the modelled stratification. The performance of the present model version and the dynamics of the halocline and its impact on hypoxia in the Baltic Sea are further discussed in detail by Väli et al. (Citation2013).
The coupled model RCO-SCOBI is also used in the present study but the biogeochemical processing is not active and the SCOBI variables are used as passive tracers instead.
2.2. Coupled ice-ocean model
RCO is a Bryan-Cox-Semtner primitive equation circulation model with a free surface (Killworth et al., Citation1991) and open boundary conditions (Stevens, Citation1991) in the northern Kattegat (). It is coupled to a Hibler-type sea ice model (Hibler, Citation1979) with elastic-viscous-plastic rheology (Hunke and Dukowicz, Citation1997) and explicit representation of five undeformed and two deformed sea ice categories (Mårtensson et al., Citation2012). In the ocean model a flux-corrected, monotonicity preserving transport (FCT) scheme following Gerdes et al. (Citation1991) is embedded to avoid overshooting of tracer concentration at large gradients due to numerical dispersion. Subgrid-scale mixing is parameterised using a turbulence closure scheme of the k-ɛ type with flux boundary conditions to include the effect of a turbulence enhanced layer due to breaking surface gravity waves and a parameterisation for breaking internal waves (Meier, Citation2001). The deep water mixing is assumed to be inversely proportional to the Brunt-Väisälä frequency with a proportionality factor α=1×10⁻⁷ m2 s−2 following Lass et al. (Citation2003). As the layer thicknesses of the vertical grid are too large to resolve the bottom boundary layer (BBL) accurately, a BBL model is embedded to allow the direct communication between bottom boxes of the step-like topography (Beckmann and Döscher, Citation1997). The BBL model helps to improve the simulation of gravity-driven dense bottom flows (Meier et al., Citation2004). In this study RCO is used with a horizontal resolution of 3.7 km (2 nautical miles) and with 83 vertical levels with layer thicknesses of 3 m. In the model the maximum depth amounts to 249 m. For further details of the RCO model and the performance of relevant model variables compared to observations, the reader is referred to Meier (Citation2001), Meier et al. (Citation2003), Meier (Citation2007) and Väli et al. (Citation2013).
2.3. Regional climate data sets
The forcing of the ocean model for the period 1850–2009 is calculated from reconstructed atmospheric surface fields (Schenk and Zorita, Citation2012). The high-resolution daily fields are homogeneous and physically consistent by making use of both long-term records of European historical station data since 1850, and simulated atmospheric fields from a regional coupled atmosphere–ocean model over Northern Europe in the period 1958–2009, driven by re-analysis data at the lateral boundaries (Samuelsson et al., Citation2011). In this study, we focus on simulation results since 1960.
2.4. Tracer
The present study is based on experiments using passive tracers that follow the pathways of different water masses. This is also valid for the description of phosphorus transports from the deeper parts to the surface of the Baltic Sea as will be further discussed in Section 3.2.1. However, from this approach it is not possible to draw conclusions about the impact of biogeochemical processes on the uplifted phosphorus in the euphotic zone. Hence, source attribution and age following techniques needed for that task is out of the scope of the present study and will be addressed with the SCOBI model in future work.
Basically two main approaches are used in the present study. The first approach investigates the dispersion and the replacement of deep water tracers below 150 m depth in the East Gotland Basin and the second approach investigates the dispersion of tracers from below the halocline. The second approach is motivated by the fact that during recent times the oxygen-poor and phosphate-rich waters have reached high up in the water column and occupy thereby large volumes of the Baltic Proper (e.g. Reissmann et al., Citation2009; Hansson et al., Citation2013). The potential impact in the surface layers of uplifted tracers from below the halocline at about 70 m depth in the East Gotland Basin and the North-West Gotland Basin are therefore tracked by the tracer concentrations at 30 m depth 1 yr after the initiation. We will also track the fluxes to the upper 30 m, which correspond to the depth of the shallow areas discussed by Eilola et al. (Citation2012). The tracer concentration at 60 m depth is evaluated after 6 months, in order to obtain a picture of the source regions just above the halocline layer.
The model was run continuously from 1960 to 2009 and the tracer was restarted with new fields of initialisation at some selected dates during the run. The initiation years (1960, 1964, 1969, 1975, 1979, 1992, 1997, 2002 and 2007) for tracers in the longer experiments were selected to cover periods having major inflows according to Table 10.2 in Feistel et al. (Citation2008). In these experiments, we follow the evolution of tracers during several years after initiation, until the next date when the initiation is reset again.
The inter-annual variability of tracer dynamics are evaluated from similar experiments but with tracers reset and initiated on January 1 every year. In these experiments the tracers are therefore followed during 1 yr after the initiation. A negligible fraction of the tracer leaves the Baltic Sea during the first year (0.06%) and still after 3 yr in the longer experiments on average only 2.5% of the tracer mass has been exported to the Skagerrak.
To clarify the impact of deep water inflows on the uplift of tracers, the annual experiments are divided into three cases representing average conditions during periods with no deep water inflows (1963, 1971, 1985, 1986, 1989, 1990, 2001, 2006), weaker inflows (1967, 1968, 1973, 1978, 1981, 1987, 2004, 2007) and stronger inflows (1969, 1970, 1977, 1980, 1993, 1994, 1997, 2003). The aim was to have a clear as possible separation without overlaps between the characteristics in the three cases (see Section 3.2).
For the investigation of the importance of different water masses on the East Gotland Deep water renewal we used 17 tracers to mark the water masses from the Eastern Gotland Basin (GO), the North-West Gotland Basin (NW), the Gulf of Bothnia (BOT), the Gulf of Finland (GOF), the Bornholm Basin (BH), and the entrance area (ENT) (). The initial concentration of the tracers was set to 1.0. The tracers from the GO and the NW were divided into five layers according to the vertical grid resolution of the model; 0–69 m (GO5 and NW5), 69–99 m (GO1 and NW1), 99–123 m (GO2 and NW2), 123–150 m (GO3 and NW3) and finally below 150 m depth (GO4 and NW4). According to the average vertical oxygen distribution (b) the selected ranges from deeper waters correspond approximately to the layers in the halocline and just below the halocline, in the redoxcline layer and in anoxic bottom waters. The volume of the water masses below the halocline containing tracers () occupies about 30% of the total volume in the GO and NW volume (). The initial tracer mass is distributed fairly similar between the two basins, about 57% of the tracer mass in the GO and 43% in the NW basin. The tracers in the BH were divided into layers 0–51 m (BH4), 51–60 m (BH1), 60–69 m (BH2) and below 69 m (BH3). An additional tracer was used to emulate nutrient release from sediments at 60–99 m depth in GO (Btm tracer, see ). In this case the tracer concentration was set to 1.0 when the water was in contact with the sediment in the selected areas.
Table 1. The total volume and the surface layer volume (0–30 m) of the Baltic Sea sub-basins (in km3)
3. Results and discussion
3.1. Tracer dynamics after major Baltic inflows
3.1.1. Renewal of Gotland Deep water.
During an inflow event the deep water is replaced and the old water is lifted up to the overlying layers as seen, e.g. after the inflow in 2003 (Reissmann et al., Citation2009). In this case the oxygen poor and phosphate rich waters were lifted from 100 m depth to about 70 m depth. The effect is seen from the tracer GO4 (a) which is lifted up and diluted by the intruding new water masses and spread through the halocline towards the surface layers after an inflow. A noteworthy result is the low surface-layer tracer concentration (a), less than about 0.5% of the initial concentration, caused by the dispersed Gotland Deep water. This is due to the small volume below 150 m depth in GO that causes the tracer concentration to reduce by almost a factor of 100 when the tracer mass is dispersed to the entire volume of NW and GO (). The tracer in the Gotland Deep is after 2 yr generally replaced by more than 50% by new water masses (c) and only 10 to 20% of the initial tracer remains after about 1 yr in the strongest inflow cases. In the more modest inflow cases there are still more than 50% of the initial tracer mass left in the Gotland Deep 1 yr after the initiation. The 2 yr time periods following the tracer initiations may, however, show several occasions with inflows of new deep water and especially the major events in 1977, 1993 and 2003 show large declines in tracer mass. This effect is exemplified in c by an arrow indicating the start of the inflow in 2003. The average tracer composition in the Gotland Deep water 2 yr after the initialisation (d) consists of about 15% tracer mass from BH (90% from below 51 m), 10% from the entrance area, 9% from the NW, 4% from unmarked waters entering from the open boundary, rivers and the GR, and about 1% comes from the BOT and the GF. The largest contribution (about 61%) comes from GO, mainly from GO4 (19%) and GO1 (16%) and less from GO2 (9%), GO3 (9%) and GO5 (8%), respectively. In a natural situation, the concentrations in the deep water after inflows would largely depend on the blend of the actual nutrient and oxygen concentrations in these waters, but also on the release of nutrients and the oxygen consumption by on-going mineralisation and decomposition of organic matter. In a later stage of the temporal development in the longer experiments one may also notice an increasing influence from tracers in the NW and the BOT as well as from the undefined waters.
Fig. 3 Time series of vertical profiles of tracer GO4 at BY15 (upper left panel, a). Note the sharp gradient of colour scale used to separate the very low concentrations in panels a and b. The horizontal distribution (at 60 m depth and in the bottom layer) of the mean GO4 tracer concentration for all inflow cases 2 yr after the initiation dates is shown (in% of the initial concentration) (upper right panel, (b). The decline after inflows of the GO4 tracer mass below 150 m depth is summarised in the lower left panel (c). The initiation date (see legend in c) was in each new tracer case defined by the first day when a water mass originating from BH was observed in the Gotland Deep. The arrow indicates the start of the large deep water inflow in 2003 depicted more than 1 yr after the tracer initiation in 2002. The lower right panel (d) shows temporal changes of the relative contributions from different water masses to the tracer mass in the Gotland Deep below 150 m (see explanation of legend abbreviations in methods). The tracer mass is shown relative to the initial tracer mass (i.e. at each initiation occasion GO4 is equal to 100%). White colour indicates the influence from undefined waters without tracers.
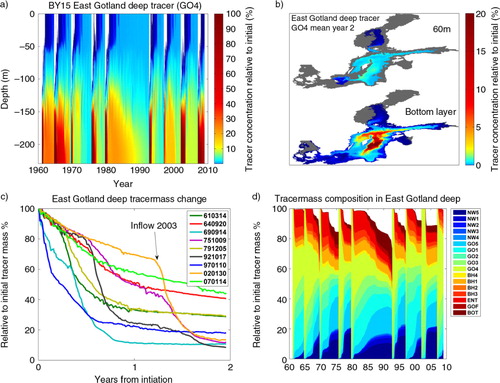
Table 2. The volume (km3) of the sub layers with tracer initialisation
3.1.2. Dispersion of the East Gotland deep water tracer.
Time scales of lateral homogenisation of tracers are short compared to the water residence time in the Baltic. The tracer release experiment by Holtermann et al. (Citation2012) showed that the lateral dispersion of deep water occurs on time scales of a few months. The model results from the present study show that most of the spreading of the East Gotland deep water tracer takes place along the bottom layers of the Baltic and that significant concentrations (5–10% of the initial concentrations) of the tracer may be found to the north and the west of the island Gotland 2 yr after the tracer initiations (b). These dispersion results are in accordance with the findings from the tracer release experiment described by Holtermann et al. (Citation2012). Small tracer amounts emanating from the Gotland Deep may, however, also be found in the Gulf of Finland and the Gulf of Bothnia. The difference in the general dispersion pattern between weak and strong inflows is small but the concentrations differ since more tracers are removed from the deep water and transported to the northern Gotland Basin during the stronger inflows.
3.1.3. Comparing tracer and phosphate concentration changes in 2003.
It is not straightforward to compare the changes in tracer concentrations directly with surface layer PO4 concentrations since the latter depend on the seasonal biogeochemical cycles in the surface layers as well as on the horizontal and vertical gradients that have been built up during several years. However, as an example, in a we show the accumulation at 30 m depth of the tracers emanating from below 69 m depth in NW and GO. The tracer was initiated in January 2002 and the accumulation is calculated for the second year, i.e. year 2003 when a major inflow occurred. In this case the tracer has during the first year already built up some large-scale gradients also in the upper parts of the Baltic Sea. The observed changes therefore include both a fraction of the remaining tracers directly lifted up from below 69 m depth, as well as an addition of tracers from the previous year that are already available above the halocline in the beginning of 2003.
Fig. 4 The left panel shows the horizontal distribution of concentrations at 30 m depth of the tracers accumulated between the end of January 2003 and end of January 2004 (a). The sum of all GO and NW tracers initiated below 69 m are shown in% relative to the initial tracer concentration. The right panel shows the horizontal distribution at 30 m depth of the BH tracer concentration in the end of December (b). The mean for a sub set of years with stronger inflows is shown.
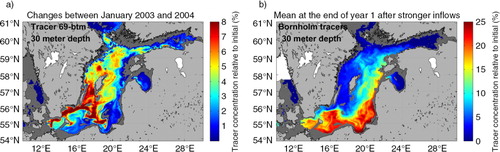
The results show an accumulation of tracer in NW and the areas surrounding the island Gotland, especially to the west and south. One may note that the increase in the northern and western parts correlates to areas where we observe increases of PO4 concentrations () while the observations at the southern and eastern stations show unchanged or decreasing PO4 concentrations. These stations are more affected by the inflows of surface waters with lower PO4 concentrations from the entrance areas than by the uplifted lower layer water masses. The effect of inflows is illustrated by the average spreading pattern at 30 m depth of modelled Bornholm tracers 1 yr after the stronger inflows have taken place (b). The results show that BH tracers are flushed towards the east and occupy the southern and eastern parts of the Eastern Gotland Basin.
Table 3. Observed PO4 concentrations (µmol L−1) at 30 m depth in January 2003 and 2004
3.2. Annual tracer dynamics
3.2.1. The deep water renewal in 2003.
The timing of the 2003 inflow was well reproduced by the model as seen from the intrusion of BH tracer mass below 150 m depth in the East Gotland Basin (). The good correspondence with the observed salinity changes at 200 m depth in the central East Gotland Basin 2003 indicates that the temporal development of this inflow is also well simulated. According to the model experiment (), about 85% of the tracer mass was removed by the dilution effect during the first year after the 2003 inflow. Schneider (Citation2011), however, estimated that only 2/3 of the PO4 removal was due to dilution while the rest was suggested to be a consequence of the precipitation of iron(III)-hydroxo-phosphates (Fe–P) at the sediment surface under oxic conditions.
Fig. 5 The relative changes of salinity (observations from 200 m depth at station BY 15, SHARK data) and of the modelled inflow of BH tracer mass (51 m–btm) below 150 m depth in GO. The salinity change is shown relative to the situation just before the inflow while the tracer concentration (that is zero at start) is shown relative to the final concentration in order to make the results comparable.
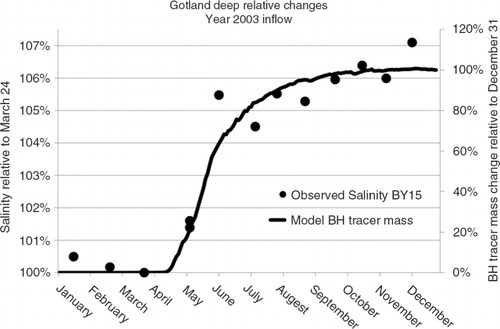
Table 4. The relative contributions (RTV) from tracers found below 150 m in the East Gotland Deep at the end of 2003 and the mean PO4 concentration of the inflowing waters estimated from SHARK observations (column 2, rows 1–6)
The drop in PO4 concentration during 2003 was estimated in the present study from the model results combined with observations of PO4. The weighted mean PO4 concentration of the different water masses contributing to the East Gotland Deep water at the end of 2003 is 2.11 µmol L−1 (). The results agree well with the observed drop in mean PO4 concentrations from 6.29 µmol PO4 L−1 in January 2003 to 2.10 µmol PO4 L−1 in January 2004. The mean uptake of PO4 from the water column to hydrated metal oxides at the sediment surface is relatively small according to the analysis of sediment phosphorus fluxes in the model experiments by Almroth-Rosell et al. (Citation2014). Hence, it is most likely that the drop in PO4 observed by Schneider (Citation2011) is explained by dilution effects from the inflow and the increased mixing efficiency following the energy input from the inflow. The precipitation of PO4 from the water column to the sediment surface is therefore less than suggested by Schneider (Citation2011) and the possible precipitation of PO4 to hydrated metal oxides in the water column is also of minor importance in accordance with the discussions by Schneider (Citation2011). The tracer studies in the present paper may therefore be regarded as good representations of the possible pathways of PO4 from the deeper parts to the surface layers of the Baltic Sea.
3.2.2. Inter-annual variability of the deep water renewal.
The deep water is subjected to stagnant periods, as in the 1980s when on average about 43% of the tracer mass is removed each year, and high-inflow years, like 1969 when up to 90% of the tracer mass is removed in the model experiment (). Stronger inflows show an annual mean tracer removal of more than 70%. Reissmann et al. (Citation2009) suggested that the longer residence time of the deep water during stagnation periods results from the lack of energy imported by the inflows to the vertical mixing processes. The largest tracer decrease in the model experiments generally takes place during the month directly following the tracer initiation (not shown). A sensitivity experiment with a reset of tracer concentrations on July 1 every year shows that the changes during the first month are slightly larger on average if the experiment starts in January (−24% per month) compared to a start in July (−17% per month). The corresponding changes during the last months of the annual experiments show an average change of −3% and −7% per month in December and June, respectively. There are some differences between certain years in the annual changes of the two experiments (not shown) depending on the timing of inflows and the fact that we study changes between winters in one case and summers in the other case, but the general results are similar. The rapid change of tracer mass in the beginning of the experiments is generally explained by quick erosion of the upper layers, which occupies most of the volume of the deep basin.
Fig. 6 Annual changes (relative to the initial value reset on January 1 every year) of tracer mass (GO4) in Gotland Deep (large solid dots). The dotted circle indicates the Baltic Sea tracer experiment period in 2007–2009 by Holtermann et al. (Citation2012). The colour inlets show W–E transects (~E19.6°–E20.4°) in the central GO (~N57.3°) of the tracer concentration profiles (150 m–btm) at the end of December in the years 2000, 2003, 2006 and 2007.
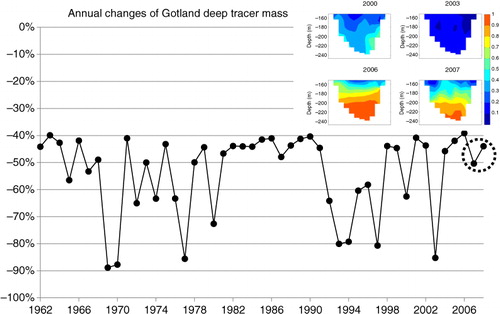
In case of stronger inflows the tracer mass may be replaced all the way to the deepest parts. This is exemplified by the tracer transects at the end of four different years (colour inlets in ) of the experiment restarted in January. The monthly changes occasionally also show oscillations when the tracer mass is increased because the tracer is flushed back again to the GO deep water. This can be noticed when the remaining deep water tracer mass becomes low and the relative impact from recirculated tracers becomes larger. Hagen and Feistel (Citation2004) measured during 1999–2002 the currents 20 m above the seafloor at about 200 m depth in the northeast part of the East Gotland Basin. They found a permanent northward current velocity of 3 cm/s and hourly along-slope fluctuations with peak values of −18 cm/s to +40 cm/s. The large-scale oscillations are forced, e.g. by inflow dynamics caused by varying sea level in Kattegat and atmospheric cyclones travelling across the Baltic Sea. The hydrodynamics behind the oscillations and the interactions between barotropic and baroclinic mechanisms are discussed more in detail by, e.g. Reissmann et al. (Citation2009) and by Hagen and Feistel (Citation2004).
3.2.3. Comparison with the in-situ tracer release experiment period 2007–2009.
The tracer release experiment by Holtermann et al. (Citation2012) was performed in the years 2007–2009 when our model, in accordance with the in-situ data, indicates a relatively modest inflow period. This can be noticed both in the annual () and the long term tracer experiments (c). At the end of 2008 the new tracer mass emanates mainly from the upstream basins and from the surface layers of the NW and GO (d). Only one third of the new tracer mass in the GO deep water comes from the depth range 69–150 m inside the GO. It is therefore possible that the modest inflow may have influenced the Holtermann et al. (Citation2012) tracer mass experiment by advective processes. The 45–50% average removal rate of tracer mass in 2007–2008 () also indicates that more energy might have been available for the dispersion of tracer mass during their tracer experimental period than during more stagnant periods as in 2006 or in the 1980s.
3.3. Horizontal and vertical fluxes of tracers
3.3.1. Dispersion of tracers from below the halocline.
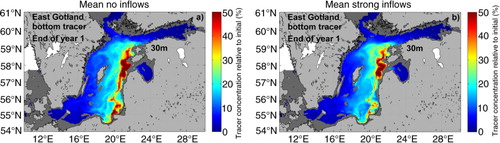
The results show that the coasts of NW, and GF, and in case of inflows also the Estonian coast in GO, are regions where we after 6 months at 60 m depth find tracers lifted up from below the halocline (, left column). Under situations with poor oxygen conditions below the halocline in the Baltic Proper these bottom areas may therefore potentially be affected by an advection of poisonous anoxic and phosphate rich waters from the deeper parts. A common signature of all annual cases in (right column) is a focus of tracers along the Swedish east coast and at the western and southern sides of Gotland. Differences between the cases are in general mainly explained by increased concentrations when inflows occur, with the largest impact obtained in the stronger inflow cases. The highest tracer concentrations are found along the rim of the NW basin indicating the influence from bottom topography on the rate of vertical tracer spreading which was also pointed out by Holtermann et al. (Citation2012). The results differ partly from those presented by Meier (Citation2007) because he marked inflowing water with a salinity larger than 17 in the Arkona Basin instead of old deep water that is lifted up by the inflowing water as in this study. On average during the 24 yr period studied by Meier (Citation2007), the locations with upward fluxes across the halocline of the heavier water were scattered. In agreement with the present study, however, relatively large upward fluxes were found in the Northern Basin north of Gotland island and at the western coast of Gotland.
Fig. 7 The horizontal distribution of the mean tracer concentration at 60 m depth in end of June (left column) and at 30 m depth in the end of December (right column) from periods with no deep water inflows (upper panels, a and b), weaker inflows (middle panels, c and d) and with stronger inflows (lower panels, e and f). Note different scales of colour bars. The sum of all GO and NW tracers initiated below 69 m are shown.
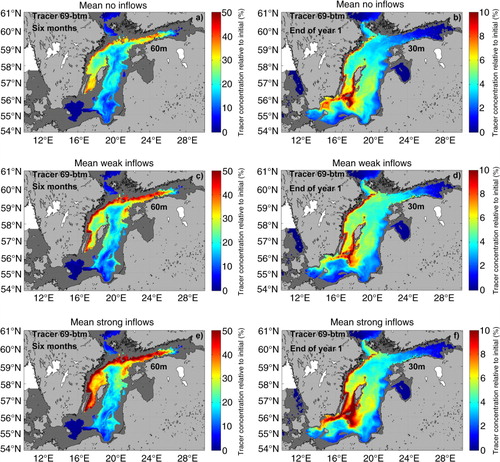
In this study, elevated concentrations are also found east and south east of Gotland, in the northern Bornholm Basin and in the central parts of the GO Basin. These results may be explained by the southward transports of nutrients along the Swedish coast that continues to the south and to the west along the Swedish coast, into the Bornholm Basin and further into the Arkona Basin (Eilola et al. Citation2012). Another branch of the southward transport joins the cyclonic circulation in the central Baltic Proper. In total, about 9% of all initial tracers mass below 69 m in the GO and NW is found in the upper 30 m of the total Baltic Sea (TB) 1 yr after the stronger inflows (). This number is about 15% higher than in the case with no inflows while the tracer content in the NW is up to 29% higher in the cases with inflows (). The uplifted amount of NW tracer is about 20% larger during the stronger inflow cases with a 40% increased contribution in the North-West Gotland Basin compared to the cases with no inflows.
Fig. 8 The mean integrated amount of tracer from all GO and NW tracers initiated below 69 m (in% of the total initial mass) accumulated in the upper 30 m of the entire Baltic Sea (TB) and the sub-basins 1 yr after the initiation dates (end of December) in years with strong, weak or no inflow cases.
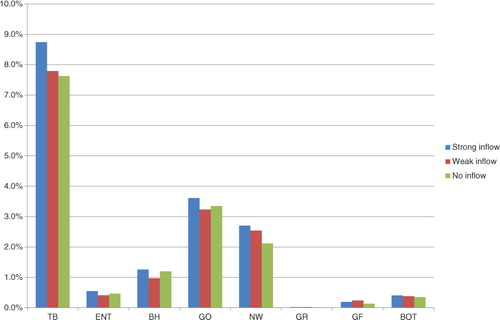
Table 5. The mean integrated amount of tracer (in% of the total initial mass) accumulated in the upper 30 m of the total Baltic Sea (TB) and the sub-basins 1 yr after the initiation dates (end of December) in years with strong, weak or no inflow cases (cf. )
If we assume an average concentration below the halocline of about 3.0 µmol PO4 L−1, similar to 2003, an annual amount of about 29×103 and 25×103 tons of PO4 will be added to the surface layers in the strong inflow cases and cases with no inflows, respectively. Hence, the annual supplies of P from the deep parts directly to the productive surface layers are of the same order of magnitude as the waterborne inputs of P to the entire Baltic Sea (HELCOM, Citation2011). Regionally the impact may be quite large (). Concentrations from 10% up to about 25%, corresponding to 0.3–0.75 µmol PO4 L−1, may be found at 30 m depth in the coastal regions between the Swedish mainland and Gotland. Concentration increases of up to 10% (corresponding to 0.3 µmol PO4 L−1) between the cases with no inflows and cases with strong inflows may locally be found (not shown) in the same regions with a focus southwest of Gotland island. Using the numbers from and 5 together with the 0–30 m volume of the NW and GO basins (4417 km3) an average concentration in the surface layer of North-West and East Gotland basins of about 0.13–0.15 µmol PO4 L−1 is calculated. The additional supply of PO4 from strong inflows therefore gives only a minor average absolute PO4 increase (0.02 µmol PO4 L−1) compared to the cases with no inflows. The overall direct impact of major Baltic inflows on the uplift of nutrients from the deepest layers to the surface waters is small because the processes causing vertical transports are comparably large also in the cases with no major inflows as will be further discussed in Section 3.3.3.
3.3.2. Dispersion of the bottom tracer.
The potential impact of uplifted bottom tracer emulating phosphorus release from sediments at 60 to 99 m depth in GO (see ) on surface layer concentrations, is studied by the tracer concentrations observed at 30 m depth. These sediments correspond to the areas where Eilola et al. (Citation2012) found the largest exports of phosphate in their model experiments. The detailed analysis of sediment fluxes by Almroth-Rosell et al. (Citation2014) showed that this export is caused by large phosphorus release from areas with anoxic sediments that may be found between 60 and 150 m depth in the model. An important feature of these bottom tracers () is the accumulation at the eastern coasts of the GO basin. Due to the high vertical dispersion along the Baltic Sea bottoms, a considerable fraction of the phosphorus released from the sediments below the halocline may reach the surface layer and contribute to eutrophication especially in the coastal regions of the eastern Baltic Proper. Both the amounts of bottom tracers in the upper 30 m in the GO basin and its total amount in TB are reduced in the cases of inflows (). After strong inflows there is a weakening of the tracer concentrations in the south eastern parts of the Baltic Proper which was also noticed from the integrated tracer mass in . The reason of these reductions is partly due to the intrusion of water from the Bornholm Basin that flushes the eastern parts of the Baltic Proper (b) and hampers the uplift of bottom tracers.
Fig. 9 The horizontal distribution at 30 m depth of the mean bottom tracer concentration (emulating phosphorus released from sediments at 60–99 m depth in GO see ) in the end of December from periods with no deep water inflows (left, a) and with stronger inflows (right, b). The tracer concentration is shown relative to the constant bottom concentration set at the sediment interface. No larger differences were seen between the cases with no or only weak inflows (not shown).
3.3.3. Transport processes.
In this section possible mechanisms that may cause the observed regional differences in the modelled uplift of tracers from the deeper layers of the Baltic Proper are discussed. The layers below the halocline are regularly ventilated by inflows from the entrance area as illustrated by concentration differences along the East Gotland transect of the tracer from below 51 m depth in the Bornholm Basin (a and b). Actually, it has been shown that major parts of the regular inflows are interleaved in or below the halocline layer with maximum transports at about 100 m depth (e.g. Stigebrandt, Citation1987; Meier and Kauker, Citation2003). Hence, the energy supplied to the dilution of tracers at about 150 m depth (discussed in Section 3.2.2) is most likely generated by these inflows. Earlier Reissman et al. (2009) pointed out that horizontal advection of saline water below the halocline is a dominating process for temporal changes and associated transports in the central Baltic Sea. A variety of possible processes such as near bottom currents, breaking internal waves and eddies causing turbulent vertical mixing through the halocline in the Baltic Sea were also discussed by Reissman et al. (2009). The importance of coastal upwelling was mentioned but the lack of large-scale quantifications limited the understanding about its importance.
Fig. 10 West-to-east transects at the end of December in the years 2003 (left) and 2006 (right). The upper panels (a and b) show the Bornholm tracer (from below 51 m) concentrations between Gotland and Latvia at about N57.3° (in% of the initial concentration). The lower panels (c and d) show the tracer (from below 69 m) concentrations between Sweden and Estonia at about N58.8° (in% of the initial concentration). The black dots shown at surface level depict the position studied in
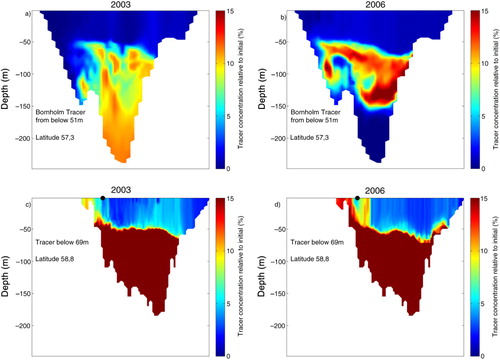
The relatively small differences in total uplifted tracers between years with strong inflows compared to years with no inflows (Section 3.3.1) point to the importance of a large, not inflow related source of energy, most likely from the wind forcing upwelling, vertical mixing and the most frequent inflows that ventilate the halocline layer. The west-to-east transects in the end of 2003 and 2006 (c and d) show clearly examples on how the tracer from below the halocline is ascending towards the surface at the Swedish coast. The results are similar for both years even though there was a major inflow in 2003. There is an average south-westerly wind in the northern Baltic Proper (N58.8°), similar between the years 2003 and 2006 (wind direction 8–30°, wind speed about 2 m s−1). This wind causes an Ekman transport towards east and southeast at the ocean surface. As a consequence upwelling of water along the western boundary is found. The effect is exemplified by data at one grid point () describing the first occasions with observed rapid increase of tracer concentrations closer to the surface at the Swedish coast of the section N58.8° (c and d). One may note that the upper depth level with 15% tracer concentration was uplifted by more than 20 m during 6 d with dominating south and westerly winds. This has a large impact on the dispersion of tracers since the uplifted tracers become more exposed to the intense mixing taking place at the surface especially during winter time. A possible reason for the preferential uplift of tracers along the Swedish coasts is therefore the frequent occasions with upwelling that are forced by the predominant south-westerly winds in the Baltic Sea (Myrberg and Andrejev, Citation2003). Gidhagen (Citation1987) noted that at the Swedish coast, upwelling may occur from depths of 20–40 m and cover areas up to 100 km along the coast and spreading 5–20 km into the sea. Correspondingly, at the coasts along the eastern Gotland Basin downwelling may occur due to eastward wind-driven transports (e.g. Kowalewski and Ostrowski, Citation2005). Downwelling may slow down the annual mean uplift of tracers. This explains why, in combination with the spreading of tracer-free water from the Bornholm Basin along the eastern parts of the Baltic Proper (b), the uplift of tracers is less intense in this region ().
Table 6. Changes of the upper level (H) of the 15% concentration of the bottom tracer below 69 m.
Our results indicate that the impact from wind stress is an important factor, but a comprehensive investigation about the possible mechanisms causing the observed model results is out of the scope of the present paper. Coastal upwelling is a common feature in the entire Baltic Sea and there is a need for research about its causes and impacts on the transport of nutrients and harmful substances as discussed by Lehmann and Myrberg (Citation2008). The role of upwelling is usually studied from temperature variations during the summer while there is less information available regarding upwelling during winter because the surface layer is homogenised due to storms and convection. Future work might therefore include detailed studies of how intense and deep reaching and how frequent up- and downwelling is along the western and eastern coasts in the model. The work may follow, e.g. the modelling concept of Kowalewski and Ostrowski (Citation2005) and include also ground truth information from in-situ experiments and remote sensing products.
4. Conclusions
4.1. The deep water renewal
The study of the renewal of the East Gotland Deep water below 150 m depth showed that, on average, 2 yr after the inflows almost 50% of the tracer mass in the deep East Gotland Basin came from tracer enriched water in the Bornholm Basin and the East Gotland Basin below the halocline (from depths less than 150 m). About 30% originated from well oxygenated surface waters and the rest 20% was remaining old GO deep water.
4.2. Uplift of tracers above the halocline
We found that the coasts of the North West Gotland Basin and the Gulf of Finland, and in case of inflows also the Estonian coast in the East Gotland Basin, are regions where tracers from below the halocline are primarily lifted up above the halocline.
4.3. Uplift of tracers to the surface layer
After 1 yr, tracers are accumulated at the surface along the Swedish east coast and at the western and southern sides of Gotland. Elevated concentrations are also found east and southeast of Gotland, in the northern Bornholm Basin and in the central parts of the East Gotland Basin.
The model results indicate that the uplift of tracers along the Swedish coasts is likely caused by upwelling forced by south-westerly winds, but further studies are needed to clarify details of these processes.
4.4. Impact on eutrophication
The annual supplies of phosphorus from the layers below the halocline directly to the productive surface layers are estimated to be of the same order of magnitude as the waterborne inputs of phosphorus to the entire Baltic Sea. The model results suggest that regionally the impact may be quite large but more sophisticated tracer experiments similar to Delhez et al. (Citation2004) and Radtke et al. (Citation2012) are needed to follow the nutrient tracers through the processes of biogeochemical cycling.
The overall direct impact of major Baltic inflows on the annual uplift of nutrients from below the halocline to the surface waters is small because the processes causing vertical transports are comparably large also in the cases with no major inflows.
The impact from the East Gotland Deep water on eutrophication in the Baltic Sea is expected to be small because the volume below 150 m is small.
4.5. Bottom tracer and sediment release
Because of the high dispersion along the bottom in the Baltic, much of the phosphorus released from the sediments between 60 and 100 m depth in the East Gotland Basin may contribute to eutrophication especially in the coastal regions of the eastern Baltic Proper.
5. Acknowledgements
The research presented in this study is part of the Baltic Earth programme (Earth System Science for the Baltic Sea region, see http://www.baltex-research.eu/balticearth) and was funded by the Swedish Research Council for Environment, Agricultural Sciences and Spatial Planning (FORMAS) within the projects ‘Impact of accelerated future global mean sea level rise on the phosphorus cycle in the Baltic Sea’ (grant no. 214-2009-577) and ‘Impact of changing climate on circulation and biogeochemical cycles of the integrated North Sea and Baltic Sea system’ (grant no. 214-2010-1575). Additional support came from Stockholm University's Strategic Marine Environmental Research Funds ‘Baltic Ecosystem Adaptive Management (BEAM)’ and from the Norden Top-level Research Initiative sub-programme ‘Effect Studies and Adaptation to Climate Change’ through the ‘Nordic Centre for Research on Marine Ecosystems and Resources under Climate Change (NorMER)’. In its final phase the research leading to these results received also funding from BONUS, the joint Baltic Sea research and development programme (Art 185), funded jointly from the European Union's Seventh Programme for research, technological development and demonstration and from FORMAS (grant no. 219-2013-2041).
The RCO model simulations were performed on the climate computing resources ‘Ekman’ and ‘Vagn’ jointly operated by the Centre for High Performance Computing (PDC) at the Royal Institute of Technology (KTH) in Stockholm and the National Supercomputer Centre (NSC) at Linköping University. ‘Ekman’ and ‘Vagn’ are funded by a grant from the Knut and Alice Wallenberg foundation.
We would like to acknowledge two anonymous reviewers for their constructive comments.
References
- Almroth-Rosell E. , Eilola K. , Hordoir R. , Meier H. E. M. , Hall P . Transport of fresh and resuspended particulate organic material in the Baltic Sea – a model study. J. Mar. Syst. 2011; 87: 1–12.
- Almroth-Rosell E. , Eilola K. , Kuznetsov I. , Hall P. O. J. , Meier M . The Baltic Sea sediment oxygen conditions and phosphorus dynamics – a 3D model study. J. Mar. Syst. 2014. Submitted.
- Beckmann A. , Döscher R . A method for improved representation of dense water spreading over topography in geopotential-coordinate models. J. Phys. Oceanogr. 1997; 27: 581–591.
- Conley D. J. , Björck S. , Bonsdorff E. , Carstensen J. , Destouni G. , co-authors . Hypoxia-related processes in the Baltic Sea. Environ. Sci. Technol. 2009; 43(10): 3412–3420.
- Deleersnijder E. , Campin J.-M. , Delhez E. J. M . The concept of age in marine modelling: I. Theory and preliminary results. J. Mar. Syst. 2001; 28: 229–267.
- Delhez É. J. , Lacroix G. , Deleersnijder E . The age as a diagnostic of the dynamics of marine ecosystem models. Ocean Dynam. 2004; 54(2): 221–231.
- Delhez E. J. M. , Campin J.-M. , Hirst A. C. , Deleersnijder E . Toward a general theory of the age in ocean modelling. Ocean Model. 1999; 1: 17–27.
- Eilola K. , Almroth-Rosell E. , Dieterich C. , Fransner F. , Höglund A. , co-authors . Modeling nutrient transports and exchanges of nutrients between shallow regions and the open Baltic Sea in present and future climate. Ambio. 2012; 41(6): 574–585.
- Eilola K. , Gustafson B. G. , Kuznetsov I. , Meier H. E. M. , Neumann T. , co-authors . Evaluation of biogeochemical cycles in an ensemble of three state-of-the-art numerical models of the Baltic Sea. J. Mar. Syst. 2011; 88: 267–284.
- Eilola K. , Meier H. E. M. , Almroth E . On the dynamics of oxygen, phosphorus and cyanobacteria in the Baltic Sea; a model study. J. Mar. Syst. 2009; 75: 163–184.
- Feistel R , Nausch G. , Wasmund N . State and Evaluation of the Baltic Sea, 1952–2005. A Detailed 50-Year Survey of Meteorology and Climate, Physics, Chemistry, biology, and Marine Environment. 2008; Hoboken, NJ, USA.: John Wiley & Sons.
- Fischer H. , Matthaus W . The importance of the Drogden Sill in the Sound for major Baltic inflows. J. Mar. Syst. 1996; 9: 137–157.
- Fonselius S. , Valderrama J . One hundred years of hydrographic measurements in the Baltic Sea. J. Sea Res. 2003; 49: 229–241.
- Gerdes R. , Köberle C. , Willebrand J . The influence of numerical advection schemes on the results of ocean general circulation models. Clim. Dynam. 1991; 5: 211–226.
- Gidhagen L . Coastal upwelling in the Baltic Sea – satellite and in situ measurements of sea surface temperatures indicating coastal upwelling. Estuar. Coast. Shelf Sci. 1987; 24: 449–462.
- Hagen E. , Feistel R . Observations of low-frequency current fluctuations in deep water of the Eastern Gotland Basin/Baltic Sea. J. Geophys. Res. 2004; 109: C03044.
- Hansson M. , Andersson L. , Axe P. , Szaron J . Oxygen survey in the Baltic Sea 2012, Extent of anoxia and hypoxia 1960–2012. Report Oceanography 46.
- HELCOM. The Fifth Baltic Sea Pollution Load Compilation (PLC-5) Balt. Baltic Sea Environment Proceedings. No. 128. Helsinki Commission, Finland . 2011; 217 pp..
- Hibler W. D . A dynamic thermodynamic sea ice model. J. Phys. Oceanogr. 1979; 9: 817–846.
- Holtermann P. L. , Umlauf L. , Tanhua T. , Schmale O. , Rehder G. , co-authors . The Baltic Sea tracer release experiment: 1. Mixing rates. J. Geophys. Res. 2012; 117: 01021.
- Hunke E. C. , Dukowicz J. K . An elastic viscous plastic model for sea ice dynamics. J. Phys. Oceanogr. 1997; 27: 1849–1867.
- Killworth P. , Stainforth D. , Webb D. , Paterson S . The development of a free-surface BryaneCoxeSemtner ocean model. J. Phys. Oceanogr. 1991; 21: 1333–1348.
- Kowalewski M. , Ostrowski M . Coastal up- and downwelling in the Southern Baltic. Oceanologia. 2005; 47: 453–475.
- Lass H.-U. , Prandke H. , Liljebladh B . Dissipation in the Baltic proper during winter stratification. J. Geophys. Res. 2003; 108(C6): 3187.
- Lehmann A. , Myrberg K . Upwelling in the Baltic Sea – a review. J. Mar. Syst. 2008; 74: S3–S12.
- Leppäranta M. , Myrberg K . Physical Oceanography of the Baltic Sea. 2009; Chichester, UK: Praxis Publishing. ISBN: 978-3-540-79702-9.
- Mårtensson S. , Meier H. E. M. , Pemberton P. , Haapala J . Ridged sea ice characteristics in the Arctic from a coupled multicategory sea ice model. J. Geophys. Res. 2012; 117: 00D15.
- Meier H. E. M . On the parameterization of mixing in three-dimensional Baltic Sea models. J. Geophys. Res. 2001; 106: 30997–31016.
- Meier H. E. M . Modeling the pathways and ages of inflowing salt- and freshwater in the Baltic Sea. Estuar. Coast. Shelf Sci. 2007; 74: 610–627.
- Meier H. E. M. , Andersson H. C. , Dieterich C. , Eilola K. , Gustafsson B. G. , co-authors . Modeling the combined impact of changing climate and changing socio-economic development on the Baltic Sea environment in an ensemble of transient simulations for 1961–2099. Clim. Dynam. 2012; 39: 2421–2441.
- Meier H. E. M. , Döscher R. , Broman B. , Piechura J . The major Baltic inflow in January 2003 and preconditioning by smaller inflows in summer/autumn 2002: a model study. Oceanologia. 2004; 46: 557–579.
- Meier H. E. M. , Döscher R. , Faxen T . A multiprocessor coupled ice-ocean model for the Baltic Sea: application to salt inflow. J. Geophys. Res. 2003; 108: 3273.
- Meier H. E. M. , Kauker F . Modeling decadal variability of the Baltic Sea: 2. Role of freshwater inflow and large-scale atmospheric circulation for salinity. J. Geophys. Res. 2003; 108: C11. 3368.
- Mort H. P. , Slomp C. P. , Gustafsson B. G. , Andersen T. J . Phosphorus recycling and burial in Baltic Sea sediments with contrasting redox conditions. Geochim. Cosmochim. Acta. 2010; 74: 1350–62.
- Myrberg K. , Andrejev O . Main upwelling regions in the Baltic Sea – a statistical analysis based on three-dimensional modelling. Boreal Environ. Res. 2003; 8: 97–112.
- Nausch G. , Matthaus W. , Feistel R . Hydrographic and hydrochemical conditions in the Gotland Deep area between 1992 and 2003. Oceanologia. 2003; 45(4): 557–569.
- Radtke H. , Neumann T. , Voss M. , Fennel W . Modeling pathways of riverine nitrogen and phosphorus in the Baltic Sea. J. Geophys. Res. Oceans (1978–2012). 2012; 117(C9): C09024.
- Reissmann J. H. , Burchard H. , Feistel R. , Hagen E. , Lass H. U. , co-authors . Vertical mixing in the Baltic Sea and consequences for eutrophication–a review. Progr Oceanogr. 2009; 82(1): 47–80.
- Samuelsson P. , Jones C. G. , Willén U. , Ullerstig A. , Gollvik S. , co-authors . The Rossby Centre Regional Climate model RCA3: model description and performance. Tellus A. 2011; 63: 4–23.
- Savchuk O. P . Yakushev E . Large-scale dynamics of hypoxia in the Baltic Sea. Chemical Structure of Pelagic Redox Interfaces: Observation and Modelling. The Handbook of Environmental Chemistry. 2010; Berlin: Springer-Verlag. 137–160.
- Schenk F. , Zorita E . Reconstruction of high resolution atmospheric fields for Northern Europe using analog-upscaling. Clim. Past Discuss. 2012; 8: 819–868.
- Schneider B . PO4 release at the sediment surface under anoxic conditions: a contribution to the eutrophication of the Baltic Sea?. Oceanologia. 2011; 53(1–TI): 415–529.
- Stevens D. P . The open boundary condition in the United Kingdom Fine-resolution Antarctic Model. J. Phys. Oceanogr. 1991; 21: 1494–1499.
- Stigebrandt A . A model of the vertical circulation of the Baltic deep water. J. Phys. Oceanogr. 1987; 17: 1772–1785.
- Stigebrandt A. , Gustafsson B. G . Improvement of Baltic proper water quality using large-scale ecological engineering. Ambio. 2007; 36: 280–286.
- Väli G. , Meier H. E. M. , Elken J . Simulated halocline variability in the Baltic Sea and its impact on hypoxia during 1961–2007. J. Geophys. Res. Oceans. 2013; 118: 6982–7000.