
Abstract
Coastal upwelling, with a strong sea-surface temperature (SST) signal, is extremely common in the Baltic Sea during the summer months. Although the spatial scale of upwelling is small, its high frequency of occurrence in the semi-enclosed basin may allow the SST signature to have significant feedback onto the lower atmosphere. In this paper, we develop a method to remove the signature of upwelling from SST fields, and use these modified SST fields as the lower boundary condition of an atmospheric model, allowing us to evaluate the importance of coastal upwelling to the mean summer conditions over the Baltic. The contribution of upwelling is found to be small generally, although significant locally over areas where upwelling is most common. This includes 2 m air temperature reductions of up to 2°C, wind speed reductions of up to 0.25 m s−1, and reductions in the mean boundary-layer height of up to 100 m. High-resolution simulations with artificially enhanced upwelling suggest that upwelling may become increasingly important as winds slacken at the end of an upwelling period.
1. Introduction
Coastal upwelling occurs as winds blow parallel to a coastline, and the resulting Ekman spiral causes a net transport in the Ekman layer directed perpendicularly away from the coastline. In the absence of strong surface convergence parallel to the shore, the only way for this fluid to be replaced is through the uplift of fluid from depth close to the coastline. In stratified conditions, a wind impulse of around 4000–9000 kg m−1s−1 is required for upwelling to be observed at the surface, with up to 14 000 kg m−1s−1 required under weakly stratified conditions (Haapala, Citation1994). The Baltic Sea is a semi-enclosed basin with extensive coastlines oriented in many directions, meaning that upwelling can occur with a sustained wind over the Baltic Sea in almost any direction. Bychkova et al. (Citation1988) highlighted 22 areas, covering the majority of the Baltic coastline, where upwelling may be observed to occur. Upwelling at these areas was linked to 11 different synoptic conditions, covering many of the typical atmospheric conditions observed over the Baltic.
Coastal upwelling is a mesoscale phenomenon, scaling with the internal Rossby radius (Lehmann and Myrberg, Citation2008). The Rossby radius is strongly dependent on the local stratification, and given the large seasonal cycle of mixed-layer depth in the Baltic Sea, has a range generally between 2 and 10 km (Fennel et al., Citation1991; Alenius et al., Citation2003). The offshore extent of upwelling in the Baltic is typically 10–20 km with longshore extents of around 100 km (Gidhagen, Citation1987; Bychkova et al., Citation1988), with the latter limited by the extent of upwelling-favourable winds, coastal orientation, or through counter-propagating Kelvin waves, generated through the strong wind impulse required for upwelling or abrupt changes in coastal orientation (e.g. Fennel and Seifert, Citation1995). Vertical motions associated with upwelling are typically between 10−5 and 10−4 m s−1 (between approximately 1 and 10 m per day), leading to sea-surface temperature (SST) changes of around 1–5°C per day, dependent on the local stratification (Hela, Citation1976). In suitable conditions, this can lead to extremely large SST changes of up to 10°C over only a day or two, causing potentially significant changes to the local heat budget and stability (Lehmann et al., Citation2012).
As well as being of importance to SST patterns and internal stratification, upwelling plays an important role in biological processes in the Baltic Sea, as nutrient-rich waters from below the mixed-layer replace depleted waters in the euphotic zone, often allowing for the formation of blooms (Vahtera et al., Citation2005; Lips and Lips, Citation2008; Zhurbas et al., Citation2008). In addition, upwelling may also be an important factor in the overall carbon budget of the Baltic Sea, where net carbon fluxes may change sign both between basins and seasonally (Omstedt et al., Citation2009; Wesslander et al., Citation2010; Kulinski and Pempkowiak, Citation2012; Löffler et al., Citation2012; Norman et al., Citation2013a, Citation2013b). Currently, the extent to which the Baltic Sea is a net source or sink of carbon in the mean remains unclear.
Numerous studies of the frequency of upwelling in the Baltic have been undertaken, using at first in-situ data, followed by more comprehensive studies using SST measurements from spaceborne radiometers (Horstmann, Citation1983; Gidhagen, Citation1987; Siegel et al., Citation1994; Kahru et al., Citation1995; Kowalewski and Ostrowski, Citation2005; Uiboupin and Laanemets, Citation2009; Lehmann et al., Citation2012). More recently, numerical models have been widely used as resolution has increased sufficiently for coastal upwelling to be adequately resolved (Myrberg and Andrejev, Citation2003; Kowalewski and Ostrowski, Citation2005; Lehmann et al., Citation2012). A good review of upwelling in the Baltic is provided by Lehmann and Myrberg (Citation2008). The overriding finding of these studies is that upwelling is extremely common in certain areas of the Baltic, with upwelling frequencies of up to 25% reported off the southern Swedish coast in a 20 yr upwelling climatology by Lehmann et al. (Citation2012). Other areas with frequent upwelling include the western coast of the Bothnian Bay, south west of Gotland, the northern coast of the Gulf of Finland, where upwelling was observed to occur up to 15% of the time. In times of upwelling-favourable conditions, Uiboupin and Laanemets (Citation2009) reported that up to 40% of the Gulf of Finland may be modified by recently upwelled water.
Elliott and O'Brien (Citation1977) performed an observational study of the marine boundary layer over an upwelling region off the Oregon Coast. They noted that horizontal gradients in the ambient air temperature reflected those of the sea surface, but only in the lower 150 m of the atmosphere. Rouault et al. (Citation2000) studied the atmospheric boundary layer over the area where the warm Agulhas Current often meets cold upwelled water. If the wind had a component across this sea-surface temperature (SST) front, the development of an internal boundary layer was observed, whose stability was dependent on whether the flow was from warm-to-cold or vice-versa. A formation of a well-defined internal boundary layer was also observed over upwelling areas in coupled numerical experiments (Perlin et al., Citation2007). Bane et al. (Citation2005) described an oceanographic observational field campaign which took place from May through August 2001 off the coast of Oregon. During southward winds (generally associated with coastal upwelling), it was noted that the marine boundary layer was typically defined by a strong temperature inversion and a shallow internal boundary layer over the cool upwelled water, with a 2 m air temperature typically at least 1°C colder over the upwelling area. Perlin et al. (Citation2011) studied the atmospheric circulation around an idealised cape during wind driven upwelling, finding that the presence of cold upwelled water beyond the cape had a significant impact on the wind stress-SST coupling, particularly on the diurnal scale. Zemba and Friehe (Citation1987) noted the presence of a jet shaped wind profile in the marine boundary layer during the Coastal Ocean Dynamics experiment. This was partly explained by a thermal wind induced by the large SST gradient associated with coastal upwelling.
Given the high frequency of upwelling in the Baltic Sea and the large coastline-to-surface area ratio, which allows a relatively large area of the sea to be modified by upwelling, questions are raised concerning the ability of upwelling to modify the atmospheric boundary layer over the Baltic basin. These questions, however, have yet to be addressed. In this paper, we offer an initial investigation of the question by developing a method to automatically remove signatures of upwelling from modelled SST fields, before using these fields, as well as the original unmodified SSTs as the lower boundary condition in a series of atmospheric model runs covering the Baltic Sea region. The paper is structured as follows. In the following section, we describe the experimental methodology, the models used, and the way these interact, and the method by which we detect and remove the signature of upwelling. In Section 3, we describe the initial results from simulations of the entire Baltic region and for a specific case study around the island of Gotland. Section 4 includes a brief discussion of these results, and a summary and conclusions are provided in Section 5. For reference, a map of the Baltic Sea region, with relevant areas highlighted, is shown in .
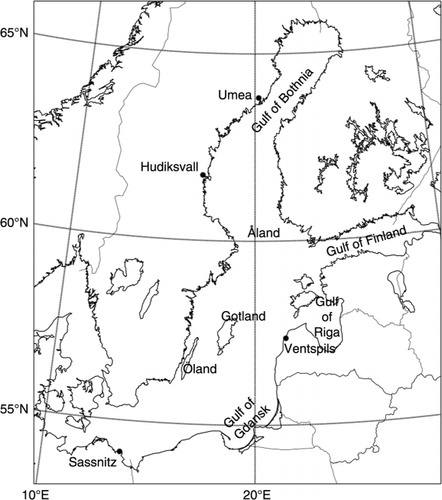
Fig. 1 A map of the Baltic Sea region highlighting areas referred to in this study.
2. Methodology
The approach we use is a series of ‘perturbation’ and ‘control’ experiments, where all fields other than upwelling-related SSTs are held constant between runs. The atmospheric and ocean models are run in an uncoupled mode, with the atmosphere first being run with a low resolution SST from the ERA-Interim reanalysis, and the resultant surface fields used to force a regional ocean model of the Baltic Sea. The SSTs from the ocean model run are then modified offline to either remove or enhance the signature of coastal upwelling, before being incorporated back into the atmospheric model as a surface boundary condition. It should be noted that when feedbacks are introduced through offline coupling, as here, any non-linear air–sea feedback effects (Perlin et al., Citation2007) will not be simulated. For example, the presence of upwelling can cause a sea-breeze like circulation to be superimposed on the synoptic flow, potentially weakening the alongshore component of the wind field (e.g. Ribeiro et al., Citation2011). However, such effects should be of second order importance for the current study.
2.1. Models
2.1.1. WRF-ARW.
The atmospheric model used in this study is version 3.5 of the Weather Research and Forecasting (WRF) model, using the Advanced Research WRF (ARW) dynamical core. The WRF model is used here for two purposes: firstly to dynamically downscale the European Centre for Medium-Range Weather Forecasting (ECMWF) ERA-Interim reanalysis (Dee et al., Citation2011) to a resolution more suitable to forcing a regional Ocean General Circulation Model (OGCM) in a semi-enclosed basin such as the Baltic Sea, and secondly to model the feedback on the atmosphere of the coastal upwelling simulated in the OGCM.
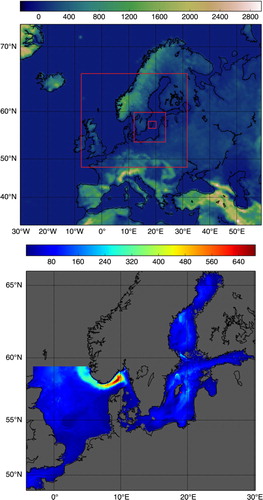
In the first case, two WRF domains are used. The first covers the North-East Atlantic Ocean, the Mediterranean and Europe with a spatial resolution of 30 km, with 50 Eta-levels unevenly spaced in the vertical, generally 12 of which are logarithmically spaced in the lower 2000 m of the atmosphere. An inner domain, covering the Baltic Sea and North Sea, with a horizontal resolution of 10 km is included as a two-way nest within the outer domain ().
Fig. 2 (a) WRF domains and (b) NEMO domain. The outer WRF domain has a horizontal resolution of 30 km, and each nest has a grid refinement factor of 3. NEMO has a horizontal resolution of 2 nm. Topography (WRF, metres) and bathymetry (NEMO, metres) are shaded.
In the second case, the same outer domain is used. However, the 10-km domain is restricted to just covering the Baltic Sea, to avoid having to blend the SSTs from the regional ocean model with another SST product outside the domain of the ocean model. For the high-resolution case study, a further two nests are used. The first, with a spatial resolution of 3.3 km covers the central Baltic Sea region, with the innermost nest, with a spatial resolution of 1.1 km, covering only Gotland and the surrounding waters. All of the inner domains in this case are one-way nests (i.e. with no feedback from finer to coarser resolution nests) to ensure that the boundary conditions for the inner domains are the same for upwelling and no-upwelling simulations.
For all of the simulations, WRF uses the WRF single-moment three-phase microphysics scheme, with the Eta similarity surface-layer scheme, Mellor–Yamada–Janjic planetary boundary-layer scheme and the Noah land surface scheme. In the outermost two domains, the Kain–Fritsch cumulus parameterisation is used; however, this is turned off in the two higher resolution nests. In all cases, parameterisations and physics schemes use model default values, resulting in a typical and easily reproducible model setup. When using WRF for generating atmospheric forcing for the ocean model, the simulation was carried out as a series of 5 d integrations, with overlapping 12-hour spinup periods, ensuring that the forcing fields did not drift too far from the ERA-Interim reanalysis. Furthermore, the outermost domain was nudged back towards the ERA-Interim solutions. A similar strategy was used when looking at the effect of coastal upwelling, but no nudging was used in these simulations. A sensitivity test in the latter case suggested that the length of the integrations was not of great importance, with mean anomaly fields from a month long continuous showing little difference to the mean anomalies from the shorter integrations.
2.1.2. NEMO-BALTIX.
NEMO-BALTIX is a regional implementation of the Nucleus for European Modelling of the Ocean (NEMO) ocean model, covering the North Sea and Baltic Sea, developed at the Swedish Meteorological & Hydrological Institute (SMHI). BALTIX has a spatial resolution of 2 nm (≈3.7 km) and 56 levels in the vertical, with layer thicknesses ranging from 1.5 m at the surface to around 150 m in the lowest model levels. Open boundaries are located between Cornwall (UK) and Brittany (France) and North Scotland (UK) and Norway (). Monthly mean temperature, salinity, velocities and surface elevation are prescribed on the boundaries, with 11 tidal harmonics superimposed. Flather boundary conditions , where U
e
and η
e
are the externally prescribed velocity and sea-surface height, c the external wave speed and h the fluid depth are also used, to allow surface gravity waves to radiate out of the domain. A timestep of 360 seconds is used for momentum and tracers, with a 6-second timestep for surface gravity waves. The model is started from rest and spun up for a year, before the final integration of a further year. Surface forcing fields (2 m temperature & specific humidity, 10 m winds, precipitation and long- and shortwave radiation) are taken from the WRF runs described in Section 2.1.1 at 3 hourly frequency and interpolated offline onto the BALTIX grid.
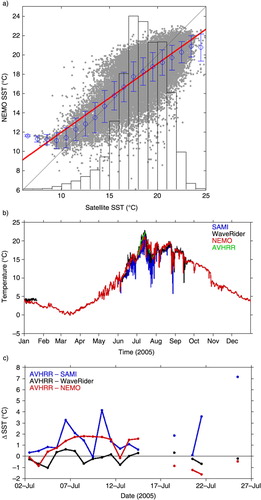
BALTIX, with WRF downscaled ERA-INTERIM forcing is, in general, able to reproduce observed SSTs well (). a shows a comparison between Advanced Very High Resolution Radiometer (AVHRR)-derived SSTs and BALTIX SSTs, with BALTIX SSTs bilinearly interpolated onto a grid matching the satellite data. The correlation coefficient between the two is 0.76, significant at the 99% level, with a slope of 0.71. At the upper end of the observed temperature range, simulated SSTs are slightly cooler than the satellite SSTs, typically by around 1°C, while at the lower end of observed temperatures, the model is significantly overestimating SSTs, although there are only a very limited number of observations below around 15°C. The latter effect is probably due to the model missing some small scale upwelling events present in the satellite data. SSTs at Östergarnsholm (57.62°N, 18.99°E) compare well with observations provided by a SAMI sensor 1 km south-east of Östergarnsholm at 4 m depth and a Datawell Directional Waverider buoy about 4 km south-east of Östergarnsholm at 0.5 m depth (b). See Rutgersson et al. (Citation2008) for a map of the Östergarnsholm field site. The model reproduces the seasonal cycle of SST well, with the onset and extent of observed upwelling periods also well reproduced, although the temperature depression during upwelling tends to be slightly larger in the models than the observations.
Fig. 3 (a) A point-wise comparison of simulated and satellite sea-surface temperature for July 2005 over the Baltic Sea. The red line shows the linear fit and the blue bars show 1°C bin averages with standard deviation. Black bars show the normalised distribution of satellite SST. (b) A timeseries of SST at the Östergarnsholm observation site, for 2005, showing NEMO (red), waverider (black), SAMI (blue) and AVHRR (green) SSTs, where available. (c) The difference between remotely sensed and in-situ/modelled data, where all are available.
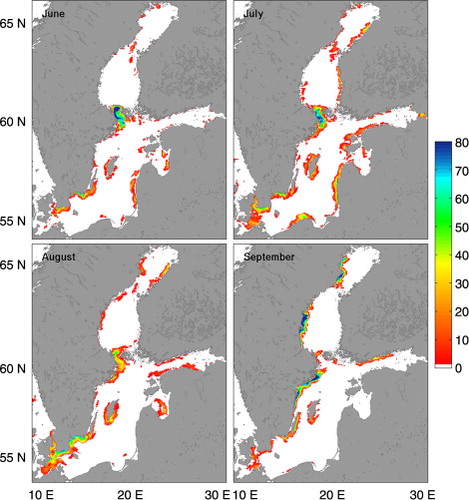
Although, at 2 nm, BALTIX has a fairly coarse resolution for upwelling studies, it is able to accurately describe the location of coastal upwelling events (), although upwelling frequencies tend to be somewhat higher than previous climatologies (Bychkova et al., Citation1988; Lehmann et al., Citation2012). It is unclear whether this is due to an inherent overrepresentation of upwelling in the model, or that there were particularly favourable upwelling conditions during the simulation period. It is unlikely the result of the upwelling detection method (discussed in Section 2.2), as this is based on the method used in previous studies. In June 2005, upwelling is most frequently seen between the coast of Sweden the Åland islands, with upwelling frequencies generally upwards of 50%, and extremes of around 80%. Upwelling is also frequent off the southernmost coast of Sweden, between Trelleborg and Ystad, with a frequency of around 30% and between Karlshamn and Karlskrona with a frequency of around 50%. Upwelling is also seen, although to a lesser extent, off the south-east coast of Öland, the west coasts of Lithuania and Latvia between Klaipeda and Liepja and in the Gulf of Riga. There is little or no upwelling in the Bothnian Bay or the Gulf of Finland. In July, the upwelling pattern remains similar around the coast of Sweden, while it strengthens between Klaipeda and Liepja, occurring up to 50% of the time. An upwelling centre is also seen off the coast of Poland (maximum 50% of the time) and some upwelling is seen along the eastern shore of the Bothnian Bay (maximum 50% in the northern upwelling area, 25% in the south). During August, the upwelling pattern around the Swedish coastline remains similar, although upwelling between Sweden and Åland weakens, occurring no more than around 40% of the time, and upwelling around the southern coastline continues to increase, generally occurring in excess of 50% of the time. There is also a distinct upwelling centre off the south east coast of Gotland, with a frequency of around 35%. Very little upwelling is observed on the eastern shoreline of the Baltic, apart from a small area in the north of the Bay of Bothnia, where upwelling occurs around 30% of the time. During September, very strong upwelling is observed off much of the coast of Sweden, with upwelling frequencies in excess of 70% seen along extensive sections of the coast. Increased upwelling is also observed off the whole east coast of Öland, with frequencies up to 40%. Almost no upwelling at all occurs on the eastern coast of the Baltic during September, although for the first time in the summer, there is a distinct upwelling centre on the northern shores of the Gulf of Finland, with a frequency of around 35%.
Fig. 4 The frequency of upwelling with a detectable SST signature for the months of June, July, August and September, 2005 (%).
2.2. Detection and removal of upwelling
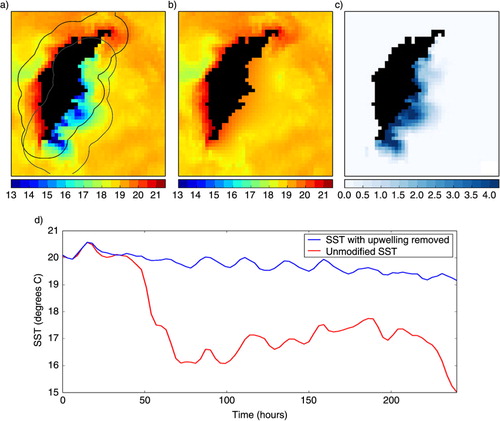
Although we have 3D ocean velocities, which could potentially be used to identify upwelling, we are only interested in upwelling events which have a surface temperature signal which can feed back onto the atmosphere. The identification of upwelling events with no surface temperature signal would lead to a bias in our results. We thus focus on identifying and removing upwelling in the SST field. Automated methods of detecting upwelling from SST fields have been described previously, e.g. Lehmann et al. (Citation2012) use a threshold of temperature difference from the zonal mean temperature within a specified distance of the coast. While this is successful for identifying areas of strong, active upwelling (which we refer to as the ‘upwelling core’), it cannot reasonably detect upwelled water which has been either advected further than the specified distance offshore or modified by contact with the atmosphere such that, while still colder than the ambient water, it cannot be directly identified using a temperature threshold without risk of identifying any colder than average ambient water present not due to upwelling. To this end, we extend the upwelling detection method of Lehmann et al. (Citation2012) to a two-step method. First areas of ‘active’ upwelling are identified as previously, using a distance and temperature threshold. We then repeat the algorithm, however instead of using distance from the coast as a threshold, we use a distance from the previously identified upwelling core. This allows us to use a much weaker temperature threshold on the second step to identify modified upwelled water, while reducing the risk of false positives where areas of cool water not associated with upwelling could be identified as upwelled water. Water which is identified as associated with upwelling, can then be removed, and the resulting data gaps filled using a standard inpainting technique (DErrico, Citation2005; Garcia, Citation2010). An example of upwelling removal around the coast of Gotland can be seen in . In the first panel, the original SST is shaded, with a strong upwelling event apparent off the south-east coast of the island. The thick black line surrounding the island shows the area around the coast where upwelling is initially searched for, using a 2.5°C Δ SST and a 30 km distance-from-coast criterion. The SST criterion selected is between the two values used by Lehmann et al. (Citation2012) and the distance-from-shore is essentially the same as the 28 km used by Lehmann et al. (Citation2012) given the coarser resolution of our model grid. The area where the secondary search is carried out, with a much weaker (0.5°C) Δ SST criterion and a 25 km from the upwelling core criterion, is illustrated by the thick grey line. The latter criteria are selected subjectively after testing, however the results presented here are not particularly sensitive to any reasonable threshold choices. The thin grey line delineates the area which has been identified as upwelling by this two-stage algorithm. The second panel shows the modified SST, when the area identified as upwelling has been removed, and the resultant gaps filled. The final panel shows the difference between the standard model SST and the SST once the upwelling signature has been removed. The timeseries below the maps shows the evolution of the SSTs in the upwelling and no-upwelling cases for a grid point near the Östergarnsholm measurement site during the July 2005 upwelling period. At the start of the period the SST here is around 20°C; however, over the course of the 20th July, the modelled SST quickly drops to around 16°C. Over the next 5 d, the SST slowly increases to 17.5°C, with a typical diurnal variability of 0.5–1°C, before a secondary upwelling event reduces the SST to around 15°C on the 27th July. In contrast, when the upwelling signal is removed, the SST remains relatively constant, between 19 and 20°C. Note that the influence of the surrounding water maintains a diurnal cycle of approximately 0.5°C in areas where the upwelling has been removed.
Fig. 5 Detection and removal of upwelling. The left panel (a) shows the modelled SST (°C), with a strong upwelling event along the south-east coast of Gotland. The black line indicates the area around the coast where upwelling is initially detected, and the thick grey line where the secondary search is carried out. The thin grey line shows the identified area of upwelling-modified water. The middle panel (b) shows the same SST as the left, but with the upwelling region interpolated over. The right panel (c) shows the difference between the upwelling and no-upwelling cases. The timeseries (d) shows temperature evolution in the upwelling (blue) and no-upwelling (red) simulations get the Östergarnsholm measurement site.
3. Results
3.1. Integrated effects on the Baltic
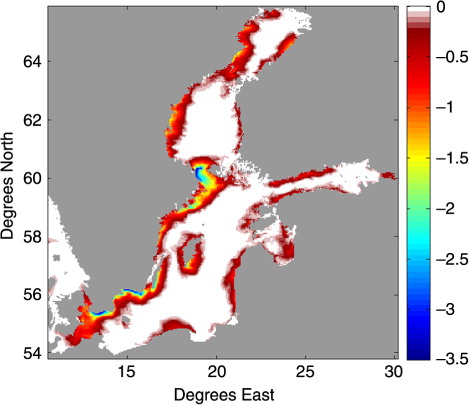
During the summer (June–September) of 2005, upwelling was frequent enough and sufficiently strong to have a significant effect on the mean summer SSTs around the Baltic coastline (). In areas where upwelling is most frequent, along the southern coast of Sweden, the south-east coast of Öland and between Sweden and the Åland Islands, upwelling lowers the mean summer SST by up to 3.5°C close to shore, reducing roughly linearly to approximately 20–30 km away from the coast. In areas where upwelling is less common but still readily observed—off the Swedish coasts around Hudiksvall and Umeå and off the south-east coast of Gotland—mean summer SSTs are generally 1.5–2°C cooler in simulations where upwelling is included. In other areas, notably on the eastern shores of the Baltic and around the Gulf of Finland, where upwelling was relatively uncommon during the summer of 2005, the mean difference due to upwelling is around 0.5°C.
Fig. 6 The mean summer (June–September) sea-surface temperature (°C) difference (no-upwelling–upwelling) between the standard model SST and the model SST which has had the upwelling signature removed at every output time.
The mean differences described above feed back to the atmosphere, where they cause a small but significant change in the atmospheric boundary layer over the Baltic Sea (). The most obvious effect is a cooling of the air temperature through a change in the air–sea heat fluxes. Over the areas of most frequent upwelling, the summer mean 2 m air temperature is decreased by up to 2°C, with decreases of around 0.5–1°C over the areas where upwelling is less frequent. Away from areas of active upwelling, direct impacts on the air temperature are zero, however due to advection of colder air from upwelling areas, much of the Baltic atmospheric boundary layer is cooled by 0.1–0.2°C, with a notable exception being the southern–central area of the Gulf of Bothnia. The direct feedback on air temperature from the air–sea fluxes associated with coastal upwelling also causes a change in the surface specific humidity (not shown). The Δ q patterns are almost identical to those for air temperature, with decreases of 0.6 g kg−1 over the most common upwelling areas, 0.2 g kg−1 over the areas where upwelling occurs less frequently, with changes ranging from 0 to 0.1 g kg−1 over much of the interior of the Baltic Sea. As the atmospheric boundary layer is cooled from below and stability increased, a reduction in mixing of momentum from aloft leads to a small but systematic decrease in the 10 m wind speeds over areas of upwelling (b). In the most frequent upwelling areas, off the southern coast of Sweden and the coasts of Öland and Gotland, mean summer wind speeds are reduced by up to 0.3 m s−1 (up to 5% of the mean wind). Further north along the Swedish coast, wind speed changes are smaller, typically up to 0.1 m s−1. There is a negligible change in wind speed over mostof the Gulf of Finland where upwelling was relatively rare during the summer, and changes along the eastern coastline of the Baltic basin are typically no more than 0.05 m s−1. Just to the north of the Åland Islands, there is an area where the 10 m wind speed is slightly increased by the presence of upwelling, with a maximum increase of around 0.1 m/s. This is likely due to an acceleration of the wind due to the promontory shape of the coastline north of Stockholm, an effect likely to become more significant as the boundary layer becomes more stable and the Froude number increases Perlin et al. (Citation2011).
Fig. 7 Composite differences between upwelling and no-upwelling simulations, averaging from June through September 2005. (a) 2 m temperature (°C); (b) 10 m wind speed (m s−1), (c) boundary-layer height (m).
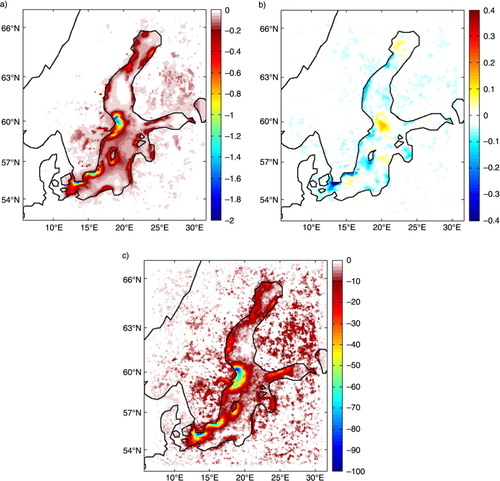
The lower SSTs and subsequent inhibition of atmospheric convection is also reflected in significant changes to the boundary-layer height diagnosed by the MYJ planetary boundary-layer scheme. Around the southern coast of Sweden and between the coast of Sweden and the Åland Islands, the summer mean boundary-layer height is reduced by up to 100 m, compared to a typical mean marine boundary-layer height of 250 m in the no-upwelling simulation. Reductions in the mean boundary-layer height of between 50 and 70 m are also seen off the coasts of Gotland and Öland. Along the remainder of the Swedish Baltic coastline and in the Gulfs of Finland and Riga, the boundary-layer height is typically 20–40 m shallower in the upwelling simulations. Along the southern coast of the Baltic Sea, between Sassnitz in Germany and Ventspils in Latvia, as well as in the central Bothnian Bay, there is little notable change in the model boundary-layer height. The boundary-layer height anomalies more closely mirror the surface air temperature anomaly rather than the SST differences.
3.2. Case study: an upwelling event off the coast of Gotland
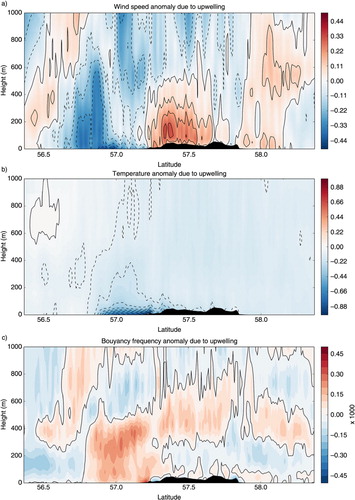
In order to examine the effect of a single upwelling period rather than the integrated effect over a season, we have performed a high-resolution (1.1 km) simulation of a single upwelling event that occurred off the south-east coast of Gotland in the second half of July, 2005 (). The upwelling event started as winds turned approximately parallel to the south-east coast of Gotland during the 19th of July. Over the course of the 20th July, SSTs within 30–40 km off the coast cooled by up to around 5°C as water from below the thermocline replaced the surface water. Atmospheric conditions which were favourable for coastal upwelling were only brief, and shortly after the onset of upwelling, the winds weakened slightly and backed so that the dominant wind direction was onshore. After this change in the wind direction, upwelling ceased and SSTs slowly started to warm through interaction with the atmosphere. During the 27th July, winds again became favourable for upwelling (in fact more so than previously) and SSTs east of Gotland rapidly cooled by a further 2–3°C; however, we consider this to be a separate upwelling event, and it is not considered here. Our simulation thus starts on the 19th July, shortly before the onset of upwelling and runs for a period of 5 d, covering much of the period between the start of the first and the start of the second upwelling events. Given the differences due to upwelling observed in the seasonal mean results described earlier, differences for a single upwelling case are unsurprisingly small (). Wind speeds (a) are, as in the mean case, slightly reduced directly over the area of strong upwelling, by up to 0.25 m s−1 (3.5% of the mean wind speed), as the turbulent mixing of momentum from above is inhibited. In contrast to this, wind speeds directly above the island, in the lower 500 m of the boundary layer, are slightly higher in the run where upwelling is present, perhaps as a result of slightly stronger convection as colder air is advected over the island. Air temperatures (b) are lower in the upwelling simulation throughout most of domain, with an anomaly of −0.2°C in the lower atmosphere directly over the main upwelling site, decreasing to around −0.05°C at 500 m altitude. The cold anomaly, which is formed over the upwelling site, is advected over the island by the mean wind, with 2 m air temperatures over the island generally between 0.05 and 0.1°C colder in the upwelling simulation. The presence of upwelling, with its lower SSTs, also has a tendency to increase the stability of the atmospheric boundary layer, albeit only slightly (c). The squared Brunt-Väisälä frequency, , is slightly reduced over the main upwelling site in the lower 500 m of the atmosphere, by between 2×10⁻⁴ and 4×10⁻⁴s−1, although this signal is not significantly larger than the noise. There is no notable change in stability immediately over the island, but there is a suggestion of slightly increased stability between 400 and 600 m altitude.
Fig. 8 Cross-sections (mean from 18°E to 19.5°E) of differences in wind speed (a); potential temperature (b); and buoyancy frequency (c) due to upwelling during an upwelling event in July 2005.
4. Discussion
Despite the frequency of upwelling in the Baltic Sea during the summer of 2005, and the significant impact this has on the mean SSTs, the feedback of this on the atmosphere is small, both in the mean sense and when looking at a specific upwelling case. The degree of upwelling is proportional to both the strength of the wind forcing and its duration. Thus, strong upwelling events which have the potential to have a strong feedback on the atmospheric boundary layer are generally associated with above average wind speeds. Such conditions are likely to be associated with a deep, relatively well-mixed boundary layer which will quickly dissipate any changes in the lower boundary layer caused by the low SSTs associated with upwelling. In order for the upwelling to have significant and lasting impact on the boundary layer, the inhibition of mixing through buoyancy loss must be able to overcome the mechanical mixing associated with the relatively strong winds. That is, the presence of upwelling may change the gradient Richardson number, above some critical value [typically taken to be 1, Stull (Citation1988)] where turbulence is inhibited. To examine whether it is feasible for upwelling to significantly impact upon the atmospheric boundary layer, we have run a further high-resolution simulation, identical to the Gotland case studies described in Section 3.2, but with the strength of upwelling doubled, in the sense that the SST depression in areas identified as upwelling is twice that of the standard upwelling case from the no-upwelling case. The differences between this ‘2×’ upwelling simulation and the no-upwelling simulation shows a much stronger than linear response to the colder sea-surface (). Wind speeds in the lowest 100 m of the atmosphere are depressed by up to 0.75 m s−1 in the 2×upwelling scenario, with an increase in the wind speed above this of up to 0.3 m s−1 to a height of around 500 m. The stronger winds extend over much of Gotland, to a height of around 300 m, with a maximum increase of 0.5 m s−1. The air temperature over the primary upwelling site is decreased by around 1°C over the upwelling through the lowest 100 m of the atmosphere. The cold anomaly extends downstream over the island and through much of the boundary layer, although the differences away from the surface layer over the upwelling are significantly smaller, up to around 0.2°C in magnitude. Perhaps the most marked difference between the standard and ‘2×’ upwelling simulations is in the changes in stability directly over the upwelling (c). The changes in N
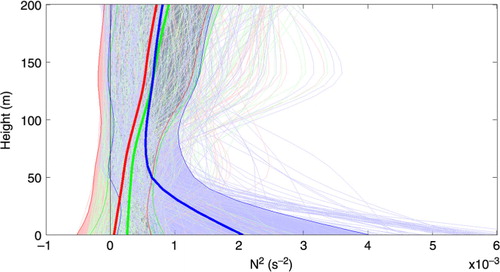
2 over the upwelling site are at least an order of magnitude larger in the ‘2×’ upwelling case, with the anomaly here far larger than anywhere else in the domain. This disproportionately large increase in stability is suggestive of a change of regime in the lowest levels of the atmosphere, from a state where shear-driven production of turbulent mixing dominates to a state where a buoyant sink of turbulence at the surface allows any anomalies introduced at the surface to persist. This can be seen more clearly in profiles of stability for an arbitrarily chosen location to the east of Gotland during this upwelling period (). The differences between the no-upwelling and upwelling simulations are very small, and constant throughout the lower boundary layer, suggesting that the upwelling is having very little effect on the dynamics of the lower atmosphere. In the 2× upwelling simulation, however, the buoyancy profile is similar to the no-upwelling and upwelling simulations above around 100 m altitude, but below this altitude the stability rapidly increases, becoming around an order of magnitude larger than either of the other simulations, on average, at the surface. This rapid increase in stability over a relatively shallow section of the atmosphere allows the signal of the upwelling to feed back into the lower atmosphere without being mixed away and becoming inconsequential.
Fig. 9 Cross-sections (mean from 18°E to 19.5°E) of differences in wind speed (a); potential temperature (b); and buoyancy frequency (c) due to upwelling during an upwelling event in July 2005, where the strength of the upwelling (temperature deviation from no-upwelling simulation) has been doubled.
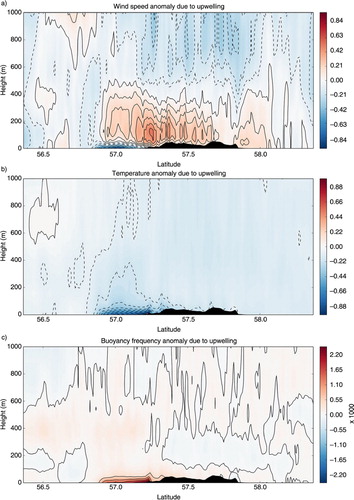
Fig. 10 Profiles of the square of buoyancy frequency in the lower boundary layer off the south-east coast of Gotland during the July 2005 upwelling period for no-upwelling (red), upwelling (green) and 2×upwelling (blue). Thin lines show profiles at every 3 hours, and thick lines show the mean over the simulation. Shaded areas show ±one standard deviation from the mean.
5. Summary and conclusions
Through a series of simulations of ocean and atmospheric models spanning the summer of 2005, we have investigated the feedback of coastal upwelling in the Baltic Sea on the atmospheric boundary layer. The effect of upwelling was isolated by developing a method to remove the signature of upwelling from the ocean model SSTs before using these as a lower boundary condition for an atmospheric model, and comparing this to simulations which included the unaltered SSTs. Upwelling during this summer was frequent around much of the Baltic coastline, leading to summer mean SST reductions of up to 3.5°C extending 20–30 km offshore. Despite these relatively large SST differences, the small spatial scale of upwelling and the generally strong winds which are associated with upwelling, which can quickly dissipate any upwelling-induced changes in the lower boundary layer, results in only small changes in the summer mean conditions of the boundary layer. Over sites where upwelling was most frequent, mean 2 m temperature differences of up to 2°C were observed, although away from active upwelling sites, mean changes did not exceed 0.2°C. Wind speeds were also slightly reduced over upwelling areas, by up to 0.25 m s−1. Boundary-layer heights were, on average, reduced by 80–100 m over areas where upwelling was most frequent, but generally not by more than 20 m away from these areas. A high-resolution simulation of a single upwelling period around Gotland showed only small changes caused by upwelling, despite the relatively large changes to the surface fluxes in the domain. This is most likely due to any changes being quickly mixed throughout the boundary layer by the strong winds associated with upwelling. If the strength of upwelling is increased while holding atmospheric forcing constant, a bifurcation effect can be seen in the lower atmosphere as the surface sink of buoyancy inhibits turbulent mixing, allowing modifications introduced by upwelling to persist and accumulate. This process may well become important as winds slacken the end of an upwelling period, but before the ocean has a chance to restratify.
6. Acknowledgements
Computations were performed on resources provided by SNIC through Uppsala Multidisciplinary Center for Advanced Computational Science (UPPMAX) under Project SNIC2013-1-324. In-situ SST measurements from the Datawell Directional Waverider Buoy were kindly provided by Kimmo Kahma and Heidi Pettersson at the Finnish Meteorological Institute. We thank two anonymous reviewers who have greatly helped to improve this manuscript.
Related Research Data
References
- Alenius P. , Nekrasov A. , Myrberg K . Variability of the baroclinic Rossby radius in the Gulf of Finland. Continent. Shelf Res. 2003; 23: 563–573.
- Bane J. M. , Levine M. D. , Samelson R. M. , Haines S. M. , Meaux M. F. , co-authors . Atmospheric forcing of the Oregon coastal ocean during the 2001 upwelling season. J. Geophys. Res. 2005; 110: C10S02.
- Bychkova I. , Viktorov S. , Shumakher D . A relationship between the large-scale atmospheric circulation and the origin of coastal upwelling in the Baltic. Meteorol. Gidrol. 1988; 10: 91–98. (in Russian).
- Dee D. P. , Uppala S. M. , Simmons A. J. , Berrisford P. , Poli P. , co-authors . The ERA-interim reanalysis: configuration and performance of the data assimilation system. Q. J. Roy. Meteorol. Soc. 2011; 137(656): 553–597.
- DErrico J . Inpaint NaNs. MATLAB Central File Exchange. 2005. Online at: http://www.mathworks.com/matlabcentral/fileexchange/4551 .
- Elliott D. L. , O'Brien J. J . Observational studies of the marine boundary layer over an upwelling region. Mon. Weather Rev. 1977; 105: 86–98.
- Fennel W. , Seifert T . Kelvin wave controlled upwelling in the western Baltic. J. Marine Syst. 1995; 6(4): 289–300.
- Fennel W. , Seifert T. , Kayser B . Rossby radii and phase speeds in the Baltic Sea. Continent. Shelf Res. 1991; 11: 23–36.
- Garcia D . Robust smoothing of gridded data in one and higher dimensions with missing values. Comput. Stat. Data Anal. 2010; 54: 1167–1178.
- Gidhagen L . Coastal upwelling in the Baltic Sea – satellite and in situ measurements of sea-surface temperatures indicating coastal upwelling. Estuar. Coast. Shelf Sci. 1987; 24: 449–462.
- Haapala J . Upwelling and its influence on nutrient concentration in the coastal area of the Hanko Peninsula, entrance of the Gulf of Finland. Estuar. Coast. Shelf Sci. 1994; 38: 507–521.
- Hela I . Vertical velocity of the upwelling in the sea. Soc. Sci. Fennica Comment. Phys. Math. 1976; 46(1): 9–24.
- Horstmann U . Distribution Patterns of Temperature and Water Colour in the Baltic Sea as Recorded in Satellite Images: Indicators for Phytoplankton Growth. Berichte aus dem Institut für Meereskunde an der Christian-Albrechts Universitüt in Kiel. 1983; 106: 1–147.
- Kahru M. , Håkansson B. , Rud O . Distributions of the sea-surface temperature fronts in the Baltic Sea as derived from satellite imagery. Continent. Shelf Res. 1995; 15(6): 663–679.
- Kowalewski M. , Ostrowski M . Coastal up-and downwelling in the southern Baltic. Oceanologia. 2005; 47(4): 453–475.
- Kulinski K , Pempkowiak J . Carbon Cycling in the Baltic Sea. 2012; Springer, Berlin.
- Lehmann A. , Myrberg K . Upwelling in the Baltic Sea: a review. J. Marine Syst. 2008; 74: S3–S12.
- Lehmann A. , Myrberg K. , Höflich K . A statistical approach to coastal upwelling in the Baltic Sea based on the analysis of satellite data for 1990–2009. Oceanologia. 2012; 54(3): 369–393.
- Lips I. , Lips U . Abiotic factors influencing cyanobacterial bloom development in the Gulf of Finland (Baltic Sea). Hydrobiologia. 2008; 614(1): 133–140.
- Löffler A. , Schneider B. , Perttilä M. , Rehder G . Air–sea CO2 exchange in the Gulf of Bothnia, Baltic Sea. Continent. Shelf Res. 2012; 37: 46–56.
- Myrberg K. , Andrejev O . Main upwelling regions in the Baltic Sea – a statistical analysis based on three-dimensional modelling. Boreal Environ. Res. 2003; 8: 97–112.
- Norman M. , Parampil S. R. , Rutgersson A. , Sahlée E . Influence of coastal upwelling on the air-sea gas exchange of CO2 in a Baltic Sea basin. Tellus B. 2013b; 65: 21831.
- Norman M. , Rutgersson A. , Sahlée E . Impact of improved air–sea gas transfer velocity on fluxes and water chemistry in a Baltic Sea model. J. Marine Syst. 2013a; 111–112: 175–188.
- Omstedt A. , Gustafsson E. , Wesslander K . Modelling the uptake and release of carbon dioxide in the Baltic Sea surface water. Continent. Shelf Res. 2009; 29(7): 870–885.
- Perlin N. , Skyllingstad E. D. , Samelson R. M . Coastal atmospheric circulation around an idealized cape during wind-driven upwelling studied from a coupled ocean–atmosphere model. Mon. Weather Rev. 2011; 139: 809–829.
- Perlin N. , Skyllingstad E. D. , Samelson R. M. , Barbour P. L . Numerical simulation of air–sea coupling during coastal upwelling. J. Phys. Oceanogr. 2007; 37: 2081–2093.
- Ribeiro F. N. D. , Soares J. , de Oliveira A. P . The co-influence of the sea breeze and the coastal upwelling at Cabo Frio: a numerical investigation using coupled models. Braz. J. Oceanogr. 2011; 59: 131–144.
- Rouault M. , Lee-Thorp A. M. , Lutjeharms J. R. E . The atmospheric boundary layer above the Agulhas Current during along current winds. J. Phys. Oceanogr. 2000; 30: 40–50.
- Rutgersson A. , Norman M. , Schneider B. , Pettersson H. , Sahlée E . The annual cycle of carbon dioxide and parameters influencing the air–sea carbon exchange in the Baltic Proper. J. Marine Syst. 2008; 74: 381–394.
- Siegel H. , Gerth M. , Rudloff R. , Tschersich G . Dynamic features in the western Baltic Sea investigated using NOAA-AVHRR data. Deut. Hydrogr. Z. 1994; 46(3): 191–209.
- Stull R. B . An Introduction to Boundary Layer Meteorology.
- Uiboupin R. , Laanemets J . Upwelling characteristics derived from satellite sea surface temperature data in the Gulf of Finland, Baltic Sea. Boreal Environ. Res. 2009; 14(2): 297–304.
- Vahtera E. , Laanemets J. , Pavelson J. , Huttunen M. , Kononen K . Effect of upwelling on the pelagic environment and bloom-forming cyanobacteria in the western Gulf of Finland, Baltic Sea. J. Marine Syst. 2005; 58(1–2): 67–82.
- Wesslander K. , Omstedt A. , Schneider B . Inter-annual and seasonal variations in the air–sea CO2 balance in the central Baltic Sea and the Kattegat. Continent. Shelf Res. 2010; 30(14): 1511–1521.
- Zemba J. , Friehe C. A . The marine atmospheric boundary layer jet in the Coastal Ocean Dynamics Experiment. J. Geophys. Res. 1987; 92(C2): 1489–1496.
- Zhurbas V. , Laanemets J. , Vahtera E . Modeling of the mesoscale structure of coupled upwelling/downwelling events and the related input of nutrients to the upper mixed layer in the Gulf of Finland, Baltic Sea. J. Geophys. Res. 2008; 113: C05004.