
Abstract
This study investigates the sensitivity of tropical cyclone (TC) motion and intensity to ocean surface fluxes that, in turn, are directly related to sea surface temperatures (SSTs). The Advanced Research version of the Weather Research and Forecast (WRF-ARW) model is used with an improved parameterisation of surface latent heat flux account for ocean salinity. The WRF-ARW simulations compare satisfactorily with the NCEP/NCAR reanalysis for atmospheric fields and remotely sensed precipitation fields, with the model providing details lacking in coarse resolution observations. Among four TCs investigated, except the one re-developed from a previous TC remnant, the stretching term dominates the relative vorticity generation, and a bottom-up propagation mechanism holds for the three TCs. For the Tropical Rainfall Measuring Mission (TRMM) precipitation, the spatial ranges are accurate but actual rainfall rates are significantly larger than those remotely sensed. This indicates the value of numerical simulation in quantitative rainfall precipitation estimation (QPE) for TCs. Sensitivity experiments are performed with altered SSTs and changes in tracks and intensity are examined. A TC-dependent threshold wind speed is introduced in defining total kinetic energy, a measure of TC intensity, so arbitrariness in domain setting is avoided and inter-basin comparisons are possible. The four TCs selected from different global basin show that the intensity increases with increasing SST. Within a domain, a power–law relationship applies. More important, warmer SST indicates a more rapid intensification, quicker formation and reduced warning issuance time for emergency services. The influence of SSTs on TC track is more complex and lacks a generic relationship. For the South Pacific basin, higher SSTs favour a more northerly track. These TCs occasionally cross continental Australia and redevelop in the southern Indian Ocean basin, affecting the resource-rich onshore and offshore industrial developments in northwest Western Australia. In the Atlantic basin (e.g. Katrina 2005), when SSTs increase, the TC tracks tend to curve over warm pools but generally have a shorter ocean-residence time. When the synthesised SST fields are raised 2°C above Katrina (i.e. >32°C), the possibility exists of generating two TCs in close proximity. That lack of unanimity of the impacts on TC tracks, in response to synthesised SSTs, partly arises from the complicated response of subtropical highs, which may be disintegrated into several pieces and dispersed with relatively lower pressure regions, which may become the shortcuts when a TC traces the periphery of the subtropical high.
1. Introduction
The formation of tropical cyclones (TCs) has long been a major area of research and has produced hypotheses such as Convective Instability of the Second Kind (CISK, Charney and Eliassen, Citation1964; Anthes, Citation1982), and the more recent and widely accepted wind-induced surface heat-flux exchange theory (WISHE) of Emanuel (Citation1986). These two theories focus on the intensification process of TCs after they have formed and, in some cases, the warm-core structure is already established. The transition of a weak and unorganised disturbance into a tropical depression (TD) is thought to be a random process. Although the large-scale environmental conditions necessary for TC formation are well known [e.g. the three dynamics and three thermodynamics criteria of Gray (Citation1998)], the mesoscale and convective-scale mechanisms for unorganised disturbances becoming TDs are not yet well understood (Tory and Frank, Citation2010). Nolan et al. (Citation2007) discussed how asymmetric latent heating, in levels of positive gradients of environmental moist static energy, could contribute to the formation of a warm core.
TC motion is primarily caused by advection of the TC by the surrounding environmental flow (Chan and Gray, Citation1982; Flatau et al., Citation1994; Chan, Citation2005; Leslie and Holland, Citation1995). While other mechanisms exist that cause the TC to move independently of this environmental ‘steering currents’ (Wu and Emanuel, Citation1993), the steering of the TC by its environment generally is the dominant contribution, especially for steady TC motion (Chan, Citation2002). This explains why TCs move around the subtropical highs, such as the Bermuda high. However, at any moment, a TC is composed of many convective cells, each with its own life cycle of development and decline, under the modulation of the environment. TCs are a gross manifestation of the ensemble behaviour of those convective cells. The relationship of a TC with a complex, dynamically evolving environment has been a subject of modelling research for many years (e.g. Holland, Citation1984; Shapiro, Citation1996; Shapiro and Franklin, Citation1999; Chan et al., Citation2002; Wu and Wang, Citation2004). By providing high-resolution, four dimensional, dynamically consistent atmospheric parameters, numerical weather prediction (NWP) model simulations provide insights into the relative importance of various synoptic-scale features in the TC environment. In this study, the sensitivity of TC tracks to surface latent heat flux (evaporation) is investigated, using Advanced Research version of the Weather Research and Forecast (WRF-ARW) (hereafter, simply WRF). The TC track is determined from the time evolution of the WRF simulated atmospheric fields. To determine the location of a TC, a tracker scheme is employed (e.g. Bengtsson et al., Citation1995; Walsh et al., Citation2007). Tracker schemes are numerical representations of the dynamic and thermodynamic criteria of a developed TC. As described by Walsh et al. (Citation2007) typical tracker starts by finding a localised minimum in surface pressure or maximum in cyclonic vorticity, to identify a potential cyclone. Once identified, the system is then filtered by pre-set values of maximum wind speed, vorticity, duration and some measure of the presence of a warm core. In addition, some studies, based on high-resolution models, have utilised criteria based on genesis location, surface pressure anomaly, and a measure of structure in terms of vertical variation of tangential maximum wind speed and/or horizontal temperature gradients. Because known historical TCs are being simulated, the warm-core criterion of Bengtsson et al. (Citation1995) and the cyclone-phase-space approach (to differentiate mid-latitude cyclones from TCs) of Hart (Citation2003) are not required and the tracker scheme can be simplified. The sensitivity of TC strength to sea surface temperature (SST) changes also will be investigated. One well-known measure of the strength of a TC is its total kinetic energy. The total kinetic energy within the influence range of a TC is insensitive to actual simulation domain size and is directly comparable among TCs from different basins.
Here, the sensitivity of four TCs to SSTs is examined over the globe ( and ): Typhoon Ketsana (2003); Hurricane Katrina (2005); severe TC Larry 2006 and TC Glenda 2006. Using four TCs from four different basins, the aim is to find any commonality in their formation, maximum intensity and tracking, and responses to a warmer ocean surface. Because of the associated natural hazards, such as flash floods and mudslides, and their high social and economic impacts, landfalling TCs have been at the centre of the discussion of the impacts of global warming effects. With global climate variability, there has been a steady increase of SSTs over the past three decades, especially in the Indian Ocean TC basins (Bengtsson et al., Citation2007; Luo et al., Citation2011). This study is directed at assessing potential changes in TC activity as the climate warms.
Fig. 1 TCs investigated in this study: (a) Katrina (21 August–2 September 2005) in Atlantic Basin; (b) Glenda (22–31, March 2006) of Southern Indian Basin; (c) Ketsana (15–26 October, 2003) of western North Pacific Basin; and (d) Larry (13–21 March, 2006) of Southern Pacific Basin. The IBTrACS traces are plotted as red lines. The contour lines are environmental SST, with 302–303 K hatched. The regions defined by the dashed lines (the slow advancing stage of TCs) are for vorticity tendency analysis. The black dashed lined define the 5-km nested simulation domains (i.e. Domain 2s).
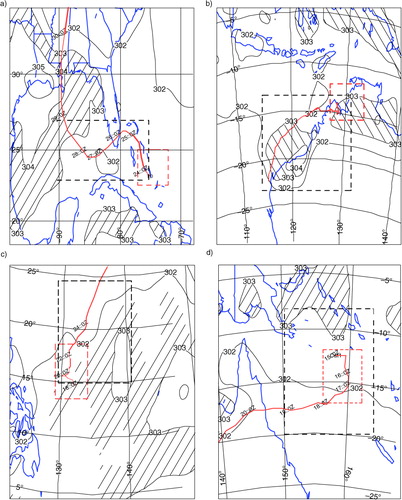
Table 1. Life cycles and attributes of the TCs investigated
Over oceans, the marine surface layer is always moist and the evaporation is directly proportional to SST. One mechanism indicating the critical role for ocean surface evaporation is that, after the passage of a previous disturbance, the vertical stratification of atmosphere tends to be more stable. In tropical regions (all year round), to reduce the convective stability is to accumulate more moisture at lower levels. By increasing the stability, a moist middle layer, by preventing a premature release of convective available potential energy (CAPE), is favourable for the next disturbance because total latent heat release produced by deep convection is directly proportional to the moisture content in the deep mid-levels. That is, the enhanced environmental relative humidity is essential for full-development of clouds and their upward transport of moist static energy (c p T +gz+Lq s ) from the boundary layer and contributes to TC formation (Demaria et al., Citation2001). Diabatic heating by latent heat release, a leading moist static energy input for the environment, however, is counteracted immediately by adiabatic cooling of the expanding moist air parcel, so the net heating of an air parcel is the residual of the two large terms. However, in this case, as diabatic heating is the ‘forcing’ and adiabatic cooling is the ‘response’, as in many dissipative systems, the net result is heating. In a vertically stratified atmosphere (an environment set by radiative–convective balance), the temperature decreases within the troposphere but with a reducing lapse rate. At the upper troposphere, the local vertical gradient of moist static energy becomes positive. If an air parcel's condensation occurs at this level, the latent heat release will exceed that required to compensate for the adiabatic cooling caused by expansion and thus a net increase in this parcel's temperature is feasible. In reality, deep cumulus clouds can achieve this increase and carry the released latent heat of condensation to the upper troposphere. That the warm core for TCs occurs in such a deep layer clearly suggests a likely association with cumulus towers, in both the TC formation and ensuing development. This also explains why the viable early TC disturbance seeds are selective: normal shallow convection does not qualify as a TC initiation disturbance. As tropical disturbances are far smaller than the Rossby deformation radius (Gray, Citation1993), mass (pressure) fields adjust to the circulation (winds) fields (Nolan et al., Citation2007; Anthes, Citation1982). Because deep convective towers have strong remote sensing signatures, assimilation of remotely sensed wind fields is critical for successful TC simulations.
The paper will proceed with a description of the data used in this study and the WRF model's basic setting, followed by the methods adopted to objectively diagnose TCs, including the defining of total kinetic energy, the relative vorticity tendency equation and an improved version of parameterisation of the latent heat flux. Next is a description of the datasets employed in this study. A discussion follows of the ‘control’ runs that assimilate all possible available information and we examine how the TCs are simulated in the numerical model for all four global basins. Since precipitation rate is a direct indicator of cloud type and the unique role of clouds in a TC's life cycle, independent sources of remotely sensed precipitation rates are used to verify the WRF model simulations. Experiments with altered SSTs are performed. The effects on TC activities are evaluated and tentative conclusions are drawn with an emphasis on shared features of the four selected TCs. Many more TCs will need to be examined in a similar manner to establish if our tentative conclusions are more generally correct.
2. Data and WRF model
TC observations are taken from the International Best Track Archive for Climate Stewardship (IBTrACS, Kruk et al., Citation2010; http://www.ncdc.noaa.gov/oa/ibtracs/), which is at 6-hour intervals. To illustrate the physics responsible for changes in TC activity, we also use the products from the National Centre for Environmental Prediction (NCEP)/National Center for Atmospheric Research (NCAR) reanalyses (Kalnay et al., Citation1996). The analysis archive covers the period 1948–2012 and can be divided into three periods, corresponding to the evolution of the major observing systems. These are the early years, from 1948 to 1957, where very few upper-air observations were made; the rawinsonde era from 1958 to 1978; and the satellite era from 1979 to the present. The gridded NCEP reanalysis data (at 2.5°lat/lon) are used to analyse the large-scale environment associated with the formation of the four selected TCs. Hourly images from the Geostationary Operational Environmental Satellite-9 (GOES-9) infrared chanel-1 (IR1) with wavelength 10.3–11.3 µm and of ~5 km resolution are used to monitor deep convective clouds and mesoscale convective systems (MCSs; Houze, Citation2004). The MCSs form a coherent group of deep convection cells that are vital to the formation of viable TC disturbances (Doswell, Citation2001; Ch. 9). The satellite images used are from a data archive in CIMSS (http://tropic.ssec.wisc.edu/) that cover the hurricane developing areas. The cloud-top height is inferred from the infrared brightness temperature (BT). Areas with BTs cooler than the thresholds of −32, −60 and −75°C are considered to be convection in cloud clusters, deep convection in MCSs, and extreme convection in hot towers (VHTs), respectively. A MCS is defined as having a BT<216 K, an area larger than 40 000 km2, and an eccentricity greater than 0.5 (Lee et al., Citation2008). These criteria apply to satellite imagery as well as to the WRF simulations.
The non-hydrostatic WRF model Version 3.4, developed at NCAR (Skamarock et al., Citation2008), is used to simulate the entire life cycles of the four selected TCs. To identify the genesis mechanisms, or the processes leading to the formation of the TC, the simulation is initiated 2 d earlier than the IBTrACS starting record and is run until 1 d after landfall (e.g. 10 d for Ketsana, a life-time oceanic TC). The simulation domains are one-way nested with horizontal resolutions of 20/5 km, and stencil sizes of 168×100; 200×150; 150×120; and 150×124 for the coarse domains, respectively for Katrina, Glenda, Ketsana and Larry. The stencil sizes of the nested 5-km domains are correspondingly 332×100 (covering 90–75°W; 23–27°N, the black dashed line confined area in a); 384×240 (113–130°E; 22–12°S, b); 240×208 (129–140°E; 12–24°N, c); and 292×264 (150–163°E; 20–8°S, d). There are 35 atmospheric levels with the model top set at 50 hPa. The Kain-Fritsch cumulus parameterisation scheme (Kain, Citation2004) is used for the coarse domains, and explicit moisture calculation and a microphysics scheme are used for the 5 km inner domains. Other related packages employed include the WRF single-moment six-class microphysics scheme with graupel (Hong et al., Citation2004), and the Yonsei University planetary boundary layer parameterisation.
During the approximately 10 d of WRF integration, with 10-second time steps, the model initial and lateral boundary conditions are taken from the 0.5°lat/lon NCEP global forecast system final gridded analyses, with the outer lateral boundaries updated every 6 hour. The NCEP daily 0.5° SST field is used to update the lower boundary conditions. Without data assimilation steps, the simulated TC track are in error by up to 80 km to the east of the IBTrACS observations for TC Katrina, and to the south by about 25 km for TC Glenda. The locations of the MCSs also do not match well with the satellite imagery. To improve the WRF simulation of the atmospheric conditions, the National Aeronautics and Space Administration (NASA)'s Quick Scatterometer (QuikSCAT) oceanic winds and the Defense Meteorological Satellite Program's Special Sensor Microwave/Imager (SSM/I) oceanic surface wind speed and total precipitable water, for the first 3 d, are assimilated using the WRF-Var3 with a 12 hour assimilation window. The 25 km horizontal resolution, twice-daily swath data of QuikSCAT and SSM/I were extracted from the Remote Sensing System (RSS) data archive (ftp://polar.ncep.noaa.gov/pub/history/sst/). This simulation with data assimilation is treated as the control experiments. To verify the model simulated precipitation, the Tropical Rainfall Measuring Mission (TRMM) 3B42RT grid precipitation products are used (ftp://trmmopen.gsfc.nasa.gov/pub/merged/3B42RT/).
3. Background and theoretical issues
To objectively compare the strength of TCs in different basins, a measure of total TC kinetic energy is calculated. Similarly, as TCs move in the direction of fastest increase in cyclonic vorticity, a vorticity tendency equation is used to establish the basis for discussion of TC genesis and the two related working hypotheses. The parameterisation of evaporation (latent heat flux at air/sea interface) in WRF is improved by including salinity effects.
3.1. Wind energy
The majority of disasters from TCs are directly linked to their wind strength (Powell et al., Citation2005; Holland et al., Citation2010). TCs in different basins, and in the same basin with different background environmental conditions, can be diverse in size and intensity. In model simulations, the domain sizes may also be set arbitrarily irrespective of the locations of TCs. An objective measure for the wind energy associated with TCs thus is critical for evaluation of TCs’ potential destructiveness. In this study, the total energy at the inner portion of domain 1 (20 grids inside the boundary in each direction) is summed, avoiding boundary effects. Further, a threshold wind speed is set at one tenth of the maximum wind speed at any given time within the simulation domain. The entire kinetic energy () is:
1 where Ω is the horizontal sub-domain which exceeds the threshold wind speed criteron (at least one grid in this column exceeds the threshold speed),
is the magnitude of the vector wind, dA and dp are areal and pressure integration variables, and g is gravitational acceleration (9.81 m s−2). In the corresponding plots, the energy unit is terajoule (1012 J).
3.2. Vorticity tendency equation
Not only do TCs move toward the direction with the largest gradient in increasing cyclonic vorticity, the formation of A TC primarily starts from a cyclonic perturbation in the flow field that initiates the convergence of low level moisture to form convective perturbations (Holland et al., Citation1991). At the initial stage, these may be unorganised TDs. A TD might die but can leave a more favourable circulation environment for the next TD, although the effects on sea surface evaporation are negative (cold trace effect). If the SST is sufficiently high, the favourable cyclonic vortices heritage outweighs the cold trace effects and the following TD generally will grow larger. After several TDs, typically 3–7 in the western North Pacific basin and less in the south Pacific basin, there will be a viable vortex that eventually exceeds the self-sustaining criterion (highly organised) and becomes a TC (Montgomery et al., Citation2006). To investigate the low-level vortex intensification (e.g. TC Glaenda's rapid burst of intense deep convection), the following vorticity tendency equation is used:2
where ς is the relative vorticity, f is the inertial frequency of earth rotation, is absolute vorticity, u, v, and w are the wind components; p the pressure, and ρ the air density. The right-hand-side terms represent horizontal advection, vertical advection, stretching, tilting, solenoidal effects and sub-grid-scale flux derivatives, respectively. The stretching term indicates that the absolute vorticity is required to be non-zero for low-level convergence to generate relative vorticity. This explains why TCs rarely form within ±5° of the Equator (Gray, Citation1968). The baroclinic term also explains why higher-than-average relative vorticity (e.g. synoptic precursor disturbances) is required for TC cyclogenesis, because this term works more efficiently when the temperature stratification and lower wind field harness the energy released in condensation to strengthen the local cyclonic vorticity, through generation of potential vorticity.
3.3. Salinity dependence of surface latent heat flux
Evaporation at the air–sea interface results in an upward transport of energy in the form of latent heat, and thus injects water vapour into the atmosphere. This is a major energy source for atmospheric circulation (Schulz et al., Citation1997). The exchanges of water vapour and heat at the surface take place simultaneously and connect the energy cycle to the hydrologic cycle. As the evaporated moisture reaches the lifting condensation level, condensation occurs and the released latent heat warms the environment and is critical for tropical disturbances, such as easterly waves, reverse troughs and monsoonal troughs, that become TCs (Yanai et al., Citation1973). In particular, the fluxes are pivotal in the creation of warm-core structure and the maintenance of cyclonic vorticity (Nolan et al., Citation2007). The warm core is a deep layer (700–200 hPa) of air with lower pressure than surrounding environment, and the upper levels (100 hPa and above) having higher pressure than its surroundings. Thus, low-mid level convergence and upper level divergence, act like a ‘chimney’. Cyclonic vorticity is generated as a result of attempting to maintain hydrostatic and gradient wind balance. Lower level moisture input is the fuel for TC, if it is regarded as a Carnot engine (Emanuel, Citation1986). The surface latent heat flux is estimated from the bulk formula that includes near surface wind speed, air humidity, and SST:3 where LE is latent heat flux (W/m2), ρ is air density, l is the latent heat of evaporation (J/kg),
is turbulent covariance of near surface specific humidity (q
v
) with vertical component of velocity (w) which, according to mixing length theory, can be parameterised by a turbulent diffusion coefficient and the vertical gradient of the mean state of q
v
. C
D
is the Dalton drag coefficient,
is the near surface wind speed, and the over-bar indicates a temporal mean state. Once measurement height is decided, eq. (3) can be further written as
4 where q
vs
is specific saturation humidity at the SST T
s
, and C
E
now is the Dalton coefficient (unitless, ~2×10⁻³). The latent heat flux causes a cooling of the upper layer of the ocean and, through the loss of water, an increase of the salinity in the oceanic mixed layer. For TC research, the changes in salinity can safely be neglected. However, the effects of ocean salinity on evaporation cannot be omitted. Salinity can significantly (up to 70‰, e.g. southern Indian Ocean) lower the saturation vapour pressure at the water surface (Ren and Leslie, Citation2011). Based on the molar Gibbs free energy criteria, the salinity dependent parameterisation is:
5 where S is salinity in practical salinity units (PSU), and specific humidity takes the value at the lowest model level (~10 m above sea level, asl henceforth). The ultimate energy source for TCs is the lower surface evaporation. In this study, the WRF scheme is modified to include salinity effects in the bulk formulae. Also, the scheme is applied to the entire simulation domain, not locally to the TC region. It is clear from eqs. (3–5) that the SST is vital for the magnitude of the surface evaporation, the most important moisture and energy source for TC development and maintenance over the entire TC lifecycle. Prediction of the TC lifecycle thus depends ultimately on how latent heat fluxes are represented in WRF.
An upright chimney is not as effective in maintaining the warm-core structure because, as precipitation occurs, the released water drops out (e.g. as hails, snowflakes and super cooled raindrops) and evaporates (absorbing heat) as it falls, causing downdrafts. The downdrafts apparently are negative feedbacks that need to be minimised to guarantee further development of the warm-core structure. Weak vertical wind shear can provide a favourable ‘slanted chimney’ structure that takes advantage of the condensation latent heat release to warm the air and minimise the cooling of air directly downward of the warm core region. The vertical shear of horizontal winds should be moderate to allow cyclones to develop vertical coherence. The persistent presence of strong shear with thermal winds over the south Atlantic largely accounts for its lack of TCs. The longevity of the disturbance depends on whether this favourable moisture-providing setting can be maintained. Clearly, this stage is critical and a slight change in the environmental conditions (e.g. a perturbing from the subtropical high or an intrusion of a higher latitude disturbance) causes a pinch-cut of the moisture source for this tropical disturbance. Likely, the very first such disturbance following a previous TC is not viable. However, it leaves more favourable conditions for the following disturbances: a cyclonic circulation remnant in the mid-/upper-level and a relative moist mid-/low-level atmosphere. Not only does initiating these conditions from the outset require a significant amount of energy, the moist mid-/low-level atmosphere also guarantees weaker downdrafts compared to the previous diminished disturbance, all else being equal, because the evaporation of the droplets in the moist environment will be less than in a drier environment. Previous disturbances leave a cold tongue of SST through evaporation and churning the ocean mixed layer waters. Thus, sufficiently high SSTs are critical for a tropical disturbance eventually to become a viable TC (Gray, Citation1968, Citation1979; Anthes, Citation1982). Ideally, for TC development, the genesis region should be a certain distance from the poleward turning point, depending on the strength of the westward steering current (e.g. the peripheral winds of subtropical highs), and require at least 2 d for the disturbance to derive enough latent heat from the warm ocean surface.
3.4. Design of sensitivity experiments
Initialisation problems would arise if SSTs are directly altered and WRF then was run with otherwise identical (unchanged) initial and boundary conditions. To examine the sensitivity of TC tracks and intensities to ocean surface fluxes, several sensitivity experiments with WRF are performed with SSTs for the entire simulation domain altered uniformly by 0.5,1, 1.5, 2, 2.5 and 3°C (all are not present). In practice, the WRF variational data assimilation system is used to assimilate the altered SST fields. In this way, other atmospheric components still behave appropriately based on the same physics implemented in the WRF forward model.
4. Results of WRF simulations
The genesis positions of the selected TCs are shown in . The general life cycle is summarised in . They either formed in the eastern wave trough (Katrina) or in a reverse-oriented monsoon trough (ITCZ, Ketsana and Larry), a large-scale environment with high humidity and abundant low-level cyclonic vorticity that favours TC formation. For example, Ketsana was identified as a disturbance in a reverse-oriented monsoon trough ~1300 km east of Luzon Island on 15 Oct, 2003. Glenda is a characteristic re-development after a cyclonic remnant passing over warm ocean surface. For Ketsana, during mid-October when it was in a developing stage, the integrated amplitude of the first two real-time multivariate Madden-Julian Oscillation (MJO) indices (Wheeler and Hendon, Citation2004; RMM1 and RMM2 in ) both exceed unity and the phase of MJO was five in the western Pacific. Therefore, the MJO was in the active (or wet) phase and is considered favourable for TC formation (Maloney and Hartmann, Citation2000). The track re-curvature of Ketsana is steered by a mid-latitude trough just upstream and a weak subtropical high to the east during its entire sea-living period.
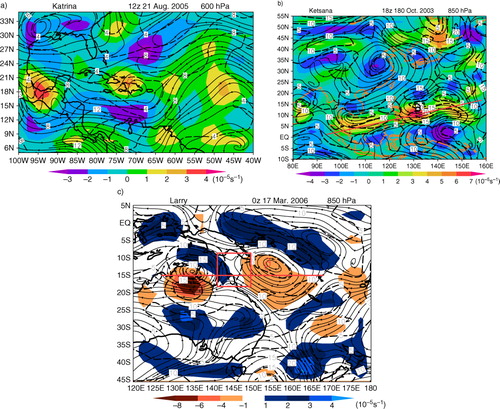
Fig. 2 NCEP/NCAR reanalyses of the lower level (600 hPa for Katrina and 850 hPa for Ketsana and Larry) streamlines, wind speeds (dashed lines, m/s) and relative vorticities (colour shades, 10−5 Hz) at 1 d lead time of the TC formation alert (TCFA). The formation environments are shown for Katrina, Ketsana and Larry. Katrina forms as a perturbation in the eastern waves, while Ketsana and Larry are formed inside ITCZ. Larry formed at the maxima in the southern extension of the ITCZ (red dashed lines). The red dashed lines are the approximate locations of ITCZ (also called monsoon shear line).
In the western North Pacific basin, about 70% of TC formations occur in the monsoonal trough (McBride, Citation1995; Lander, Citation1996). This is because the monsoon trough is often associated with a favourable background environment with high relative humidity throughout the entire lower to middle tropospheric vertical column, cyclonic relative vorticity, convective instability, strong low-level convergence, and persistent cloud clusters. Thus, it is not surprising that variability of the monsoonal trough substantially impacts the spatial and temporal variations in TC frequency of formation (Chen et al., Citation2004). The occurrence of MCSs at multiple times was identified during the 2 d prior to the formation of most TCs in monsoonal confluence and monsoonal shear (Ritchie and Holland, Citation1999). Coexistence of MCSs is common in the monsoon-related synoptic patterns. A middle-level mesoscale convective vortex (MCV, Bartels and Maddox, Citation1991; Davis and Galarneau, Citation2009) is often generated in active MCSs with severe convection. Once formed, the MCVs often outlive their parent MCSs. Recent observational and modelling studies provide mounting evidence of the importance of long-lived MCVs during TC formations (e.g. Bosart and Sanders, Citation1981; Harr and Elsberry, Citation1996; Ritchie and Holland, Citation1997). Therefore, attention should be paid to the occurrences of MCSs to find viable TC genesis conditions. There is still uncertainty about the mechanisms through which MCSs influence TC formation. Long-lasting MCSs developing under substantial low-level vertical wind shear also can have a MCV in the stratiform rainfall region (Chen and Frank, Citation1993). Over the US Great Plains, a downward extension of MCVs, through vertical advection (Rogers and Fritsch, Citation2001), is critical for the formation of tornadoes (Maddox, Citation1980; Fritsch and Maddox Citation1981a, 1981Citationb; Miller and Fritsch, Citation1991). Similar mechanisms likely are involved in TC formation. Another working hypothesis, the so-called bottom-up hypothesis, is based on the observations of Zehr (Citation1992) that low-level vortex intensification sometimes follows bursts of intense deep convections. Montgomery et al. (Citation2006) suggest that this deep convective, low-level vortex enhancement is taking place within MCSs well before the formation of a self-sustainable system-scale vortex. The system-scale vortex then further intensifies through mechanisms such as CISK and WISHE (e.g. Craig and Gray, Citation1996). Hendricks and Montgomery (Citation2006) further suggested that VHTs with spatial scales of 10–20 km play a critical role during the process. Based on the observational and modelling evidence of VHTs, several recent studies (Reasor et al., Citation2005; Sippel et al., Citation2006; Fang and Zhang, Citation2010, Citation2011) indicate that the bottom-up process is a viable pathway to the enhancement of a surface vortex during TC formation. Using high-resolution WRF simulations, this study investigates the role of MCSs in the formation of weak disturbances leading to hurricanes under basin-specific environmental conditions. A budget analysis of the area-average relative vorticity is performed according to the vorticity tendency equation [eq. (2)].
A budget analysis is made for area-averaged relative vorticity for the TCs of interest here. The regions where averages are taken are shown in : 22.5–25°N; 77–72°W for Katrina, 17–12°S; 156–162°E for Larry, 16–12°S; 126–133°E for Glenda, and 13–18°N; 129–134°E for Ketsana.
For Ketsana and Larry, at mid-level (5000 m asl) the vertical advection of vorticity has a positive contribution to vorticity tendency throughout the entire time period of 2 d leading to the TC formation, whereas the average tendency of low- to mid-level tilting is always negative (b and d), and the two almost cancel each other. Horizontal advection and stretching are the two largest terms in vorticity generation. There is strong cancellation of the positive tendency from stretching (convergence) and low level horizontal advection. However, the two terms work in synergy at higher levels (above 6000 m asl). The stretching term has a good timing match with MCS development, as observed from satellite imagery. The episodes of strong stretching with apparent daily cycle characteristics (c) all correspond to sizable MCSs development, which has clear footprints in visible imagery. This supports the bottom-up hypothesis. Atlantic hurricane Dolly (2008) also has a similar development mechanism. However, the situation for Katrina is quite different. For Katrina, the horizontal convergence, or the stretching term, is the dominant vorticity contribution. The frictional term, which always acts to reduce the vorticity (both cyclonic and anti-cyclonic), counteracts the stretching production of vorticity. Thus, the vorticity is produced in the convergence mid-/lower-layer and dissipated in the bottom frictional layer. There is no apparent downward propagation of positive vorticity at the initial stage. TC Larry resembles Ketsana in its genesis, except that a local circulation feature between Australia and Indonesia is an input source of anticyclonic vorticity in the outer region (10° away to the northwest), helping to concentrate the cyclonic vorticity regions and better organising the deep convection (e.g. the VHTs).
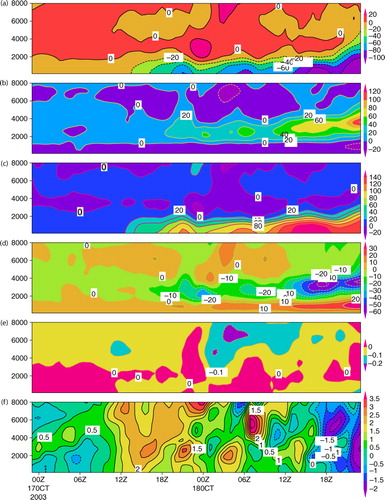
Fig. 3 Time-height diagram of the area-average (a sector leading the IBTrACS observed TC location at the formation stage, ~5 by 5° region defined by the dashed line boxes in ) vorticity tendencies (10−11s−2) for Ketsana 2003. The panels (from top to bottom) are organised as (a) horizontal advection, (b) vertical advection, (c) stretching, (d) tilting, (e) baroclinicity, and (f) the sum of all above terms. The TC moves toward the direction of fastest increase in cyclonic vorticity. Stretching always is the most important term for positive vorticity production. In the vertical advection (b) term, from 18z 17 October to 0 z 19 October 2003, there is apparent bottom-up tendency in vorticity generation. In (f), the bottom-up extension also is apparent from 0z 17 October to 12z 18 October (when it becomes a tropical depression).
Whereas Katrina still shares similarity with Ketsana 2003 in its accumulation of positive vorticity at the generation stage, Glenda's genesis is totally different (a–f). Top-down advection is more significant in relative vorticity production for Glenda (a, b and d). The initial centres of large negative (cyclonic in the Southern Hemisphere) vorticities are located at ~10 km asl and are gradually advected downward, agreeing with the fact that Glenda is a re-development of a remnant of Larry, as indicated in the reanalysis data (not shown). In this case, tilting also works in synergy with vertical advection. After landfall, Larry dissipated in its lower levels because the moisture input was greatly diminished when it travelled over northern Australia. The mid-level/high-level vortex remained and journeyed quiescently westward until reaching the Hollway Current, where SSTs are as high as 31°C (b) and provide significant moisture for evaporation to the low pressure system. The explosive re-development of this vortex into a sizable TC took only one and half days. The case of Glenda also demonstrates the important role of oceanic surface fluxes in the intensification of cyclonic vortices. Throughout the inter-comparison, it is also clear that the relative vorticity production is directly proportional to absolute vorticity, hence, the magnitude of each term cannot be compared between TCs from different basins. More importantly, the bottom-up and top-down mechanisms may only differ rhetorically. In each case, no matter how the cyclonic vorticity is entrained, all are accompanied by convective bursts of MCSs (identifiable clearly from satellite images) and the latent heat release from precipitation is the energy source for the system's development into a self-sustaining mode.
Fig. 4 Same as , but for TC Glenda 2006. Unlike Ketsana, top-down advection is more significant in relative vorticity production for Glenda [(a), (b) and (d)]. The initial centres of large negative (cyclonic in SH) vorticities are located at ~10 km and is gradually advected downward, in agreement with the fact that Glenda is a re-development of Larry. In this case, tilting works also in synergy with vertical advection. Note that the relative vorticity production is directly proportional to absolute vorticity value, making it impossible for comparison of the magnitude of each term across TCs of different basins.
![Fig. 4 Same as Fig. 3, but for TC Glenda 2006. Unlike Ketsana, top-down advection is more significant in relative vorticity production for Glenda [(a), (b) and (d)]. The initial centres of large negative (cyclonic in SH) vorticities are located at ~10 km and is gradually advected downward, in agreement with the fact that Glenda is a re-development of Larry. In this case, tilting works also in synergy with vertical advection. Note that the relative vorticity production is directly proportional to absolute vorticity value, making it impossible for comparison of the magnitude of each term across TCs of different basins.](/cms/asset/5ac426df-d165-4475-bb26-eff06d24d802/zela_a_11817009_f0004_ob.jpg)
4.1. Model verification with NCEP/NCAR reanalysis
Comparison between WRF simulations in coarsest domain (Domain 1; ~0.18 deg. lat/lon) and the corresponding NCEP/NCAR reanalyses (reanalyses figures are not shown for clarity) indicate that the large scale circulations have been simulated satisfactorily, with WRF providing more details (Figs. (Citation5–Citation8)), such as the downdrafts and asymmetric rain bands near the storm centre. Assimilation of QuikSCAT and SSM/I wind information improved the simulation of the low-level cross-equatorial flow between 110° E and 140° E, and the location and intensity of the ITCZ. For Ketsana, the strong southwesterlies (jet's core was at ~7°N, b) south of the ITCZ are essential for reproducing the orientation and strength of the monsoonal trough, and enhancing the low-level convergence that is critical for generating MCSs. At 200 hPa, the simulated location and evolution of the South Asia high, which was northeast of the location where Ketsana developed, also agrees well with the NCEP/NCAR reanalysis. This is the simulated outflow channel for the pre-Ketsana unorganised convective disturbances.
Fig. 5 Structure of Katrina (2005) from the WRF-ARW simulation. Typical features necessary for the tracker (to detect TCs) are resolved, including: quasi-axisymmetric shape (a), wind speed (b) maximum just above the planetary boundary layer (~850 hPa), and an upper level (750–200 hPa) warm core (c). In Panel (a), contour lines are surface level pressure (hPa) and shades are precipitation (accumulated total amount up to the labelled time, mm). The vector fields are 850-hPa winds; (b) shows the vertical cross-section of wind speeds along 25°N [red line in Panel (a)]. (c) shows the temperature cross-section along the red line in (a). The dashed blue lines are specific humidity (g/kg); (d) is vertical wind speed along the same cross-section. The roughly horizontal lines are the geopotential heights (in dm). Model time is 28 August 2005.WRF simulations have more details than NCEP/NCAR reanalyses (not shown). For example, there are downdrafts in the sector with strong precipitation [blue blob in (d)]. The maximum vertical movement occurs around 500 hPa (reaching ~5 m/s), agree with the airplane surveys of four Atlantic mature TCs by Jorgensen (Citation1984a, 1984Citationb). Most of the troposphere is warmer than environment (700–200 hPa), warm core is around 250 hPa. Not shown is the cold core above 100 hPa, caused by strong radiative cooling when the convective tower is penetrating above the equilibrium level. Panel (c) also indicates that Katrina has a moist core, indicating that the most active convective activity occur inside the 70 km (from centre) inner region, becoming close to environmental mean at about 5° latitudinal distance. Outside the ~120 km inner region, where upward motion dominates, there are complex alternating patterns of upward and downward (blue) regions (d).
![Fig. 5 Structure of Katrina (2005) from the WRF-ARW simulation. Typical features necessary for the tracker (to detect TCs) are resolved, including: quasi-axisymmetric shape (a), wind speed (b) maximum just above the planetary boundary layer (~850 hPa), and an upper level (750–200 hPa) warm core (c). In Panel (a), contour lines are surface level pressure (hPa) and shades are precipitation (accumulated total amount up to the labelled time, mm). The vector fields are 850-hPa winds; (b) shows the vertical cross-section of wind speeds along 25°N [red line in Panel (a)]. (c) shows the temperature cross-section along the red line in (a). The dashed blue lines are specific humidity (g/kg); (d) is vertical wind speed along the same cross-section. The roughly horizontal lines are the geopotential heights (in dm). Model time is 28 August 2005.WRF simulations have more details than NCEP/NCAR reanalyses (not shown). For example, there are downdrafts in the sector with strong precipitation [blue blob in (d)]. The maximum vertical movement occurs around 500 hPa (reaching ~5 m/s), agree with the airplane surveys of four Atlantic mature TCs by Jorgensen (Citation1984a, 1984Citationb). Most of the troposphere is warmer than environment (700–200 hPa), warm core is around 250 hPa. Not shown is the cold core above 100 hPa, caused by strong radiative cooling when the convective tower is penetrating above the equilibrium level. Panel (c) also indicates that Katrina has a moist core, indicating that the most active convective activity occur inside the 70 km (from centre) inner region, becoming close to environmental mean at about 5° latitudinal distance. Outside the ~120 km inner region, where upward motion dominates, there are complex alternating patterns of upward and downward (blue) regions (d).](/cms/asset/b57abf92-47b5-4699-a100-2e8e6d50eac7/zela_a_11817009_f0005_ob.jpg)
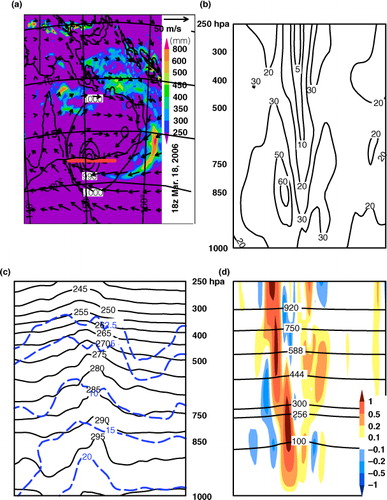
Fig. 6 Same as but for TC Glenda (at 12z 28 March 2006). Unlike the other three TCs, it has a higher level maximum velocity core at 450 hPa, an indication that it is a re-development of an upper level cyclonic vortex of Larry. A top-down vorticity generation mechanism also accounts for its initial stage intensification, as expected.
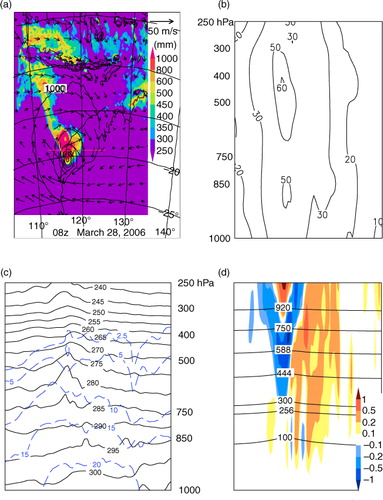
Fig. 7 Same as but for TC Ketsana. Among the four TCs, Ketsana (a non-landfalling TC) produced the most (cumulative until 00z 24 October, as labelled) precipitation. Its kinetic energy also is the largest among the four TCs studied here. The energy conversion efficiency is similar among the four.
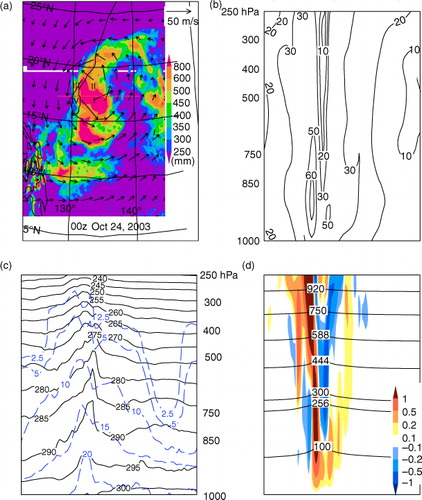
Fig. 8 Same as but for TC Larry.
The situation for TC Larry is very similar to TC Ketsana in that it forms inside the ITCZ, when the ITCZ is at its southernmost location (red dashed line in ). The strong westerlies (reaching 10 m/s steadily at 6°S and 155°E) are vital for the creation of cyclonic vorticity during the early stages of Larry's formation. It differs from the environment of Ketsana in the following aspects: (1) the subtropical high is at its peak strength (ridge line at ~25°S) and the steering current advects Larry westward; (2) there is a saddle structure (the box defined in c) that exists for all of Larry's ocean period. At different stages, the role of this saddle structure is different. It affects Larry's track, as it is a negative vorticity source (repelling Larry and deflecting its track southward) and reinforces the beta-effect in the southward deflection. The saddle structure also is a moisture source for Larry, as there are strong, along-flow specific humidity gradients. Larry's development further confirms that low-level moisture convergence is the fuel for the CISK and WASHE positive feedback mechanisms that reinforce the warm core and makes the TC self-sustainable against dissipation.
At the mature stage, the differences among TCs are also apparent. Only Katrina has a more axisymmetric eye wall structure. The eye region has strong downward motion (d) while the strongest upward motion is found inside the eye-wall. Radially outward, there are thermally-indirect, interlaced upward and downward motions. There are clear features evident on the humidity (blue dashed lines in c) and wind fields (axis-symmetric maximum wind speeds cores in b at ~850 hPa). The other three TCs all are less symmetric. The sectors with strongest convective instability (e.g. the sectors with oceanic winds blowing poleward or on-shore) also tend to have the strongest upward motion and associated strongest downward drafts, organising the MCSs into rain bands. For Ketsana, a maritime TC for its entire lifetime, the sector (a, quadrant I) with southerly winds (from the equatorial warmer ocean surface) has the strongest precipitation. For Glenda and Larry, the land–ocean contrast is the main reason for a lack of symmetry in the convective rain bands (a). The moisture content over land masses is much smaller than over the oceans, especially for Glenda (not shown). Measured by the area confined by the 1000 hPa contour line (a), or from a kinetic energy viewpoint, Katrina is not outstanding as Ketsana triples Katrina's peak kinetic energy (c.f. a, c). Katrina is so strongly organised that it creates an environment with the smallest Rossby radius of deformation (RRD) and the secondary circulation associated with it (to the east), if the SST was 2°C warmer in the Atlantic warm pool, would also be a sizable TC.
4.2. Model verification with TRMM precipitation measurements
Precipitation magnitude and structure is a manifestation of TC intensity (Nolan et al., Citation2007; Houze, Citation2010). Thus, a realistic simulation of the precipitation and its spatial distribution are particularly important aspects of WRF's ability to predict TC track and intensity forecasts accurately, and for the correct physical and dynamical reasons. The mesoscale forcing of vertical motion (and precipitation intensity) over different sectors of a TC are explainable by the quasi-geostrophic ω-equation and the Q-vectors perpendicular to the isentropes. The following discussion focuses on differences due primarily to the higher resolution configuration of the WRF runs compared with TRMM measurements.
is a comparison between TRMM-measured and WRF-simulated Katrina precipitation rates (mm/hr) at three different times; at 18 z on August 27, 15 z 28 August and 03 z 29 August 2005. Precipitation is asymmetrically distributed around the eye and areas with strongest precipitation, located in clusters, can be up to 200 km away from the TC centre. Patterns derived from the radar observations are accurately captured by model simulations. However, quantitative precipitations from the TRMM radar observations are weaker than model simulated and kind of smeared out. While TRMM precipitation provides a good sense of the horizontal distribution of precipitation, it lacks realistic variations in precipitation intensity. In contrast, WRF predictions yield more details, and strong convective precipitation regions are captured. Upon landfall (August 29), the total precipitation and geographical/spatial distribution are vital for accurately predicting storm-triggered landslides and flash flooding (Ren et al., Citation2011). In this sense, as a high-resolution full-physics model, WRF can play an important role in quantitative precipitation estimation (QPE), forecasting heavy precipitation at specific times and locations, and for quantitative precipitation forecasts (QPFs) for the case of landfalling cyclones. More generally, combining numerical model predictions with precipitation patterns derived from observations by radars, satellites and in situ gauges is a viable approach for obtaining better estimates of rainfall-related natural hazards (Ren, Citation2014a, Citation2014b). For a grid point trailed by the eyewall, TRMM precipitation concentrates on the 5–20 mm/hr bin level, whereas the WRF simulated precipitation is much higher, at 60–200 mm/hr bin level (80% of the precipitation is in this bin for Katrina).
Fig. 9 Comparison of Katrina simulated and TRMM observed precipitation rates (mm/hr). Left panels are TRMM 3B42RT observations, middle panels are WRF simulations and right panels are the differences between TRMM observations and WRF simulations.
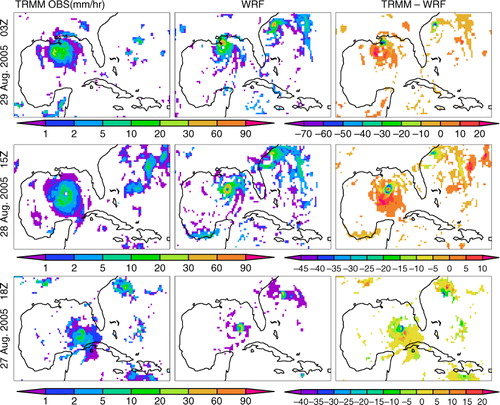
The above statements are generically applicable for the other three TCs (parallel figures are not shown). Precipitation amounts are good indicators of released latent heat (Doswell, Citation2001). Ketsana (a) produced the most precipitation amongst the four TCs (~2.79×10¹³ kg in the simulation domain) and also produced the strongest winds and hence had the largest kinetic energy among the four. This is primarily due to its longer time over the ocean. Also, the transfer efficiency from the associated latent heat into kinetic energy is very low (~10%) for all four TCs, with Katrina being the highest. Thus, only a small fraction of the released latent heat is required to maintain the symmetric vortices and warm core structure by transformation into kinetic energy and available potential energy. Only with a warm core structure can the cyclonic wind simultaneously satisfy the gradient wind balance and hydrostatic requirements.
4.3. Tracking the simulated TC centres
An automated TC detection scheme (TC-tracker) was applied to objectively locate the TC centres and build up the complete tracks. In this study, the criteria used are similar to those employed by Ookuchi et al. (Citation2006). The same tracker scheme is applied to all four TCs and all sensitivity experiments to exclude uncertainties from the somehow arbitrarily set tracker parameters. The modelled tracks for Ketsana and Larry are very close to those from the IBTrACS. For Katrina, the simulated track errors are largest among the four TCs, primarily in its westward moving period, persistently reaching 0.5° to the north at 82–87°W, during the first 2 d of its ocean period after moving away from Florida, while the northward moving stage is free from such large errors. Further research is needed to correct this problem. However, this systematic bias does not affect the SST sensitivity studies carried out here.
4.4. Sensitivity of TC tracks to SSTs
TCs move toward the direction of increasing cyclonic vorticity. Thus, the relative vorticity equation [eq. (2)] is equally useful in explaining the TC tracks. For example, the so-called beta effect is one part of the horizontal advection of absolute vorticity. Advanced numerical model simulations are the most accurate means of track projection and for investigating the mechanisms causing that track. Here, the focus is on how the TC tracks change with SSTs. Unlike the total kinetic energy measure there is no unanimous conclusion concerning TC track sensitivity to varying SSTs. For Katrina, the simulated control track is to the east of IBTrACS observations by 0.4° at most (a). It seems that increasing SSTs by 1°C will push the track more southward. The case of a 2°C increase in SST indicates that the TC will wander in the warm pool. Once turning north, it makes a rapid landfall. In general, increasing SSTs do not push the track more westward. However, reducing the SST gives a more continuous pattern of retracting more east and more than 2°C reduction in SST may not result in a significant hurricane (e.g. the minus 3°C case rapidly decayed over the ocean). A point needing attention is that the case with 2°C SST warming, there is a second hurricane to the east (red dashed line in a) of the primary hurricane track, which is heading north along the Florida coast and reaches Category 1 at the peak stage. This case may have climate warming implications and needs further investigation in future work.
Fig. 10 Sensitivity of TC tracks to SST. (a) for Katrina, (b) for Larry, (c) for Glenda and (d) for Ketsana. For all cases, TCs cannot form if SST were 2° lower than reality. In fact, TCs will not form for a 1° colder SST over the southern Indian Ocean basin. If temperatures are higher, the tracks tend to recurve over the sea but spend less overall time before making landfall. Also, as temperature increases, the secondary circulation also tends to form a ‘weaker’ hurricane, for the case of Katrina [there will be another smaller scale TC tracing along the eastern coast of Florida, blue dashed curve in (a)]. For Larry, stronger TCs tend to take a more northerly track, because the saddle atmospheric circulation (the box in c) usually provides anticyclonic vorticity that sends the TCs southward (working in synergy with the beta effect). This TC behaviour is due primarily to stronger steering currents.
![Fig. 10 Sensitivity of TC tracks to SST. (a) for Katrina, (b) for Larry, (c) for Glenda and (d) for Ketsana. For all cases, TCs cannot form if SST were 2° lower than reality. In fact, TCs will not form for a 1° colder SST over the southern Indian Ocean basin. If temperatures are higher, the tracks tend to recurve over the sea but spend less overall time before making landfall. Also, as temperature increases, the secondary circulation also tends to form a ‘weaker’ hurricane, for the case of Katrina [there will be another smaller scale TC tracing along the eastern coast of Florida, blue dashed curve in (a)]. For Larry, stronger TCs tend to take a more northerly track, because the saddle atmospheric circulation (the box in Fig. 2c) usually provides anticyclonic vorticity that sends the TCs southward (working in synergy with the beta effect). This TC behaviour is due primarily to stronger steering currents.](/cms/asset/eba51e2f-090d-4d3c-bf23-b9fe92a782bd/zela_a_11817009_f0010_ob.jpg)
b is the parallel case for TC Larry. Higher SSTs force Larry-like TCs to follow a more northerly path and lower SSTs leads Larry-like TCs to a more southerly path. This is because the beta effect competes with the negative vorticity input from the saddle structure in the circulation fields which pushes TCs south. Raising SSTs indicates the weakening of the saddle structure (spreading of the subtropical high in the Southern Hemisphere, SH). More TCs take a northerly track. Unfortunately, this type of TC also tends to be trans-Australian ones that redevelop off the western coast. Thus the effects of SST on the environmental factors are the primary reasons for the changes in TC tracks. The cases with reduced SSTs tend to take a more southerly path and bring more precipitation to the east coast of Australia. Actually, the vegetation pattern has a strong correlation with the TC tracks (after landfalls). The situation for Glenda is different. The cases with higher SSTs tend to land more southerly. The cases with reduced SSTs tend to meander along the coasts.
WRF control experiments (without altering SSTs) simulated track for Ketsana, the one from western North Pacific basin and the only life-long sea-dwelling one, has the least error and the track is also least sensitive to SST warming (d). The lack of consistency (among different TCs) in the response of TC tracks to changes in SSTs is partially due to the complicated changes of subtropical highs in response to altered SSTs. For example, an expanded (e.g. measured by the area confined by the 500 hPa 588 dm isolines) subtropical high does not mean that a TC must be pushed further away (westward in the western North Pacific basin). As there are relatively lower pressure regions dispersed inside the subtropical high, a TC can cut through these regions while tracing the periphery of the subtropical high. Ketsana's primarily northerly track (almost no westward traveling component in its evolution), especially after 12 z on Oct. 23, is due to the severely weakened subtropical high caused by another co-existing super Typhoon Parma (to the east of Ketsana). If SST is set warmer than the control, the circulation of Parma becomes stronger and the subtropical high is further weakened. This explains the tracks corresponding to warmer SSTs (brown lines in d) are to the east of the control, especially for the later stage of motion (i.e. north of 23°N). Similarly, if SST is set cooler than the control, the subtropical high is less weakened by Parma and remains stronger than for the control case and this gives a westward component of the motion of Ketsana-like TCs (the two green lines on d).
Examining the WRF simulations indicates that the convective cells within a TC have their own life cycles of development and decline. The TC sector that have larger diabatic heating or have cyclonic vorticity input from the environment favours convective development and the sector with opposite conditions dampens the convective activities. The gross effect would be motion of a TC in the preferred direction. This explains why a TC moves toward the area of maximum potential vorticity tendency. Potential vorticity is a quantity that combines the dynamics and thermodynamics of an air parcel and the potential vorticity tendency has a direct linkage to TC motion (Chan et al., 2002). The WRF simulations indicate that the SST perturbations, through the contribution to potential vorticity, affect the TC motion.
4.5. Sensitivity of TC kinetic energy to SST
At the mature stage, the maximum wind speed cores are located very close to 850 hPa (b–8b), whether or not the TC is axisymmetric about the eye. TC Glenda is unusual in that it has another maximum speed core aloft at ~500 hPa. This is another indication that Glenda is formed from an upper level remnant vortex.
The method outlined in Section 3.1 is an objective approach for estimating the intensity of a TC because the arbitrariness in selecting the domain size is minimised. The total kinetic energy is summarised in an influence domain (ID) that moves with the TC as it evolves. The ID increases as the TC develops and reaches its maximum volume around the time of landfalling or, for non-landfalling TCs (e.g. Ketsana), at the peak stage of ocean surface moisture providence (before the loss of its moisture source by various factors such as passage of upper level meso-lows or intrusion of mid-latitude systems). For the control simulations, the kinetic energy peaks at 4.6, 12.7, 4.4 and 5×10⁶ TJ for Katrina, Ketsana, Larry and Glenda respectively. So, the drastic differences in absolute amount of kinetic energy cannot be accounted for by SST alone. For all four selected TCs (), the total kinetic energy continues to increase as SST increases. The environmental factors work in a complex manner in determining the size and strength of individual TCs. It is a general feature that the higher the SST, the shorter the time a TC stays at sea. However, this attributes mainly to the increases in steering currents. Another feature of interest, ascribes primarily to increased rotation rate, is that the beta effects are more salient and interfere with the steering currents and many turn-arounds (e.g. figure ‘8’ motion) over the ocean. The sensitivity experiments also indicate that when the SST is lower than ~26.5°C, a TC might not form. This is consistent with many previous studies (Gray, Citation1968; Bengtsson, Citation2001; Webster et al., Citation2005).
Fig. 11 Sensitivity of TC wind energy to SST. (a) for Katrina, (b) for Larry, (c) for Ketsana, and (d) for Glenda. For all cases, TCs strengthen unanimously with increasing SSTs. The wind energy is only 25% of the latent heat released with the precipitation for Katrina and 30% for Larry. For a fair comparison among TCs from different basins, the threshold wind speed is set to one tenth of the peak wind speed, which is about 5 m/s for all category-5 TCs. This minimises the effects of using different simulation domain sizes. Except for Ketsana, the total kinetic energy peaks immediately before landfall. For the maritime TC Ketsana, its energy reduces gradually as it approaches higher latitudes (with reduced moisture fuel). The higher the SST, the faster the TC moves (note the peak timing of each curve). These also agree with the well-known SST criteria for TC formation (>26.5°C).
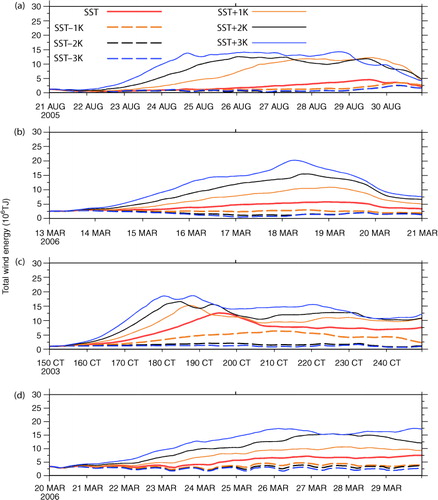
Ketsana accumulated the most kinetic energy primarily due to its longer sea-dwelling period and completed more evaporation–condensation cycles. The wind energy curve falls slower than the landfalling TCs because the surface roughness over ocean is smaller than over land. One primary reason that Katrina did not accumulate high kinetic energy is that its first landfall over Florida wasted most of its kinetic energy up to 24 August 2005 to surface friction. There remained only 3 d before its poleward turning for it to re-build its kinetic energy. A warm ocean temperature assisted (see a–d, hatched region of higher SSTs). The westward moving section is the primary kinetic energy accumulation period. TC Katrina, because it made landfall in populous region of New Orleans, caused the largest societal impacts, but from the more objective measure of total kinetic energy accumulated during its life cycle, it is only slightly higher than TC Larry.
5. Conclusion
TCs develop as organised convective systems. The energy source is the ocean surface evaporation. It causes disturbances to the mass field through the release of latent heat of condensation and the thermally direct way of upper level outflow and lower level inflow. Whether or not a disturbance can survive the uncertainties of evolution and intensification depends on the anti-correlation of the RRD and the strength of the flow field (specifically its absolute vorticity as well as the horizontal range of the disturbance in flow fields). The more concentrated the vortices, the easier it is to initiate the positive feedback process. Thus, cumulus towers are ideal candidates to initiate the process. For the system to be self-sustaining, the scale of organised latent heat release should exceed the critical RRD. Everything else being the same, higher SSTs assist the mass disturbance in sustaining gravity wave dissipation and eventually reaching the scale of RRD. Sensitivity experiments in this study indicate that higher SSTs support more energetic TCs. Higher SSTs also enhance the possibility of following TDs developing into sizable TCs, reducing the so-called cold-trace effect. The relatively shorter ocean-dwelling time of the system may result from the fact that the steering flow (e.g. the peripheral currents of the subtropical high) tends to be stronger. TCs also tend to have curved tracks because the beta effects are stronger and counteract more effectively the environmental steering. This process has different consequences for different basins. While we cannot generalise these conclusions without investigating more TC systems, we want to draw the following conclusion from the current research. For the resource-rich northwest Western Australia (NWA) basin, the consequence is a more southward landfall location. For the Atlantic basin, it means the possibility of twin TCs which may make landfall separated by only a short period.
The intensity of TCs, as measured by the total kinetic energy, tends to increase exponentially with increased SSTs. Although direct inter-basin comparison is not yet feasible, for the same basin and with similar environmental flow conditions, the total energy follows a power law rooted in the thermal–wind relationship (Ren, Citation2010). The modelling reveals a strong sensitivity of the storm properties to SST. For example, Ketsana's energy (c) increases by some 36% with a 2°C increase in SST. In response to this 2°C excess, the storm's total wind energy above 107 TJ persists for twice the duration of the reference condition. Further, the storm achieves the reference storm's energy peak level some 2 d earlier. These changes in storm properties, namely stronger storms, increase in duration of storm peak intensity and a reduced time for issuing warnings are concerning trends to emerge from this modelling exercise and are generally far more significant than the impact of track and associated location of landfall. Although TCs from all major basins are involved, this study still is not a full representation of all possibilities. For example, those TCs starting from MJO or equatorial Rossby wave precursor disturbances may have very different climate responses to higher SSTs.
6. Acknowledgements
We thank Chris Harris from the iVEC super computing group for providing technical assistance in running WRF. We thank Professors Greg Holland and Roger Pielke Sr. for useful discussions on MCSs, and for TC genesis in general and specifically southern Indian Basin TCs. Curtin University's Office of Research and Development is acknowledged for their support in undertaking this research.
Related Research Data
References
- Anthes R . Tropical Cyclones: Their Evolution, Structure and Effects.
- Bartels D. L. , Maddox R. A . Midlevel cyclonic vortices generated by mesoscale convective systems. Mon. Weather Rev. 1991; 119: 104–118.
- Bengtsson L . Enhanced hurricane threats. Science. 2001; 293: 440–441.
- Bengtsson L. , Botzest M. , Esch M . Hurricane-type vortices in a general circulation model. Tellus A. 1995; 47: 175–196.
- Bengtsson L. , Hodges K. I. , Esch M. , Keenlyside N. , Kornblueh L. , co-authors . How may tropical cyclones change in a warmer climate?. Tellus A. 2007; 59: 539–561.
- Bosart L. F. , Sanders F . The Johnstown flood of July 1977: a long-lived convective storm. J. Atmos. Sci. 1981; 38: 1616–1642.
- Chan J . Tropical cyclone motion. Topic Chairman and Rapporteur Report. 5th WMO International Workshop on Tropical Cyclones (IWTC-V), Cairns, Australia. 2002; Geneva, Switzerland: World Meteorological Organization. 1317–1336. WMO/TD No. 1136.
- Chan J . The physics of tropical cyclone motion. Annu. Rev. Fluid. Mech. 2005; 37: 99–128.
- Chan J. , Gray W. M . Tropical cyclone movement and surrounding flow relationship. Mon. Weather Rev. 1982; 110: 1354–1376.
- Chan J. C. L. , Ko F. M. F. , Lei Y. M . Relationship between potential vorticity tendency and tropical cyclone motion. J. Atmos. Sci. 2002; 59: 1317–1336.
- Charney J. G. , Eliassen A . On the growth of the hurricane depression. J. Atmos. Sci. 1964; 21: 68–75.
- Chen S. S. , Frank W. M . A numerical study of the genesis of extratropical convective mesovortices. Part I: evolution and dynamics. J. Atmos. Sci. 1993; 50: 2401–2426.
- Chen T. C. , Wang S.-Y. , Yen M.–C. , Gallus W. A. Jr. . Role of the monsoon gyre in the interannual variation of tropical cyclone formation over the western North Pacific. Weather Forecast. 2004; 19: 776–785.
- Craig G. , Gray S . CISK or WISHE as the mechanism for tropical cyclone intensification. J. Atmos. Sci. 1996; 53(23): 3528–3540.
- Davis C. A. , Galarneau T. J . The vertical structure of mesoscale convective vortices. J. Atmos. Sci. 2009; 66: 686–704.
- DeMaria M. , Knaff J. , Connell B . A tropical cyclone genesis parameter for the Atlantic. Weather Forecast. 2001; 16: 219–233.
- Doswell C . Severe convective storms. American Meteorological Society. Meterol. Monogr. 2001; 28(50): 561.
- Emanuel K. A . An air–sea interaction theory for tropical cyclones. Part I: steady-state maintenance. J. Atmos. Sci. 1986; 43: 585–605.
- Fang J. , Zhang F . Initial development and genesis of Hurricane Dolly (2008). J. Atmos. Sci. 2010; 67: 655–672.
- Fang J. , Zhang F . Evolution of multi-scale vortices in the development of hurricane Dolly (2008). J. Atmos. Sci. 2011; 68: 103–122.
- Flatau M. , Schubert W. H. , Stevens D. E . The role of baroclinic processes in tropical cyclone motion: the influence of vertical tilt. Z. Atmos. Sci. 1994; 51: 2589–2601.
- Fritsch J. M. , Maddox R. A . Convective driven mesoscale weather systems aloft. Part I: observation. J. Appl. Meteorol. 1981a; 20: 9–19.
- Fritsch J. M. , Maddox R. A . Convective driven mesoscale weather systems aloft. Part II: numerical simulations. J. Appl. Meteorol. 1981b; 20: 20–26.
- Gray W. M . Global view of the origin of tropical disturbances and storms. Mon. Weather Rev. 1968; 96: 669–700.
- Gray W. M . The formation of tropical cyclones. Meteorol. Atmos. Phys. 1998; 67: 37–69.
- Gray W. M . Shaw D. B . Hurricanes: their formation, structure and likely role in the tropical circulation. Meteorology Over the Tropical Oceans. 1979; James Glaisher House, Berkshire: BMS. 155–218.
- Gray W. M . Seasonal forecasting. Global Guide to Tropical Cyclone Forecasting WMO Technical Document N 560. 1993; Switzerland: Geneva. 5.1–5.21. Tropical Cyclone Program Report N31.
- Harr P. A. , Elsberry R. L . Structure of a mesoscale convective system embedded in Typhoon Robyn during TCM-93. Mon. Weather Rev. 1996; 124: 634–652.
- Hart R. E . A cyclone phase space derived from thermal wind and thermal asymmetry. Mon. Weather Rev. 2003; 131: 585–616.
- Hendricks E. A. , Montgomery M. T . Rapid scan views of convectively generated mesovortices in sheared Tropical Cyclone Gustav (2002). Weather Forecast. 2006; 21: 1041–1050.
- Holland G. J . Tropical cyclone motion: a comparison of theory and observation. J. Atmos. Sci. 1984; 41: 68–75.
- Holland G. J. , Belanger J. , Fritz A . A revised model for radial profiles of hurricane winds. Mon. Weather Rev. 2010; 138: 4393–4401.
- Holland G. J. , Leslie L. M. , Ritchie E. A. , Dietachmayer G. S. , Klink M. , co-authors . An interactive analysis and forecasting system for tropical cyclone motion. Weather Forecast. 1991; 6: 415–423.
- Hong S.-Y. , Dudhia J. , Chen S.-H . A revised approach to ice microphysical processes for the parameterization of clouds and precipitation. Mon. Weather Rev. 2004; 132: 103–120.
- Houze R . Mesoscale convective systems. Rev. Geophys. 2004; 42: 4003.
- Houze R . Clouds in tropical cyclones. Mon. Weather Rev. 2010; 138: 293–344.
- Jorgensen D. P . Mesoscale and convective-scale characteristics of mature hurricanes. Part I: general observations by research aircraft. J. Atmos. Sci. 1984b; 41: 1268–1285.
- Jorgensen D. P . Mesoscale and convective scale characteristic of mature hurricanes. Part II: inner core structure of hurricane Allen (1984). J. Atmos. Sci. 1984a; 41: 1287–1311.
- Kain J. S . The Kain-Fritsch convective parameterization: an update. J. Appl. Meteorol. 2004; 43: 170–181.
- Kalnay E. , Kanamitsu M. , Kistler R. , Collins W. , Deaven D. , co-authors . The NCEP/NCAR 40-year reanalysis project. Bull. Am. Meteorol. Soc. 1996; 77: 437–472.
- Kruk M. C. , Knapp K. R. , Levinson D. H. , Kossin J . A technique for combining global tropical cyclone best track data. J. Atmos. Ocean. Technol. 2010; 27: 680–692.
- Lander M. A . Description of a monsoon gyre and its effect on the tropical cyclones in the western North Pacific during August 1991. Weather Forecast. 1996; 9: 640–654.
- Lee C.-S. , Cheung K. K. W. , Hui J. S. N. , Elsberry R. L . Mesoscale features associated with tropical cyclone formations in the western North Pacific. Mon. Weather Rev. 2008; 26: 2006–2022.
- Leslie L. M. , Holland G. J . On the bogussing of tropical cyclones in numerical models: a comparison of vortex profiles. Meteorol. Atmos. Phys. 1995; 56: 101–110.
- Luo J. , Behera S. , Masumoto Y. , Yamagata T . Impact of global ocean surface warming on seasonal-to-interannual climate prediction. J. Clim. 2011; 24: 1626–1646.
- Maddox R. A . Mesoscale convective complexes. Bull. Am. Meteorol. Soc. 1980; 16: 1374–1387.
- Maloney E. D. , Hartmann D. L . Modulation of hurricane activity in the Gulf of Mexico by the Madden-Julian Oscillation. Science. 2000; 287: 2002–2004.
- McBride J. L. , Fraedrich K . CIS: A theory for the response of tropical convective complexes to variations in sea surface temperature. Quart. J. Roy. Meteor. Soc. 1995; 121: 783–796.
- Miller D. , Fritsch J. M . Mesoscale convective complexes in the western Pacific region. Mon. Weather. Rev. 1991; 117: 2978–2922.
- Montgomery M. T. , Nicholls M. E. , Cram T. A. , Saunders A. B . A vortical hot tower route to tropical cyclogenesis. J. Atmos. Sci. 2006; 63: 355–386.
- Nolan D. S. , Moon Y. , Stern D. P . Tropical cyclone intensification from asymmetric convection: energetics and efficiency. J. Atmos. Sci. 2007; 64: 3377–3405.
- Ookuchi K. , Yoshimura J. , Yoshimura H. , Mizuta R. , Kusunoki S. , co-authors . Tropical cyclone climatology in a global warming climate as simulated in a 20-km-mesh global atmospheric model: frequency and wind intensity analysis. J. Meteorol. Soc. Jap. 2006; 84: 259–276.
- Powell M. , Soukup G. , Cocke S. , Gulati S. , Morisseau-Leroy N. , co-authors . State of Florida hurricane loss prediction model: atmospheric science component. J. Wind Eng. Ind. Aerodyn. 2005; 93: 651–674.
- Reasor P. D. , Montgomery M. T. , Bosart L. F . Mesoscale observations in the genesis of Hurricane Dolly (1996). J. Atmos. Sci. 2005; 62: 3151–3171.
- Ren D . Effects of global warming on wind energy availability. J. Renew. Sustain. Energ. 2010; 2: 052301.
- Ren D . The devastating Zhouqu Storm-triggered debris flow of August 2010: likely causes and possible trends in a future warming climate. J. Geophys. Res. 2014a; 119: 3643–3662.
- Ren D . Storm-Triggered Landslides in a Warming Climate. 2014b; New York: Springer.
- Ren D. , Fu R. , Leslie L. M. , Dickinson R. E . Predicting storm-triggered landslides. 2011; 92: 129–139. BAMS.
- Ren D. , Leslie L. M . Three positive feedback mechanisms for ice sheet melting in a warming climate. J. Glaciol. 2011; 57(206): 1057.
- Ritchie E. A. , Holland G. J . Scale interactions during the formation of Typhoon Irving. Mon. Weather Rev. 1997; 125: 1377–1396.
- Ritchie E. A. , Holland G. J . Large-scale patterns associated with tropical cyclogenesis in the western Pacific. Mon. Weather Rev. 1999; 127: 2027–2043.
- Rogers R. F. , Fritsch J. M . Surface cyclogenesis from convectively driven amplification of midlevel mesoscale convective vortices. Mon. Weather Rev. 2001; 129: 605–637.
- Schulz J. , Meywerk J. , Ewald S. , Schlussel P . Evaluation of satellite-derived latent heat fluxes. J. Clim. 1997; 10: 2782–2795.
- Shapiro L. J . The motion of Hurricane Gloria: a potential vorticity diagnosis. Mon. Weather Rev. 1996; 124: 1497–2508.
- Shapiro L. J. , Franklin J. L . Potential vorticity asymmetries and tropical cyclone motion. Mon. Weather Rev. 1999; 127: 124–131.
- Sippel J. A. , Nielsen-Gammon J. W. , Allen S. E . The multiple-vortex nature of tropical cyclogenesis. Mon. Weather Rev. 2006; 134: 1796–1814.
- Skamarock W. C. , Klemp J. B. , Dudhia J. , Gill D. O. , Barker D. M. , co-authors . A description of the Advanced Research WRF Version 3.
- Tory K. J. , Frank W. M . Chan J. C. L. , Kepert J. D . Tropical cyclone formation. Global Perspectives on Tropical Cyclones: From Science to Mitigation. 2010; World Scientific on Asia-Pacific Weather and Climate, Volume 4, World Scientific Publishing Co. Pty. Ltd., Singapore. 55–91.
- Walsh K. , Fiorino M. , Landsea C. , McInnes K . Objectively-determined resolution-dependent threshold criteria for the detection of tropical cyclones in climate models and reanalyses. J. Clim. 2007; 20: 2307–2314.
- Webster P. , Holland G. , Curry J. , Chang H . Changes in tropical cyclone number, duration, and intensity in a warming environment. Science. 2005; 309: 1844–1846.
- Wheeler M. , Hendon H . An all-season real-time multivariate MJO index: development of an index for monitoring and prediction. Mon. Weather Rev. 2004; 132: 1917–1932.
- Wu C. , Emanuel K. A . Interaction of a baroclinic vortex with background shear: application to hurricane movement. J. Atmos. Sci. 1993; 50: 62–76.
- Wu L. , Wang B . Assessing impact of global warming on tropical cyclone tracks. J. Clim. 2004; 17: 1686–1698.
- Yanai M. , Esbensen S. , Chu J . Determination of bulk properties of tropical cloud clusters from large-scale heat and moisture budgets. J. Atmos. Sci. 1973; 30: 611–627.
- Zehr R. M . Tropical Cyclogenesis in the Western North Pacific. 1992; Washington, DC: U. S. Department of Commerce. 181. NOAA Technical Report NESDIS 61.