
Abstract
Based on the final analyses data (FNL) of the Global Forecasting System of the National Centers for Environment Prediction (NCEP) and the radiosonde data over the Tibetan Plateau, evolutions of two types of the Tibetan Plateau vortices, moving-off the plateau (Type A) and dying-out on the plateau (Type B), are investigated respectively. Compared to Type B vortices, the large-scale circulations associated with Type A vortices show stronger ridge to the north of the plateau and deeper trough near the Bay of Bengal at 500 hPa, and the southwesterly flow from the trough and the northwesterly flow from the ridge converge more intensively to the east of Type A vortices. Meanwhile, at 200 hPa the divergence on the right-hand side of the upper westerly jet is just over the vortices. The convergence at 500 hPa and divergence at 200 hPa provide favourable conditions for the development and eastward motion of the vortices. The diagnoses of the potential vorticity (PV) budgets reveal that in the developing stages of the two types of vortices, the vertical distribution of the atmospheric heat source determines both their intensity and the moving direction. In the decaying stage, the maintenance and eastward movement for Type A vortices mainly depend on the convergence of the strong northwesterly and southwesterly to the east of the vortices. For Type B vortices, the vertical PV flux divergence caused by the ascending motion around the vortices reduces the intensity of the vortices and is unfavourable for their eastward motion.
1. Introduction
In boreal summer, the low-level cyclonic vortices forming over the Tibetan Plateau (hereafter the plateau vortices) are the major mesoscale rain-producing systems over the Tibetan Plateau. Most of the vortices originate over the central-western plateau, and decay over the eastern plateau, especially over the sloping terrain at the eastern edge of the Tibetan Plateau. Some of them can maintain a long time and move eastward out of the plateau (Wang et al., Citation2009). The vortices moving off the plateau often trigger heavy rainfall to the east of the Tibetan Plateau, and even give rise to disastrous weather events over eastern China (Ye and Gao, Citation1979; Qiao and Zhang, Citation1994; Li, Citation2002). The typical spatial scale of a plateau vortex is about 400–800 km in the horizontal and 2–3 km in the vertical. Its cyclonic circulation is primarily confined to the lower-middle troposphere, with positive vorticity reaching maximum at 500 hPa and disappearing above 400 hPa (Ye and Gao, Citation1979; Lhasa Group for Tibetan Plateau Meteorology Research, Citation1981; Luo, Citation1992; Luo et al., Citation1994).
Previous studies on the large-scale circulation associated with the plateau vortices show that the divergence in the upper troposphere, the eastward stretching of the South Asia High and the enhancement of the upper jet stream are favourable for the eastward shifting of the plateau vortices (Liu and Fu, Citation1985; Gao and Yu, Citation2007; Yu et al., Citation2007a). At 500 hPa, three types of vortices, lying behind a ridge, in front of a westerly trough, or on a shear line, could move out of the plateau (Liu and Fu, Citation1985). Meanwhile, a northward shift of the monsoon trough over the Bay of Bengal, westward extension of the subtropical western Pacific high, or an shear lines over the eastern plateau, could be also favourable for the vortices to move off the plateau (Gao and Yu, Citation2007; Gu et al., Citation2010). Yu (Citation2002) claimed that the plateau vortices would be stable when a water vapour centre in the upper-middle troposphere locates to their west, move eastward when the centre is to its east and die out along with the disappearing of the water vapour centre. Furthermore, the invading of cold air could influence the intensity and route of the vortices moving off the plateau (Yu et al., Citation2007b; Yu et al., Citation2008; He et al., Citation2009; Gu et al., Citation2010).
A lot of studies have found that the initiation, development and eastward movement of the vortices are affected by the thermodynamics, among which the diabatic heating would be the leading factor. It is pointed out that the sensible heating exerts a major effect on the formation of the vortices, while the condensation latent heat release is most important during their development phase (Lhasa Group for Tibetan Plateau Meteorology Research, Citation1981; Dell'Osso and Chen, Citation1986; Shen et al., Citation1986a, Citation1986b; Wang, Citation1987; Li and Zhao, Citation2002). Ding and Lu (Citation1990) used a five-layer primitive equation model to simulate the eastward movement of a vortex over the Tibetan Plateau. They suggested, however, diabatic factors, such as radiation and large-scale condensation latent heat, might only affect the intensity of the vortex. Luo et al. (Citation1991) found that the genesis, development and decay of the plateau vortices are closely interrelated with variations of the atmospheric heat field. Simulation of three vortices showed that their disappearances in the sloping terrain of the eastern Tibetan Plateau might be owed to the weakening of the surface heating (Chen et al., Citation1996). By diagnosing a vortex case, Li et al. (Citation2011) pointed out that the atmospheric heat source not only affects the intensity of the vortex, but also influences its eastward movement.
The aforementioned research examined the features of the large-scale circulation and revealed the prominent factors affecting the development and eastward movement of the vortex. However, previous research stressed different aspects affecting the evolution of the plateau vortices, and some results conflicted with each other. Moreover, most conclusions were drawn only by case study. Therefore, it is necessary to investigate the evolution mechanisms of the plateau vortices with more cases and to distinguish the dynamic and thermodynamic roles played in their evolution for the two types of plateau vortices of moving-off the plateau and dying-out on the plateau. In the present study the composite analysis is applied to investigate the roles of dynamic effects and the atmospheric heat source played in the evolution process of the vortices. In addition, we also compare the difference of the evolution mechanisms between the vortices moving off and not moving off the Tibetan Plateau. In Section 2, we describe the data and method. The large-scale circulations for the two types of vortices are compared in Section 3. The major factors accounting for the eastward movement of the vortices are discussed in Section 4. In Section 5, we analyse the evolution process of the vortices through diagnosing the potential vorticity (PV) equation and discuss the evolution and movement mechanisms of the vortices moving off the plateau and the ones that dying out on the plateau, respectively. The effect of the atmospheric heat source on the moving direction and intensity of the vortices is discussed in Section 6. Summary and discussion are given in Section 7.
2. Data and method
2.1. Data
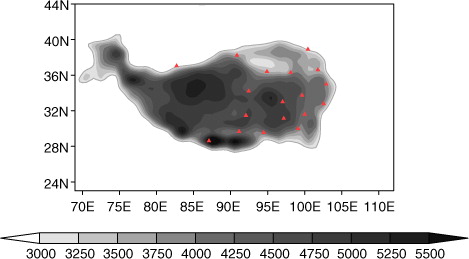
The 500-hPa winds from radiosonde data observed twice a day over the Tibetan Plateau, provided by the National Meteorological Information Center of the China Meteorological Administration, are used to choose cases of the plateau vortices, and the spatial distribution of the radiosonde stations is shown in . The final analyses data (FNL) from the Global Forecasting System of the National Centers for Environmental Prediction (NCEP) with 6-hour intervals and 1°×1° horizontal resolution is used to analyse the large-scale circulation and possible mechanism associated with the evolution of the plateau vortices. Both of the datasets span from May to September during 2000–2008.
Fig. 1 Spatial distribution of the radiosonde stations (red triangles) over the Tibetan Plateau. The shadings indicate the elevation.
2.2. Selection of the plateau vortices
As defined by the Lhasa Group for Tibetan Plateau Meteorology Research (Citation1981), a Tibetan Plateau vortex is a low which forms over the Tibetan Plateau with closed contour lines or cyclonic winds at three observation stations at 500 hPa. Considering the terrain of the Tibetan Plateau, a vortex moving eastward beyond 100°E is defined as a moving-off vortex (Liu and Fu, Citation1985; He et al., Citation2009) and a vortex which dies out over the plateau as a non-moving-off vortex. We classify the moving-off vortices as Type A, and the non-moving-off ones as Type B in the following discussion.
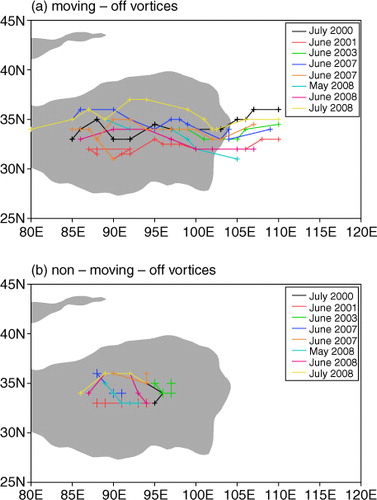
To avoid the effect of different climatological backgrounds on the two types of plateau vortices, we choose the vortices moving off the plateau and dying out over the plateau in pairs and occurring in the same year and the same month. Based on these conditions, 16 cases, eight moving-off vortices and eight non-moving-off vortices, are selected in the present study. The selected vortices of Type A and Type B as well as the tracks of their centres are shown in . In order to make sure that the FNL data can basically present the circulations associated with the observed vortices, in each case we compared the locations of the vortex observed by the radiosonde data to those in FNL data. The distance between the vortex centres derived from these two datasets in each case is less than 2 degrees in both zonal and meridional directions. In fact, Li et al. (Citation2014) compared the occurrence frequency of the Tibetan Plateau vortices in FNL data to that in observations and found that they are inconsistent, indicating the good capability of FNL data in reflecting the Tibetan Plateau vortices.
Fig. 2 Selected (a) eight moving-off vortices (Type A) and (b) eight non-moving-off vortices (Type B) as well as their tracks. The shading indicates the area with altitude over 3000 m. The cross (+) in each track denotes the centre position of the vortex at the time interval of 6 hours.
2.3. Dynamic composite method
Because the plateau vortices belong to the mesoscale system and some of them move fast, the composite of them would smooth down their spatial features if traditional composite methods are used. Thus, referring to the composite method used in the previous research on the synoptic systems (Frank, Citation1977; Gray, Citation1981; Li et al., Citation2004), we use a dynamic composite method to analyse the common features of the meteorological elements associated with the evolutions of vortices. The so-called ‘dynamic composite method’ is to take the centre of the vortex concerned as the origin of coordinates, which moves along with the vortex, then to make a composite in the moving coordinate system for every case with a same limited scope at each time. Thus, the origin of the coordinates is the composite centre, and the coordinates represent the distances to the composite centre. The composite formula (Li et al., Citation2004) is written as follows:1
where N is the case number of the vortices used for the composite, equal to eight in the present work. S
tn
(x, y) and denote meteorological variables of one case and the composite of eight cases at time t, respectively. The x and y are the relative coordinates from the centres of vortices in degrees of latitude and longitude, respectively.
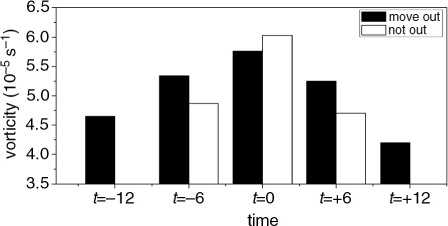
We define the time when the vertical vorticity of a vortex is largest as t=0, and for Type A vortices, the times 6 hours and 12 hours before as t=−6 and t=−12, and after as t=+6 and t=+12, respectively. For Type B vortices, we only choose the times 6 hours prior and after as t=−6 and t=+6, respectively, because of their short life spans. The evolutions of intensity for both types of vortices are shown in . Our analysis showed that Type A vortices are enhanced gradually when they move towards the sloping terrain in the eastern edge of the Tibetan Plateau (about 100°E–103°E), and become strongest when they arrive there; the vortices are weakened obviously after they go beyond there.
Fig. 3 Vertical vorticity at 500 hPa averaged in a square region (2°×2°) around the centre of the composite vortices (unit: 10−5 s−1). The black and white bars are for Type A and Type B vortices, respectively.
2.4. Apparent heat source and apparent moisture sink
We calculate the atmospheric apparent heat source (Q
1) and the apparent moisture sink (Q
2) based on the thermodynamic equation and the moisture equation. The equations used are as follows (Yanai et al., Citation1973; Ding, Citation1989):2
3
where T is the temperature, V and ω denote the horizontal wind vector and the vertical wind component in pressure coordinates, respectively. P
0 is the pressure of 1000 hPa. c
p
represents the specific heat at constant pressure, and κ≈0.286. θ is the potential temperature. L denotes the latent heat of condensation, and q is the specific humidity. The vertically integrated forms of Q
1 and Q
2 can be written as follows:4
5
Here, <Q 1> and <Q 2> are vertically integrated Q 1 and Q 2, respectively. P, S and E represent the amount of precipitation, surface sensible heat flux and eddy moisture flux, respectively. <Q R > denotes radiative heating (cooling).
2.5. PV budget
In order to understand the role of the atmospheric heat source played in the evolution of the plateau vortex, the Ertel PV equation (Hoskins et al., Citation1985; Wu, Citation2001) is utilised to analyse the PV budget. The PV tendency equation without the friction effect can be given as:6
where P
E
represents Ertel PV, α is the specific volume and ζa=( f k+∇
3
×V) is the absolute vorticity with k and V denoting the unit vector in the z-direction and wind vector, respectively. Q is the diabatic heating rate. The PV in pressure coordinates is7
where θ is the potential temperature, f is the Coriolis parameter, u and v represent zonal and meridional winds, respectively. After approximation and coordinate transformations (Li et al., Citation2011), eq. (6) can be written as8
where is the vertical vorticity. The first two terms on the right-hand side of eq. (8) are the horizontal PV flux divergences. The third term is the vertical PV flux divergence. The fourth and fifth terms are related to redistribution of PV induced by the horizontally uneven distribution of Q, while the sixth term arises from the vertically uneven distribution of Q. Equation (8) indicates that contributions to the local PV change come from the horizontal and vertical PV flux divergences, as well as the PV redistributions due to the spatially uneven distribution of Q (Pan et al., Citation2008). In our calculation, we take Q
1 as Q to discuss the effect of the atmospheric heat source on the evolution of the vortices.
3. Features of the large-scale circulation
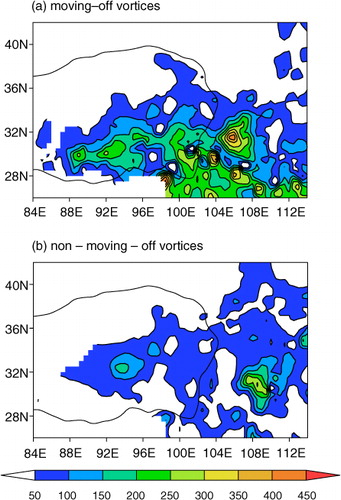
The accumulated rainfall associated with the two types of vortices is shown in . It can be seen that type A vortices trigger heavy rainfall between 28°N and 35°N over both the Tibetan Plateau and to its east, and the centres of the precipitation show zonal distribution (a). Meanwhile, for Type B vortices (b), the rainfall is mainly over the plateau and the amount is less than that produced by the moving-off ones, with a much weaker rainfall centre located at about 32°N, 94°E. Although in b there is another rainfall centre at about 31°N, 109°E, this increase in rainfall should have no direct relation to the plateau vortices because the vortices, as seen in b, are over the central part of the Tibetan Plateau.
Fig. 4 The observed accumulated rainfall for all cases of (a) Type A and (b) Type B vortices (unit: mm).
To investigate the similarities and differences in large-scale circulations between the two types of vortices when they are over the Tibetan Plateau, we compare the circulation composites at 500 and 200 hPa, respectively. For Type A vortices, the times for composite are from t=−12 to 0, and for Type B vortices from t=−6 to +6.
3.1. 500 hPa
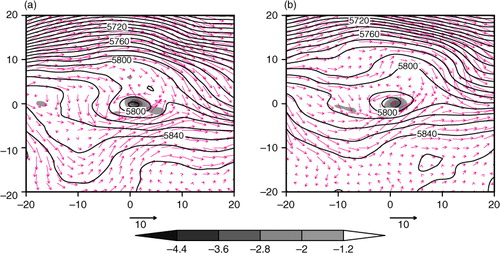
presents the composites of the circulations at 500 hPa for Type A and Type B vortices, respectively, when they are over the plateau. For both types of vortices, the westerlies from the west of the plateau are split into two branches. The southern branch forms a low pressure trough flowing around the Bay of Bengal, while the northern one forms a pressure ridge to the north of the plateau. The northwesterly winds from the ridge and the southwesterly winds from the trough converge to the east of the vortices. For Type A vortices (a), the ridge to the north and the trough to the south of the vortices as well as the winds invading into the region to the east of the vortices are much stronger than those for Type B vortices (b). The stronger cyclonic shear and convergence to the east of Type A vortices should be favourable for the maintenance and eastward moving of Type A vortices. Besides, the subtropical high to the southeast of vortices is stronger and extends further west for Type A vortices, which enhances the transport of the warm and wet southwesterly flow from the Bay of Bengal to the east of the vortices, making a stronger convergence of the cold and warm air to the east of the vortices.
Fig. 5 Composites of 500 hPa winds (vectors; unit: m s−1), geopotential heights (contours; unit: gpm) and divergence (shadings; unit: 10−5 s−1) when the plateau vortices are over the Tibetan Plateau for (a) Type A and (b) Type B vortices. The composite period is from t=−12 to t=0 for Type A vortices and from t=−6 to t=+6 for Type B vortices. The coordinates in the x-axis and y-axis are the relative coordinates from the centres of vortices in zonal and meridional directions (unit: degree), respectively.
3.2. 200 hPa
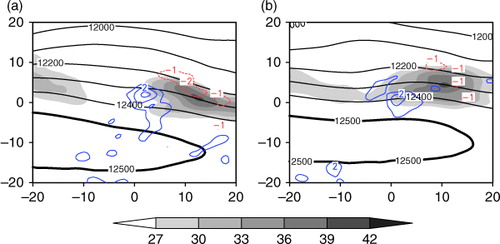
shows the composites of geopotential heights and wind speeds at 200 hPa for the two types of the vortices when they are over the Tibetan Plateau. It can be seen that there is a strong jet stream to the northeast of the vortices, and the South Asia High (area enclosed by the contour of 12 500 gpm) lies to the south of the vortex. The upper-level divergence on the right-hand side of the jet core is favourable for the formation and maintenance of the plateau vortices. For Type A vortices (a), the jet core is located further southeastward, and the South Asia High is further south, compared to Type B vortices (b). The contours to the east of the vortices diverge more obviously for Type A vortices. The stronger upper-level divergence tends to strength the ascending motion, which is helpful for Type A vortices to enhance and move eastward. In fact, the vertical velocity at 500 hPa around the vortices (figure not shown) reveals that the ascending motions around the centre and to the east of Type A vortices are remarkably stronger than those for Type B vortices. Besides, the stronger ascending motion is favourable for triggering heavier rainfall near and to the east of the vortices, which are in agreement with the rainfall shown in .
Fig. 6 Same as , but for the 200 hPa geopotential heights (black contours; unit: gpm), wind speeds (shadings; unit: m s−1) and divergence (colour contours; unit: 10−5 s−1). The 12 500 gpm contour is darkened to denote the South Asia High. The coordinates are the same as those in .
4. Spatial distribution of the atmospheric heat source
In order to investigate the roles of heat sources in the evolution process of Type A and Type B vortices, we will discuss the spatial distribution of heat sources using the apparent heat source (Q 1) and apparent moisture sink (Q 2).
4.1. Horizontal distributions
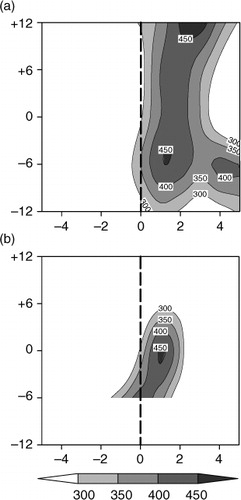
presents time-zonal cross-sections of the vertically integrated atmospheric heat source (<Q 1>). During the eastward moving of the vortices, the centre of <Q 1> is always located to the east of the centre of the vortices. In fact, the southwesterlies from the trough in the south and the northwesterlies from the ridge in the north converge and trigger updraft to the east of the centre of the vortices, which is favourable for the release of the water vapour condensation heating and thus large <Q 1> over there. During the developing stage, the intensity of <Q 1> for both Type A and Type B vortices are comparable. However, in the decaying stage, the <Q 1> for Type B vortices weakens more rapidly and is obviously weaker than that for Type A vortices.
Fig. 7 Time-zonal cross-sections of the composites of the vertically integrated atmospheric apparent heat source (<Q 1>) (shadings; unit: W m−2) averaged from 2° north to 5° south for (a) Type A and (b) Type B vortices, respectively. The thick dotted lines denote the composite centre of the vortices at each time. The coordinates in the x-axis are the relative coordinates from the centres of vortices in zonal direction (unit: degree), and the y-axis indicates the time.
4.2. Vertical distributions
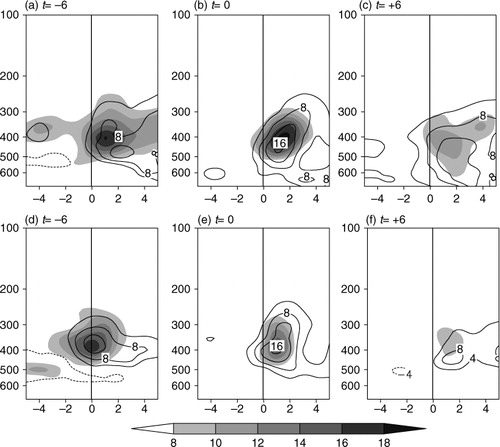
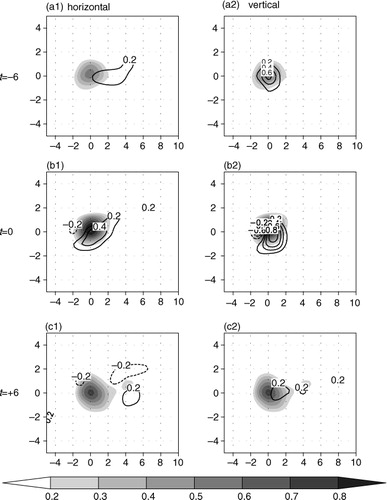
Height-zonal cross-sections of Q 1 and Q 2 averaged from 2° north to 5° south are given in . For both types of vortices, in the developing stage (t=−6 and 0), the vertical features of Q 1 and Q 2 are similar, and the maximums of both Q 1 and Q 2 appear at 400–450 hPa to the east of the vortices, indicating that the released latent heat is the major component of the atmospheric heat source. At t=−6 and 0, the Q 1 associated with Type A vortices is stronger than that with Type B vortices. In the decaying stage (t=+6), the heating centres of Q 1 are also located to the east of the vortices, and their intensities become weaker compared to those at previous times. The released latent heat is still the major component of the atmospheric heat source in this stage. However, the heating centre of Q 1 associated with Type A vortices is near 500 hPa, while that with Type B vortices remains around 400 hPa.
Fig. 8 Height-zonal cross-sections of the atmospheric apparent heat source (Q 1) (shadings) and apparent moist sink (Q 2) (contours) averaged from 2° north to 5° south (unit: K d−1). The upper panel (a–c) is for Type A vortices and the lower panel (d–e) for Type B vortices at times from t=−6 to +6, respectively. The coordinates in x-axis are the relative coordinates from the centres of vortices in zonal direction (unit: degree), and the y-axis indicates the height (unit: hPa).
5. Mechanisms for the development and eastward movement of the vortices
In order to understand the role played by the atmospheric heat source in the evolution of the vortices, the Ertel PV equation (Hoskins et al., Citation1985; Wu, Citation2001) is utilised to analyse the PV budgets for the two types of vortices.
gives the composites of PV budgets for Type A vortices. Type A vortices continue to enhance from t=−12 and become strongest at t=0. Then they weaken obviously from t=+6 to +12 when moving down the sloping terrain in the eastern edge of the Tibetan Plateau. When the vortices move eastward on the plateau, the northwesterly and southwesterly winds at 500 hPa converge
to the east of the centre of the vortices (a). As shown in , in the developing stage from t=−12 to 0, positive PV tendency caused by the horizontal PV flux convergence () is located around the centre of vortices and to its east (a1, b1 and c1), thus the PV there will increase, which is helpful to the development and eastward movement of the vortices. Meanwhile, since the vortices are located below the right-hand side of the upper westerly jet core at 200 hPa (a), the upper-level divergence and low-level convergence are favourable for the ascending motion to the east of the vortices. The ascending motion transports the PV upward, leading a negative contribution (
<0) around the centre of the vortices and to its east (a2, b2 and c2). In addition, the water vapour around the vortex converges because of the convergent winds at 500 hPa, which elevates the water vapour, then the latent heat is released, and Q
1 is mainly sourced from the condensation latent heating (a and b). The effect of Q
1 (
) can intensify the upward motion and cause a positive PV tendency around the centre of the vortices and to its east, which is favourable for the development and eastward movement of the vortex (a3, b3 and c3). Therefore, the prominent factors attributing to the positive PV tendency is the contribution from the horizontal PV flux convergence and the effect of Q
1, and the latter is larger than the former.
Fig. 9 PV budgets (contours; unit: PVU (6 h)−1, 1PVU=10−6 m2 s−1 K kg−1) and 500 hPa PV (shadings; unit: PVU) for Type A vortices at times from t=−12 to +12. The contours in left, middle and right columns are the horizontal PV flux divergence, the vertical PV flux divergence and the effect of the atmospheric heat source, respectively. The panels from the uppermost (a1–a3) to the lowest (e1–e3) correspond to the times from t= − 12 to +12, respectively. The coordinates are the same as those in .
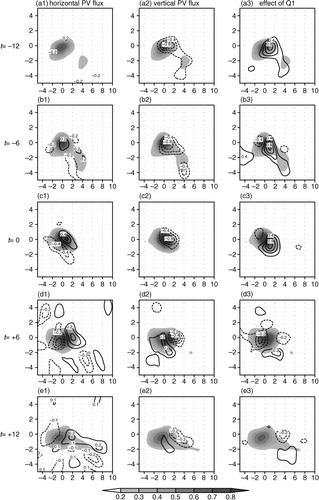
After the vortices reach the sloping terrain in the eastern edge of the plateau, the effect of Q 1 at 500 hPa is almost negative around the centre of the vortices and merely positive to the south of the vortices at t= + 6 (d3). The effect of the horizontal PV flux convergence is similar to those at previous times and the vertical PV flux convergence still has a negative contribution to the east of the vortices. Therefore, in the decaying stage, the convergence to the east of the vortices between the southwesterly and southeasterly winds at 500 hPa is the prominent factor attributing to the maintenance and eastward movement of the vortex, while the atmospheric heat source is too weak to behave as it did during the earlier development period.
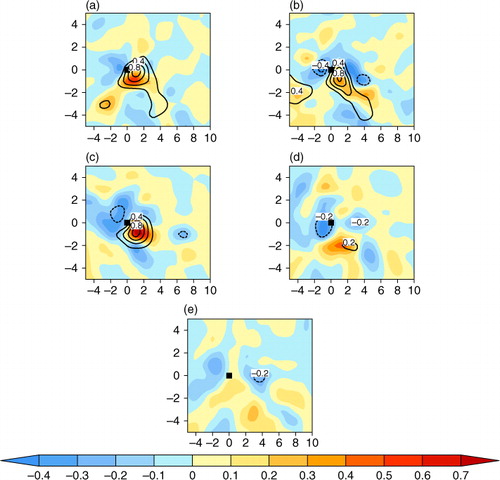
In , we show the total net contributions to the PV tendency from the horizontal PV flux divergence, the vertical PV flux divergence and the effect of the atmospheric heat source (Q 1). We can see that the distribution of the effect of Q 1 and that of the net PV budgets are similar, implying that Q 1 plays a prominent role on the intensity and eastward movement of the vortices, which coincides with the result of the case study by Li et al. (Citation2011). The positive net PV budget appears to the east and southeast of the centre of the vortices in the whole period, which is favourable for the development and eastward movement of the vortices. In the developing stage (a, b and c), the positive net PV budget is mainly contributed by the PV tendency induced by the atmospheric heat source. However, in the decaying stage (d and e) the contribution from the PV tendency induced by Q 1 becomes much weaker. At this stage, as seen in , the development and eastward movement of the vortices is mainly due to the horizontal PV flux divergence.
Fig. 10 Net PV budgets (shadings) from the horizontal PV flux divergence, vertical PV flux divergence and the effect of Q 1 (contours) for Type A vortices at (a) t= − 12, (b) t= − 6, (c) t=0, (d) t= + 6 and (e) t= + 12, respectively (unit: PVU (6 h)−1, 1PVU = 10−6 m2 s−1 K kg−1). The coordinates are the same as those in .
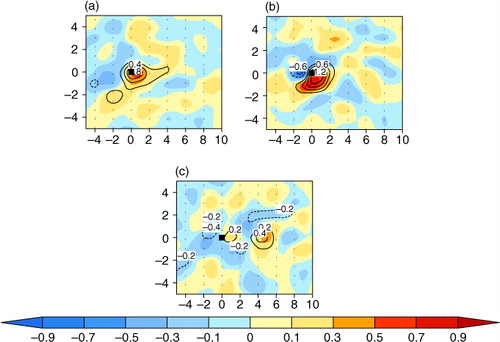
In , we show the PV budgets contributed from each of the horizontal PV flux divergence, vertical PV flux divergence, and the effect of Q 1 for Type B vortices, and the net PV budgets are shown in . The intensity of the vortices is increasing from t=−6, and reaches the maximum at t=0. During this period, the vortices are also located below the right-hand side of the upper westerly jet core at 200 hPa (b), and the northwesterly and southwesterly winds at 500 hPa converge to the east of the vortices (b). Upward motion as well as the condensation latent heating are caused by the convergence accordingly. As seen in , the horizontal PV flux convergence and the effect of Q 1 have positive effects on the PV tendency, and the latter is much larger than the former (a1, a3, b1 and b3). On the contrary, the vertical PV flux divergence induces a negative PV tendency around the vortices (a2 and b2). Their co-actions induce a positive PV net budget in the centre of the vortices and to its east (a and b). In addition, the distribution of the effect of Q 1 is similar to that of the net PV budgets at these two times, indicating that Q 1 plays a prominent role in the intensity and eastward movement of the vortices, which is consistent with the conclusion drawn in developing stage of Type A vortices. At t=+6, Type B vortices weaken. The convergence and ascending motion to the east of the vortices become weaker than those at the previous two times and in the decaying stage of Type A vortices. As seen in c1 and c3, the positive contribution from the horizontal PV flux convergence is faint, and the effect of Q 1 reduces greatly, leaving only a small positive contribution to the east of the vortices (c). Thus, the negative effect from the vertical PV flux divergence becomes comparatively important due to the large reduction of the contribution from Q 1, leading to a negative net PV budget around the centre of the vortices, and having a negative effect on the development and eastward movement of the vortices.
Fig. 11 Same as but for Type B vortices from t= − 6 to +6. The panels from the uppermost (a1–a3) to the lowest (c1–c3) correspond to the times from t= − 6 to +6, respectively. The coordinates are the same as those in .
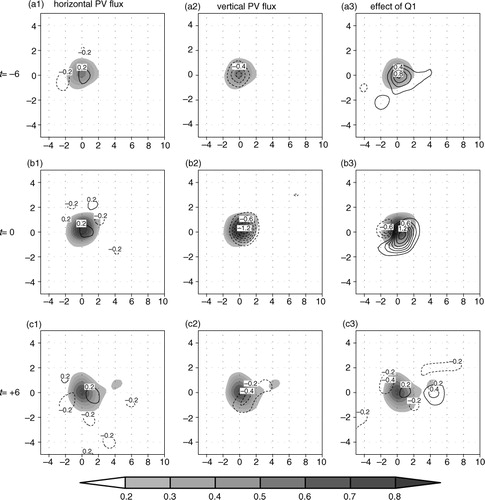
Fig. 12 Same as but for Type B vortices at (a) t=−6, (b) t=0 and (c) t=+6, respectively. The coordinates are the same as those in .
6. Role of the atmospheric heat source on the plateau vortices
In order to further illustrate the role of Q
1 in the evolution of the vortices, we calculate separately the effects of the horizontal distribution () and the vertical distribution (
) of Q
1 on PV tendency, and the results are shown in and for Type A and Type B vortices, respectively.
Fig. 13 500 hPa PV (shadings; unit: PVU, 1PVU=10−6 m2 s−1 K kg−1) as well as the PV tendency contributed from the horizontal (left column) and vertical (right column) distributions of the atmospheric heat source [contours; unit: PVU (6 h)−1] for Type A vortices. The panels from the uppermost (a1, a2) to the lowest (e1, e3) correspond to the times from t=−12 to +12, respectively. The coordinates are the same as those in .
![Fig. 13 500 hPa PV (shadings; unit: PVU, 1PVU=10−6 m2 s−1 K kg−1) as well as the PV tendency contributed from the horizontal (left column) and vertical (right column) distributions of the atmospheric heat source [contours; unit: PVU (6 h)−1] for Type A vortices. The panels from the uppermost (a1, a2) to the lowest (e1, e3) correspond to the times from t=−12 to +12, respectively. The coordinates are the same as those in Fig. 5.](/cms/asset/c9e61297-c965-4545-8bb4-02c72105a4a0/zela_a_11817008_f0013_ob.jpg)
Fig. 14 Same as but for Type B vortices. The panels from the uppermost (a1, a2) to the lowest (c1, c2) correspond to the times from t=−6 to +6, respectively. The coordinates are the same as those in .
As shown in , during the developing stage of Type A vortices (from t=−12 to 0), the vertical distribution of Q
1 is remarkably larger than the horizontal distribution, indicating that the effect of Q
1 on the enhancement and eastward movement of the vortices is mainly from the positive PV tendency caused by the vertical distribution of Q
1. At these times, the maximum of Q
1 around the vortices appeared at 400–450 hPa (a and b). Therefore, at 500 hpa, −>0, which is helpful for the maintenance and enhancement of the cyclonic circulation at that level. In the decaying stage (from t=+6 to +12), the vertical distribution of Q
1 has faint positive contribution to the PV tendency, and even exerts negative influence in some areas (d2 and e2), which correspond well to a weak
because the maximum of Q
1 falls down to 500 hPa (c) at this stage. As seen in d1 and e1, in the decaying stage the horizontal distribution effect becomes prominent. The negative PV tendency from the horizontal distribution of Q
1 around the vortices weakens the vortices. Such features can be explained as follows. The horizontal vortex tube (
) around the vortex centre is to be slanted because the Q
1 centre is to the south of the vortex at 500 hPa and thus
, leading to a negative vertical vorticity component which reduces the vortex intensity (
<0).
During the developing stage of Type B vortices, the effect of the vertical distribution of Q 1 is much more prominent to induce a positive PV tendency around (t=−6 in a2) and in the east part of the vortices (t= 0 in b2) because the maximum of Q 1 is at 400–450 hPa (d and e). Compared to the vertical distribution, the effect of the horizontal distribution of Q 1 is much weaker, which is similar to that for Type A vortices during the developing stage. Meanwhile, the effect of the vertical distribution of Q 1 does not extend to the east of the vortices, which restricts the eastward moving of Type B vortices. At the decaying stage (t=+6), because the intensity of Q 1 weakens obviously (f) the vortices become weaker. However, since the maximum of Q 1 still appears at 400–450 hPa (f), a weak contribution from its vertical uneven distribution can also be seen (c2).
7. Summary and concluding remarks
In this paper, we investigate the evolution mechanisms of the vortices moving off the plateau (Type A) and the vortices dying out over the plateau (Type B), respectively, through dynamic composite analyses. It is found that both the intensity and movement of the two types of vortices depend on the interaction between the dynamic and thermodynamic effects over the Tibetan Plateau.
The large-scale circulations associated with two types of vortices when they are over the plateau are compared. At 500 hPa, the ridge to the north of the plateau and the trough near the Bay of Bengal for Type A vortices are much stronger than those for Type B. Stronger convergence exists to the east of Type A vortices where the northwesterly winds from the ridge meets the southwesterly winds from the trough. The southwesterly winds associated with Type A vortices are also strengthened by the westward extending of the western Pacific subtropical high. Meanwhile, at 200 hPa the divergence on the right-hand side of the westerly jet core for Type A vortices is stronger than that for Type B. The upper-level divergence and low-level convergence, as well as the latent heat release related to the ascending motion, are main factors affecting the development and eastward motion of the vortices. There is a close relationship between the dynamic effect of the large-scale circulations and the thermodynamic effect of the related atmospheric heat source, which exert significant influence on the evolution process of the vortices. The similarities and differences between their co-effects on the two types of vortices are as follows.
In the developing stage, no matter whether the vortices move off the Tibetan Plateau or not, the mechanisms for development and eastward movement of the two types of vortices are similar. The atmospheric heat source is the dominant factor for the eastward movement and development of the vortices. The centres of the vertically integrated atmospheric heat source (<Q 1>) are always located to the east of the vortices. The vertical uneven distribution of Q 1 heats up the atmospheric columns over and to the east of the vortices at middle and higher level and depresses the isobaric surface of 500 hPa, which are favourable for the development and eastward movement of the vortices.
In the decaying stages of the two types of vortices, the heating intensity of Q 1 becomes weaker than that in the develop stage, resulting in a weak effect on the vortices.
The intensity of Type A vortices decreases when they move into the sloping terrain in the east edge of the Tibetan Plateau. The maintenance and eastward movement of the vortices mainly result from the convergence of the northwesterly and southwesterly winds to the east of the vortices. Q 1 no longer promotes the development and eastward movement of the vortices as it does in the develop stage, but hinders on the contrary. The contribution from the vertical distribution of Q 1 is much weaker, and the negative effect of the horizontal distribution of Q 1 at 500 hPa becomes prominent. The uneven heating causes a horizontal vortex tube to slant at 500 hPa and weakens the vortices through the negative vertical vorticity component of slanted vortex tube. Meanwhile, the positive PV tendency to the east of the vortices induced by the horizontal PV flux convergence is favourable for the eastward movement of Type A vortices.
In the decay stage of Type B vortices, the convergence to the east of the vortices is very weak, resulting in weak updraft and latent heat release over there and thus weakened condensation latent heat. The negative contribution to PV tendency from the vertical PV flux divergence controls the region around the vortices, which is unbeneficial for the vortices to keep on developing.
It should be pointed out that the results here are derived from the dynamic composite analysis. Because of the heavy workload in calculation of the composite results, we choose 16 cases of the plateau vortices (eight moving-off vortices and eight non-moving-off ones). Our study is based on the FNL data in the 9-yr period from 2000 to 2008. There exist a few other reanalysis datasets with frozen analysis systems such as the NCEP CFSR (Saha et al., Citation2010), NASA MERRA (Rienecker et al., Citation2011) and ECMWF ERA-Interim (Dee et al., Citation2011). Because these reanalysis datasets cover more than 30 yr, it is necessary to verify their capability in reflecting the Tibetan Plateau vortices by comparing them to the observations in order to give more cases for the analysis. More cases for both types of vortices should be selected and numerical experiments should be performed in the future, to gain more credible conclusions on the evolution and movement mechanisms of the plateau vortices. In addition, because the topography can affect the dynamic and thermodynamic processes on the atmosphere over the Tibetan Plateau, and is an important factor affecting the evolution process of the vortices (Dell'Osso and Chen, Citation1986; Shen et al., Citation1986a; Wang, Citation1987), the influence of the topography on the evolution of the plateau vortices should also be investigated through numerical experiments in the future.
8. Acknowledgements
The authors are very grateful to the information centre of Chinese Academy of Meteorological Sciences for providing the observational data. The FNL data for this study are from the Research Data Archive (RDA) maintained by the Computational and Information Systems Laboratory (CISL) at the National Center for Atmospheric Research (NCAR). The original data are available from the RDA (http://dss.ucar.edu) in dataset number ds083.2. This work is supported by the National Natural Science Foundation of China (No. 41221064), and Special Fund for Tibetan Plateau research (GYHY201406001), the National Key Basic Research and Development Program (No. 2012CB417205), National Natural Science Foundation of China (No. 41275050), the Basic Scientific Research and Operation Foundation of the CAMS (No. 2013Z004 and No. 2014R008).
Related Research Data
References
- Chen B. M. , Qian Z. A. , Zhang L. S . Numerical simulation of formation and development of vortices over the Qinghai-Xizang Plateau in summer. Chin. J. Atmos. Sci. 1996; 20: 491–502. (in Chinese).
- Dee D. P. , Uppala S. M. , Simmons A. J. , Berrisford P. , Poli P. , co-authors . The ERA-Interim reanalysis: configuration and performance of the data assimilation system. Q. J. Roy. Meteorol. Soc. 2011; 137: 553–597.
- Dell'Osso L. , Chen S. J . Numerical experiments on the genesis of vortices over the Qinghai-Xizang Plateau. Tellus A. 1986; 38: 235–250.
- Ding Y. H . The Diagnostic Analysis Methods of Synoptic Dynamics. (in Chinese).
- Ding Z. Y. , Lu J. N . A numerical experiment on the eastward movement of a Qinghai-Xizang Plateau low vortex. J. Nanjing Inst. Meteorol. 1990; 13: 426–431. (in Chinese).
- Frank W. M . The structure and energetics of the tropical cyclone I: storm structure. Mon. Weather Rev. 1977; 105: 1119–1135.
- Gao W. L. , Yu S. H . Analyses on mean circulation field of the plateau low vortex moving out of the Tibetan Plateau. Plateau Meteorol. 2007; 26: 206–212. (in Chinese).
- Gray W. M . Recent Advance in Tropical Cyclone Research from Rawinsonde Composite Analysis. 1981; Geneva, Switzerland: WMO Program on Research in Tropical Meteorology, World Meteorological Organization. p. 407.
- Gu Q. Y. , Shi R. , Xu H. M . Comparison analysis of the circulation characteristics of plateau vortex moving out of and not out of the plateau. Meteorol. Mon. 2010; 36: 7–15. (in Chinese).
- He G. B. , Gao W. L. , Tu N. N . The dynamic diagnosis on eastwards moving characteristics and developing mechanism of two Tibetan Plateau vortex processes. Acta Meteorol. Sin. 2009; 67: 599–612. (in Chinese).
- Hoskins B. J. , McIntyre M. E. , Robertson A. W . On the use and significance of isentropic potential vorticity maps. Q. J. Roy. Meteorol. Soc. 1985; 111: 877–946.
- Lhasa Group for Tibetan Plateau Meteorology Research. Research of 500 hPa Vortices and Shear Lines Over the Tibetan Plateau in Summer. (in Chinese).
- Li G. P . The Tibetan Plateau Dynamic Meteorology. 2002; Beijing: China Meteorological Press. 271. (in Chinese).
- Li G. P. , Zhao B. J . A dynamical study of the role of surface sensible heating in the structure and intensification of the Tibetan Plateau vortices. Chin. J. Atmos. Sci. 2002; 26: 519–525. (in Chinese).
- Li L. , Zhang R. , Wen M . Diagnostic analysis of the evolution mechanism for a vortex over the Tibetan Plateau in June 2008. Adv. Atmos. Sci. 2011; 28: 797–808.
- Li L. , Zhang R. , Wen M . Diurnal variation in the occurrence frequency of the Tibetan Plateau vortices. Meteorol. Atmos. Phys. 2014. 125, 135–144.
- Li Y. , Chen L. S. , Wang J. Z . The diagnostic analysis on the characteristics of large scale circulation corresponding to the sustaining and decaying of tropical cyclone after its landfall. Acta Meteorol. Sin. 2004; 62: 167–197. (in Chinese).
- Liu F. M. , Fu M. J . A study on the moving eastward lows over Qinghai-Xizang Plateau. Plateau Meteorol. 1985; 5: 125–134. (in Chinese).
- Luo S. W . Study on Some Kinds of Weather Systems Over and Around the Qinghai-Xizang Plateau.
- Luo S. W. , He M. L. , Liu X. D . Study on the vortex of the Qinghai-Xizang (Tibet) Plateau in summer. Sci. China B. 1994; 37: 601–612.
- Luo S. W. , Yang Y. , Lu S. H . Diagnostic analyses of a summer vortex over Qinghai-Xizang Plateau for 29–30 June 1979. Plateau Meteorol. 1991; 10: 1–11. (in Chinese).
- Pan Y. , Yu R. C. , Li J. , Xu Y. P . A case study on the role of water vapor from southwest China in downstream heavy rainfall. Adv. Atmos. Sci. 2008; 25: 563–576.
- Qiao Q. M. , Zhang Y. G . Synoptic Meteorology of the Tibetan Plateau and Its Effect on the Near Areas.
- Rienecker M. M. , Suarez M. J. , Gelaro R. , Todling R. , Bacmeister J. , co-authors . MERRA: NASA's modern-era retrospective analysis for research and applications. J. Clim. 2011; 24: 3624–3648.
- Saha S. , Moorthi S. , Pan H.-L. , Wu X. R. , Wang J. D. , co-authors . The NCEP climate forecast system reanalysis. Bull. Am. Meteorol. Soc. 2010; 91: 1015–1057.
- Shen R. J. , Reiter E. R. , Bresch J. F . Numerical simulation of the development of vortices over the Qinghai-Xizang (Tibet) Plateau. Meteorol. Atmos. Phys. 1986a; 35: 70–95.
- Shen R. J. , Reiter E. R. , Bresch J. F . Some aspects of the effects of sensible heating on the development of summer weather system over the Qinghai-Xizang Plateau. J. Atmos. Sci. 1986b; 43: 2241–2260.
- Wang B . The development mechanism for Tibetan Plateau warm vortices. J. Atmos. Sci. 1987; 44: 2978–2994.
- Wang X. , Li Y. Q. , Yu S. H. , Jiang X. W . Statistical study on the plateau low vortex activities. Plateau Meteorol. 2009; 28: 64–71. (in Chinese).
- Wu G. X . Comparison between the complete-form vorticity equation and the traditional vorticity equation. Acta Meteorol. Sin. 2001; 59: 386–392. (in Chinese).
- Yanai M. , Steven E. , Chu J. H . Determination of bulk properties of tropical cloud clusters from large-scale heat and moisture budgets. J. Atmos. Sci. 1973; 30: 611–627.
- Ye D. Z. , Gao Y. X . The Tibetan Plateau Meteorology. (in Chinese).
- Yu S. H . Water vapour imagery of vortex moving process over Qinghai-Xizang Plateau. Plateau Meteorol. 2002; 21: 199–204. (in Chinese).
- Yu S. H. , Gao W. L. , Gu Q. Y . The middle-upper circulation analyses of the Plateau low vortex moving out of Plateau and influencing flood in east China in recent years. Plateau Meteorol. 2007a; 26: 466–475. (in Chinese).
- Yu S. H. , Gao W. L. , Xiao Y. H . Analysis for the influence of cold air mass on two cases of plateau vortex moving out of the Tibetan Plateau. Plateau Meteorol. 2008; 27: 96–103. (in Chinese).
- Yu S. H. , Xiao Y. H. , Gao W. L . Cold air influence on the Tibetan Plateau vortex moving out of the Plateau. J. Appl. Meteorol. Sci. 2007b; 18: 737–747. (in Chinese).