
Abstract
At the beginning of September 2002, strong convection processes over south-eastern Indonesia and over south-eastern Africa have been observed. Due to the strong upper tropospheric divergent outflow, two Rossby wave trains (RWTs) were generated. Their south-eastward propagation was controlled by the mean background flow. These two wave trains are visible in observations. It is hypothesised that these wave trains cause enhanced planetary wave activity fluxes which are a result of an amplified planetary wave 2 in the upper troposphere/lower stratosphere over Antarctica. Such a change of the planetary wave structure was diagnosed in September 2002, prior to the first observed major sudden stratospheric warming event on the Southern Hemisphere. A simplified version of GCM ECHAM4 is used to evaluate the hypothesis. Sensitivity experiments were performed for a mean background flow similar to September 2002. Furthermore, the wave maker approach was used to generate Rossby waves in the subtropical upper troposphere at two distinct locations which are corresponding to the observed regions of divergent outflow. As a main result, after about 2 weeks of model integration with wave maker forcing, we find two RWTs with a south-eastward propagation inducing a polar amplification of planetary wave 2 in the upper troposphere and lower/middle stratosphere. The poleward wave activity flux is enhanced in comparison to the control run without any wave maker forcing. The convergence of the Eliassen–Palm flux causes a 25% deceleration of zonal mean zonal wind in the model stratosphere but no wind reversal. Sensitivity runs support the robustness of these results. The obtained model results highlight the mechanism and confirm the hypothesis that enhanced planetary wave activity in austral polar region in 2002 is caused by enhanced subtropical forcing of two RWTs.
1. Introduction
The interannual variability of the boreal stratospheric circulation is well known to be strongly effected by sudden stratospheric warming (SSW) events during winter seasons (e.g. Andrews et al., Citation1987; Labitzke and Najokat, Citation2000; Simmons et al., 2005). SSW events are characterised by a strong and sudden temperature increase of the polar stratosphere, and in addition, for so-called major SSW events, by a zonal wind reversal from westerlies to easterlies at 60°N on 10 hPa layer and above (e.g. Charlton and Polvani, Citation2007). As a result of SSW events, the polar vortex is displaced off the pole or the vortex splits. Previous studies identify how SSWs influence the mesosphere (e.g. Leovy et al., Citation1985; Siskind et al., Citation2010; Liu et al., Citation2011; Pérot et al., Citation2014) and the troposphere (e.g. Baldwin and Dunkerton, Citation1999; Kuroda, Citation2010; Sigmond et al., 2013). Furthermore, SSW events may be linked to a strengthening of subtropical convection in the upper troposphere/lower stratosphere (Gray et al., Citation2005; Kodera, Citation2006).
By modelling, Matsuno (Citation1971) showed that the interaction between an upward propagating planetary wave packet forced in the troposphere and the zonal mean circulation is the essential dynamical mechanism responsible for SSW events. Since Scherhag (1952), SSW events were in the focus of numerous studies but several questions are still open. For instance, how does the upper troposphere in the subtropics influence the evolution of the polar vortex during SSW event?
The first observed and unique major SSW event over Antarctica occurred in September 2002. This event was also related to a spring-breakup of the ozone hole. A number of observational and model studies were devoted to this event in September 2002, published in a special issue of the Journal of Atmospheric Sciences in 2005. For instance, the evolution of the vortex splitting was studied by Charlton et al. (Citation2005) showing that the increasing stratospheric anticyclone in the Australian sector initially played an important role in the splitting process. Furthermore, these authors mentioned that a double-lobed structure developed in the upper troposphere/lower stratosphere at that time. They proposed an instability process of the tropospheric–stratospheric system with a possible dynamical connection to the underlying topography similar to Plumb (Citation1981) and Peters (Citation1985). These results are also in agreement with Krüger et al. (Citation2005) who showed that this SSW event was a warming of wave-1 type. However, during the evolution of the SSW, the eastward propagation of a travelling wave 2 was enhanced, oscillated and the vortex split (Scaife et al., Citation2005). This emphasises the importance of wave 2 during the SSW in September 2002.
A model study presented by Manney et al. (Citation2005) showed that the anomalously strong tropospheric forcing at the lower stratosphere was likely to be the primary direct cause of the major SSW in September 2002. These authors found a comparable splitting of the polar vortex in their GCM using observational forcing at the lower boundary of 100 hPa, that is, the lower stratosphere. The model simulations were started about 14 d before the central date of the SSW. Further, Esler and Scott (Citation2005) discussed the excitation of transient Rossby waves on the stratospheric vortex due to time-dependent topographic forcing. They showed that a rapid increase in vortex angular pseudo-momentum can be generated when a barotropic mode is resonantly excited. Also, the ‘self-tuned’ resonance excitation of the gravest linear mode was examined in a second paper by Esler et al. (Citation2006), and it was found that this may be a potential mechanism for the major Antarctic SSW of September 2002. The angular momentum balance during September 2002 (Peters and Zülicke, Citation2006) shows that changes in the atmospheric angular momentum fluxes are mainly determined by the evolution of momentum fluxes due to transient Rossby waves in the upper troposphere and lower stratosphere. The vortex break-up is associated also with a strong decrease of the amount of mountain torque.
Furthermore, Nishii and Nakamura (Citation2004), hereafter named NN04, analysed subtropical influences on the major SSW event of September 2002. They showed that due to convection processes nearby Indonesia in the beginning of September 2002, a Rossby wave train (RWT) was generated in the upper troposphere which propagated eastwards and southwards. This transient RWT maintained the anticyclone over the Southern Atlantic by eddy forcing (Shutts, 1983). Due to the convergence of wave activity fluxes induced by lower frequency quasi-stationary Rossby waves and by high frequency transient eddies, Nakamura and Nakamura (Citation1997) showed in a barotropic model the influence of both on the increase of anticyclones. The strengthening of such a tropospheric blocking high can lead to an increase of quasi-stationary planetary wave propagation from troposphere to stratosphere. However, the proposed RWT forced over Indonesia alone cannot explain the strong increase of planetary wave 2 associated with a polar vortex split.
The idea of NN04 was examined in an observational study by Peters et al. (Citation2007). They demonstrated the existence of an additional strong convection region near South Africa which acts also as a source of a second RWT in the pre-phase of the 2002-SSW event. This second RWT supported the maintenance of an upper tropospheric anticyclone over Western Antarctica on a similar way as mentioned above. Together with the larger anticyclone over Eastern Antarctica described already by NN04, the two anticyclones caused a stronger planetary wave 2, which propagates upward (Charney and Drazin, Citation1961) and is responsible for the splitting of the polar vortex as observed.
With a simplified global circulation model (SGCM) we aim to verify the results of the observational study of Peters et al. (Citation2007). Our task is to answer the following three open questions: How do two RWTs generated by convection processes in the subtropical upper troposphere nearby South Africa and nearby Indonesia propagate into the zonal or meridional direction? Does the SGCM reveal a strong amplification of planetary wave 2 for a given background mean state of September 2002? Are the induced wave activity fluxes directly linked to the deceleration of the zonal mean zonal wind as in observations?
We focus on the main mechanism of generation of RWTs, of maintenance of anticyclones, of vertical planetary wave propagation and, last but not least, of the deceleration of the zonal mean zonal wind. We do not attempt to produce a realistic major warming event which is beyond the scope of this study where the upper stratosphere was not included in the SGCM.
Our paper has been organised as follows: model approach and subtropical wave maker definition are given in Section 2, model results for different wave makers are presented in Section 3. Furthermore, the discussion and summary are given in Section 4.
2. Model approach and subtropical wave maker
The GCM ECHAM4 (Roeckner et al., Citation1996) was used in a simplified version, SGCM, to simulate the possible influence of subtropical Rossby wave forcing on planetary wave activity in the polar lower stratosphere. This model version was already successfully used and described by Peters and Waugh (Citation1996) for their study of Rossby wave breaking in a zonally varying background flow. This SGCM is using the same dynamical core as the given GCM, but in a dry version without moisture processes and radiation. It is forced by the so-called Newtonian cooling parameterisation where a relaxation toward a 3D mean equilibrium temperature (TE) is applied. The observational data set we used in this study for relaxation is the September-2002 temperature field of the ERA-Interim reanalysis (Dee et al., Citation2011) reduced to a T42 spectral resolution. The 3D monthly mean temperature is denoted TES02 based on an approximation (zonal mean and 4 ultra-long waves).
Typical relaxation time scales (τ) are of the order of 5–20 d (e.g. Dickinson, Citation1969; Newman and Rosenfield, Citation2012). The results are shown for a relaxation time of 5 d. We also performed runs with relaxation time scales of 10 and 15 d as discussed below. The horizontal spectral resolution is T42 with 19 hybrid pressure layers up to 10 hPa. The time step is 24 minutes. A boundary layer is used based on the Monin–Obukhov theory (standard in ECHAM4; Roeckner et al., Citation1996). The surface parameters are changed respectively, but the mean surface temperature has to be prescribed from observation.
All presented model results are run over 1 month after passing the initial spin-up procedure (24 months of integration).
The model was initialised with fields from an arbitrary day like 1 January from ECMWF analysis, interpolated onto the T42 model grid. This is necessary to stay in the model code. The relaxation procedure, approximated mean relaxation temperature TES02 with zonal mean and by 4 ultra-long waves, drives the mean circulation to a balanced state of mean September 2002, because the large-scale flow determines the wave guides of the RWTs. This means the September 2002 average wave 2 is included in the basic state. By the use of a strong damping time, the shorter and transient wave components are strongly reduced. Our experience shows that 12 months integration with 0.3 d of relaxation time is enough to reach this goal. Then, we changed the relaxation time to 5 d in order to allow baroclinic instability to act again over 12 months and to create a new balanced state with the action of sufficient transient wave activity. We found 10 d-relaxation time and larger drives the background flow to far away from observation. At the surface, we prescribed the mean surface temperature which is equal to the lowest observed atmospheric model layer temperature of September 2002. Further aspects of this procedure including the robustness are discussed in Section 4.
The zonal mean temperature and zonal mean zonal wind of the initial state are shown in . The simulated zonal mean temperature is not so far away from zonal mean temperature of TES02 (not shown) as expected due to the relaxation procedure. The simulated zonal mean zonal wind also shows good agreement with the observation because the thermal wind balance still holds. Note the zonal mean zonal wind of September 2002 is significantly weaker than the climatological zonal wind (both not shown) due to the major SSW event. The longitudinal structure of upper tropospheric zonal wind is presented in c. Three subtropical jets (>30 m/s) are revealed which are acting as wave guides for RWTs. The first jet is placed south of Australia, the second over the eastern Pacific Ocean and the third south of Africa. The last two are linked over the western Atlantic Ocean.
Fig. 1 Initial state: Pressure–latitude cross section of zonal mean state, (a) temperature (K), (b) zonal wind (m/s) and (c) stereographic projection of zonal wind (m/s) at 300 hPa layer. Latitudes start at 10°S, and shaded regions indicate winds stronger than 30 m/s.
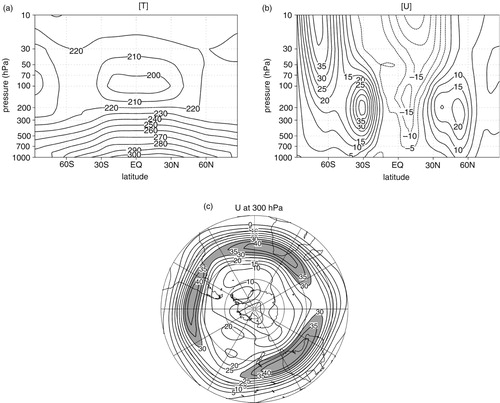
The observed mean jet near Africa is placed further south and is slightly stronger by about 5 m/s as in c. Furthermore, stronger observed wind exists also over the Central Pacific. Hence, the jet there seems to be better connected to the one south of Australia. Overall the zonally asymmetric jet structure of the initial state captures the dominant three subtropical jets in their longitudinal position.
Four different model experiments were performed: (1) one control run, (2) one wave maker nearby Indonesia, (3) one wave maker nearby South Africa and, finally, (4) two wave makers were induced.
In order to create a wave maker function, we used the usual barotropic approach where the horizontal velocity divergence is proportional to the wave forcing. Sardeshmukh and Hoskins (Citation1988) discussed an extended version including advection of vorticity by divergent flow and show the importance for tropical convection. In this study we work with the simplified wave maker concept. Based on observational values determined by Peters et al. (Citation2007) for the subtropical upper troposphere in September 2002, the derived wave maker function includes two sources of RWT generation. One source region located over the Indian Ocean nearby the south-eastern coast of South Africa (30°S, 30°E) which corresponds to the Agulhas stream region. The second source is placed south-east of Indonesia (20°S, 150°E). In accordance with observations the vertical maximum of both sources was set in the upper troposphere at the model pressure level of 325 hPa. In , the spatial wave maker structure is shown for the African and Indonesian wave-maker based on the assumption of a normal distribution in altitude as well as in the horizontal plane. The vertical and horizontal structure is the same for both. The Indonesian maximum shifted north by 10 degrees in comparison to the African one which is located at 30°S, consistent with localised source regions found by Peters et al. (Citation2007). For the simulations, we add this specific forcing function during selected time steps of integration into the spectral vorticity equation as an additional vorticity source.
Fig. 2 (a) Pressure–longitude cross section of African wave maker distribution (normalised) with its centre at 30°S, and at 325 hPa layer; (b) latitude–longitude location of African and Indonesian wave maker at 325 hPa layer (about 8 km altitude). Contours are shown from 0.1 with an interval of 0.2.
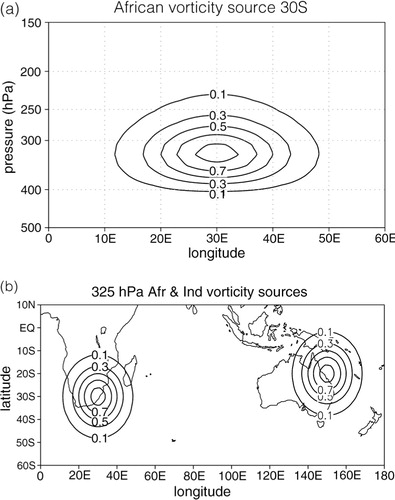
The maximum of African and Indonesian wave maker forcing function was constructed (e.g. Sardeshmukh and Hoskins, Citation1988) by the following equation: S=−f diva, where S defines the Rossby wave source, f is the Coriolis parameter and diva represents the anomalous wind divergence at 325 hPa. For the second week, the mean anomaly value of the wind divergence was calculated as a deviation from the monthly mean value of September 2002. For the African source, Peters et al. (Citation2007, their Fig. 9) determined a typical value of diva to 2 · 10−10 sec−1. A similar value was estimated for the Indonesian source region, but the structure there is less homogeneous. This approach of subtropical wave maker forcing was applied by Hoskins and Ambrizzi (Citation1993). The authors extend the barotropic Rossby wave analysis of Karoly and Hoskins (Citation1982) and of Karoly (Citation1983) through a zonally and meridionally varying background flow. The authors identified preferred pathways of RWT showing that the jet streams are acting as wave guides. The propagation of barotropic and forced RWTs in different zonal background flows was also studied by Ambrizzi and Hoskins (Citation1997), and by Renwick and Revell (Citation1999).
The fixed spatial structure of the wave maker at each layer is described in . Furthermore, all simulations are performed by the use of an exponentially asymptotic time function multiplied with the spatial structure. This is done in order to generate a time-increasing Rossby wave forcing to a fixed threshold. The wave forcing was switched on at day 6 of integration. The maximum is reached in a week after 13 d of integration. For the permanent runs discussed in Section 4, the wave forcing was held constant to the end of the simulations. Further, more realistic runs have been performed due to the use of a symmetric time decaying function for the Rossby wave source. In agreement with observations of outgoing long-wave radiation, we choose 7 d as the time interval of the wave maker decay, too.
A control run was performed without any subtropical Rossby wave forcing. The results of all these simulations are presented in the next section by comparing the control run with the more realistic simulations. The diagnostics examines the RWT evolution generated by the different forcing and its influence on planetary wave 1 to 3. Finally the mean evolution of Eliassen–Palm flux (named: EP flux) vector and the zonal mean zonal wind deceleration is determined (e.g. Andrews et al., Citation1987).
3. Results
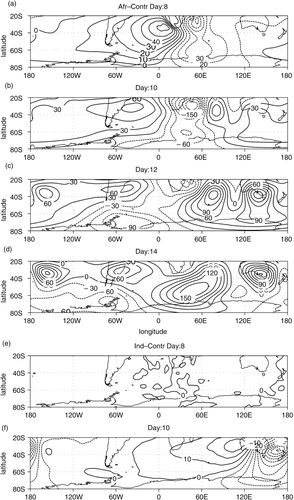
The evolution of the RWT forced by the African wave maker alone is shown in (left column), and the RWT forced 2 d later, based on an observed lag, only by the Indonesian wave maker is plotted in the right column at lower stratosphere. The geopotential height difference is calculated relative to the control run in order to identify the induced changes. The wave train propagates from the African source region eastwards and the amplitude of a transient wave 4 intensifies from day to day. A similar structure of the RWT propagation was caused by Indonesian source region. In higher latitudes planetary wave 2 is important.
Fig. 3 Latitude–longitude cross section at 100 hPa layer: Evolution of geopotential height difference (GHD; m) for day 8, 10, 12, and 14: (a–d) runs for African wave maker forcing (Afr) minus control run (Contr), and (e–h) runs for Indonesian wave maker forcing (Ind) minus control run. Note the Indonesian wave maker was switched on 2 d later.
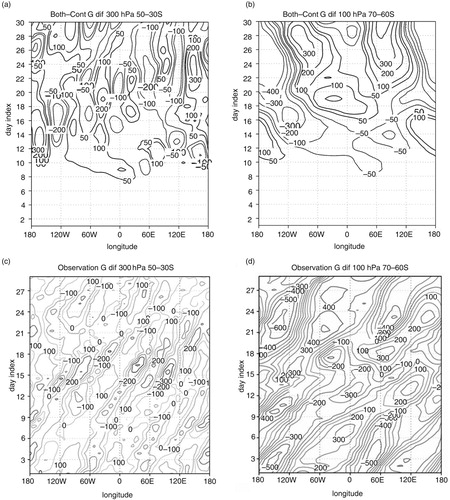
Due to the interference in time and superposition in phase a strong increase of waves is expected for both wave makers. As shown in a, comparison of amplitudes for a run with both wave makers reveals the individual RWT on one side, and on the other hand it shows an increase of wave amplitudes by a factor of about two in the upper troposphere for mid-latitudes after 2 weeks of forcing (>day 20). A similar dominant RWT was observed (c). In the lower stratosphere, averaged over higher latitudes (70°–60°S) a strong increase of a quasi-stationary wave pattern was found with a dominant structure of planetary wave 2 (b). There are similarities of the amplitude with observations (d) showing weak amplitudes in the middle of September, and after an increase of amplitudes. In the second half of September, the longitudinal phasing is shifted by about 60° to the East in the observation.
Fig. 4 Hovmöller diagram of geopotential height difference (GHD, m): (a, b) run with both wave makers minus control run, (c, d) observations based on ERA-Interim, September 2002 minus (1979–2008). (a, c) averaged over the latitudinal belt 50°–30°S at 300 hPa layer, and (b, d) averaged over 70°–60°S at 100 hPa.
In order to identify the influence of both wave makers on the intensity of planetary waves at the lower polar stratosphere, the amplitude evolution of planetary wave 1–3 was studied separately. illustrates the evolution of amplitudes averaged over the latitudinal belt from 70° to 60°S at 100 hPa. For the control run, the amplitude of wave 1 shows a huge increase after day 16 of integration (a). As known from former studies (e.g. Holton and Mass, Citation1976; Peters, 1985; Esler et al., Citation2006) internal interaction processes come into play, like interaction between planetary waves and background flow or between planetary waves among themselves. In the full forced run, the increase starts 4 d later. For the Indonesian wave maker alone, the amplitude increase begins earlier and includes a strong oscillation. Without any wave forcing the amplitudes of wave 2 are relatively weak over the first 3 weeks (b). A significant increase was found for the Indonesian wave maker, but for both subtropical wave makers the largest amplitude (about 300 m) occurs on day 25 which is about 1/3 larger than the amplitude of wave 1. In comparison with observations (e) the peak amplitude of planetary wave 2 is about 14 dam (equals 140 m) to small but in the right order (about 70%). On the other side, the maximum amplitude of wave 1 is only half as large as in the observation (e). The amplitudes of wave 3 are much smaller reaching their maximum during a phase of a wave-1 minimum about days 17–23 with an exception of the control run (c). Furthermore, the weak influence of changing the gap of switching on the Indonesian wave maker is shown in d. For a delay time of 1–4 d, a similar amplitude evolution of wave 2 was determined. If both wave makers are working parallel, the second increase of the wave-2 amplitude occurs 4 d later.
Fig. 5 Evolution of geopotential height amplitude (dam) averaged over 70°–60°S at 100 hPa layer for different wave makers: (a) planetary wave 1; (b) wave 2; (c) wave 3; and (d) planetary wave 2 with different delay times (in days) of switching on the Indonesian wave maker; (e) observation based on ERA-Interim.
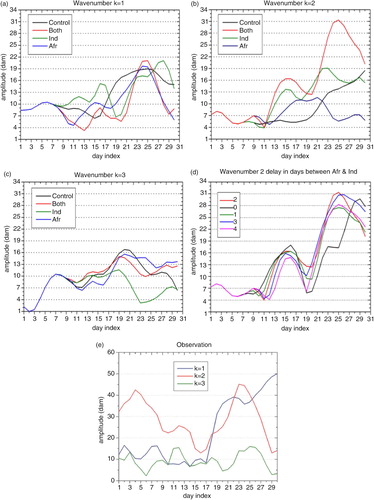
Overall, the comparison of amplitudes of wavenumber 1 to 3 with and without different wave makers shows a strong influence of subtropical RWTs on the polar planetary wave structure. The SGCM results give evidence that especially the huge polar increase of planetary wave 2 in the lower stratosphere by a factor of about 4 is mainly caused by the additional forcing of two RWTs in the subtropics. Note, an additional pulse of wave 2 in the observations in the earlier part of the month (e), propagating eastward (d) cannot be related to additional RWTs as shown by Peters et al. (Citation2007, their ). Other mechanisms, like wave–wave interaction (e.g. Peters, Citation1985) or vacillation (Scaife et al., Citation2005), could form the eastward traveling wave.
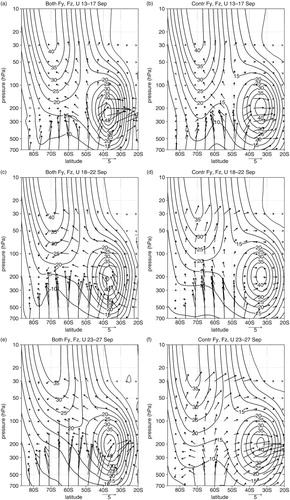
In , the evolution of the EP flux vector averaged over 5 d and the zonal mean zonal wind is examined. The run with both wave makers and the control run are compared. After passing the maximum of wave maker forcing on day 13, during the period, 13–17 September, the EP flux and zonal wind in both simulations are still comparable (a, b). Later, 18–22 September, still an upward EP flux was found, but the meridional flux changed its direction from north to south in the latitudinal belt of 70°–60°S for both wave makers (c, d). Further south we found downward EP fluxes. c shows a deceleration of the zonal mean zonal wind due to wave convergence south of 65°S in the upper troposphere and lower stratosphere which is stronger than the relaxation. For the period, 23–27 September, the amplification of upward and poleward propagation of wave activity holds on (e, f). The decrease of the zonal mean zonal wind over the polar latitudes starts in the middle stratosphere during this period.
Fig. 6 Pressure–latitude cross sections of Eliassen–Palm flux (arrows, m2/s2) and zonal mean zonal wind contours (m/s) averaged over a 5 d period: (a, b) 13–17, (c, d) 18–22, and (e, f) 23–27 September of model simulation according to both wave makers (a, c, e), and control run (b, d, f).
A comparison of zonal wave activity fluxes (Plumb, Citation1985) reveals that the Indonesian wave maker induces stronger wave activity amplification than the African wave maker (not shown). Two centres of upward wave activity are found: south-western Atlantic and southern Indian Ocean, as observed (Peters et al., Citation2007). Furthermore, the model simulation shows that the African RWT leads to an increase of upward wave activity in the lower stratosphere over the south-eastern Pacific Ocean similar to the observations.
In a Hovmöller plot, the difference of the zonal mean zonal wind is presented at 70 hPa in . There is no difference in the zonal wind during the first 2 weeks of integration. In the third week a weak increase of 2 m/s was found. The decrease starts after 3 weeks with a maximum of 8 m/s induced by the full wave maker run and includes the whole polar region in the troposphere and stratosphere of the SGCM. The maximum of the decrease (about 25%) is found on the 70 hPa layer.
Fig. 7 Hovmöller diagram of the difference of zonal mean zonal wind (m/s) induced by model run with both wave makers minus control run at 70 hPa layer.
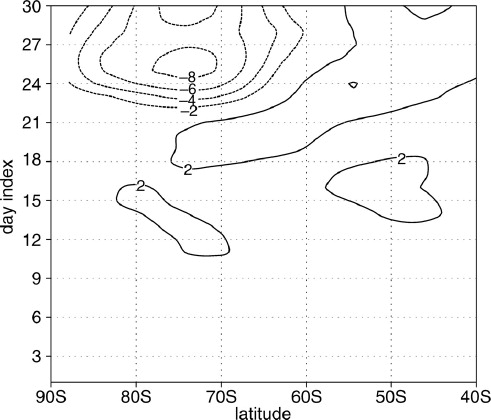
Revealed zonal mean zonal wind deceleration in the lower and middle stratosphere indicates that both subtropical wave makers cause the weakening of the austral polar vortex via a change of the planetary wave structure as expected.
4. Discussion and summary
An SGCM version of ECHAM4 was used in order to simulate the influence of subtropical RWTs on the planetary wave structure over Antarctica. Sensitivity experiments were performed for a mean background flow similar to September 2002. The aim of this numerical study is to implement the dynamical approach as simply as possible. The SGCM was chosen in order to include only the interaction between a given 3D background flow driven by Newtonian cooling and planetary waves as well as the interaction between planetary waves and forced Rossby waves. Furthermore, the wave maker approach was used to generate Rossby waves in the subtropical upper troposphere at two distinct locations which are corresponding to the observed regions of divergent outflow, over south-eastern Indonesia and over south-eastern Africa. This induces two RWTs with a south-eastward propagation.
The concept of wave maker forcing is applied in the subtropics in order to quantify the induced influences on planetary waves and on the mean flow regime in comparison to a control run without any forcing. Based on the results of a synoptic study (Peters et al., Citation2007) the goal was to construct an idealised model run with a quasi-realistic wave maker forcing function embedded in a mean typical background flow of September 2002.
A broad range of parameter tests have been performed in order to confirm the robustness of the obtained results. Based on these tests we simplified the spatial structure of African and Indonesian wave makers (Gaussian distribution) and applied a symmetric function of increase and of decrease in time over 2 weeks. Permanent runs without any decrease of wave forcing have also been performed. They confirm a large increase of wave 2 in the lower stratosphere of high southern latitudes in the period of 18–24 September (not shown). Nevertheless the used temporal forcing of about 14 d fits better to the diagnosed outgoing long wave radiation anomaly which corresponds to enhanced convection processes.
We made some additional forcing experiments with (1) a mean background flow of the first half of September 2002 similar to the mean background wind of September 2002, and (2) with a mean background flow of September 2001 applying the same initialisation procedure. Both runs differ: (1) the run shows an amplification of wave 2 as for mean September conditions; (2) no amplification of wave 2 or 3 was found.
The differences in the mean relaxed 300 hPa zonal wind fields between September 2002 and 2001 are mainly a weakening of the Australian subtropical jet and a northward shift of about 10 degrees for runs without any forcing. Thus, the subtropical jet is strongly reduced over the Indian Ocean and over the western Pacific Ocean. That means no Rossby wave guide was obtained in September 2001 as in 2002 which suppress the Rossby wave propagation for broken jets in 2001 (e.g. Peters and Waugh, Citation2003). We conclude from these additional experiments that the mean structure of background flow of September 2002 is very important for synoptic wave propagation because the specific wave guides of the RWTs are determined by the background flow.
The case of no wave maker forcing, one for each location, and both on the induced planetary wave structure are examined in more details (a–c). It is shown that both forcing are needed to get the strong amplification of wave 2 in lower stratosphere in polar latitudes as observed (b). Based on the relative fixed location of OLR anomalies in September 2002 an artificial shift of the locations was not considered. Instead of we considered a shift of the temporal evolution of both forcing regions which could induce similar influence as relative weak locations shifts of constant wave makers on wave 2 amplification. A gap of 2 d between the two forcings was used in the SGCM simulations as indicated by observation (Peters et al., Citation2007, their ). Test results are shown in d, indicating a weak dependence of different gap intervals. Note the used mean forcing maximum value of RWTs for both regions which we used in the upper troposphere was derived by Peters et al. (Citation2007).
Further tests have been done for the initial state. The relaxation time of 5 d and a set of planetary waves 0–4 including the zonal mean state have been identified as the best representation of the September 2002 mean background flow. For a temperature field averaged over the first half month of September 2002 similar results have been obtained.
This model set shows no wind reversal and no splitting. Due to the fact that no orography was implemented, the diabatic influence of the topography of Antarctica is indirectly included in the mean temperature TES02. Additional runs with orography and same model configuration show no improvement in background flow of the model. Instead of, it seems so that an additional stationary wave component or mountain torque was generated which breaks down the mean balance achieved by the relaxation procedure without orography. However, amplified planetary waves are necessary to produce a stronger EP flux convergence in the upper stratosphere (NN04).
A drawback of the SGCM simulations is the use of a proxy for the subtropical wave maker. In addition, more realistic GCM simulations are required in order to study the subtropical Rossby wave forcing processes in more details, for instance through the consideration of subtropical convection, of formation of clouds, and of the hydrological cycle which are beyond the scope of this investigation. Furthermore, extended studies are necessary which include the advection of vorticity by the divergent flow in the source function as done by Sardeshmukh and Hoskins (Citation1988) or work with a diabatic heating perturbation (e.g. Chang, Citation2005) in order to confirm our findings.
In order to study the zonal wind reversal and splitting process in detail the upper stratosphere and mesosphere and orography should be included in a similar model study. Furthermore, for SSW events with strong tropospheric Rossby wave forcing like in January 2003 (Peters et al., Citation2010) and December 2009 (Vargin, Citation2013) on the Northern Hemisphere, a similar model study could give a better understanding of the role of tropospheric forcing processes.
We conclude from the sensitivity studies above, and from the results shown in Section 3, that the influence of subtropical RWTs forced by wave makers on the austral polar stratospheric circulation is robust. As a main result, after about 2 weeks of model integration with wave maker forcing we find an amplification of planetary wave 2 in the polar upper troposphere and lower/middle stratosphere (about 70% of observed). The upward and poleward EP flux is enhanced in comparison to the control run without any subtropical wave makers. The convergence of this flux causes a deceleration of zonal mean zonal wind in the stratospheric polar region of Antarctica as expected. The obtained model results highlight the main mechanism and confirm the hypothesis derived from observation.
5. Acknowledgements
The authors are grateful to the Deutscher Wetterdienst for providing the ECMWF analyses data and to the DKRZ of Hamburg for ECHAM4 assistance. P. Vargin thanks the German Academic Exchange Service (DAAD) and the Leibniz-Institute of Atmospheric Physics in Kühlungsborn for support. Thanks also to A. Schneidereit, A. Gabriel and Ch. Zülicke for valuable discussions. The authors also thank the two anonymous reviewers for their valuable comments.
Related Research Data
References
- Ambrizzi T. , Hoskins B . Stationary Rossby-wave propagation in a baroclinic atmosphere. Q. J. Roy. Meteorol. Soc. 1997; 123: 919–928. DOI: 10.1002/qj.49712354007.
- Andrews D. G. , Holton J. R. , Leovy C. B . Middle Atmosphere Dynamics. 1987; Orlando, FL: Academic Press. International Geophysics Series, Vol. 40.
- Baldwin M. , Dunkerton T . Propagation of the Arctic oscillation from the stratosphere to the troposphere. J. Geophys. Res. 1999; 104: 30937–30946. DOI: 10.1029/1999JD900445.
- Chang E. K. M . An idealized nonlinear model of the Northern Hemisphere winter storm tracks. J. Atmos. Sci. 2005; 63: 1818–1839.
- Charlton A. J. , Polvani L. M . A new look at stratospheric sudden warmings. Part I: climatology and modeling benchmarks. J. Clim. 2007; 20: 449–469. DOI: 10.1175/JCLI3996.1, Corrigendum. 2011. J. Clim. 24, 5951. DOI: 10.1175/JCLI-D-11-00348.1.
- Charlton J. , O'Neill A. , Lahoz W. , Massacand A. , Berrisford P . The impact of the stratosphere on the troposphere during the southern hemisphere stratospheric sudden warming, September 2002. Q. J. Roy. Meteorol. Soc. 2005; 131(609): 2171–2188. DOI: 10.1256/qj.04.43.
- Charney J. , Drazin P . Propagation of planetary-scale disturbances from the lower in to the upper atmosphere. J. Geophys. Res. 1961; 66: 83–109. DOI: 10.1029/JZ066i001p00083.
- Dickinson R . Vertical propagation of planetary Rossby waves through an atmosphere with Newtonian cooling. J. Geophys. Res. 1969; 74: 929–938.
- Dee D. P. , Uppala S. M. , Simmons A. J. , Berrisford P. , Poli P. , co-authors . The ERA-Interim reanalysis: configuration and performance of the data assimilation system. Q. J. Roy. Meteorol. Soc. 2011; 137: 553–597. DOI: 10.1002/qj.828.
- Esler J. G. , Polvani L. M. , Scott R. K . The Antarctic stratospheric sudden warming of 2002: a self-tuned resonance?. Geophys. Res. Lett. 2006; 33: 12804. DOI: 10.1029/2006GL026034.
- Esler J. G. , Scott R. K . Excitation of transient Rossby waves on the stratospheric polar vortex and the barotropic sudden warming. J. Atmos. Sci. 2005; 62: 3661–3682. DOI: 10.1175/JAS3557.1.
- Gray L. , Norton W. , Pascoe C. , Charlton A . A possible influence of equatorial winds on the September 2002 Southern Hemisphere sudden warming event. J. Atmos. Sci. 2005; 62: 651–667. DOI: 10.1175/JAS-3339.1.
- Holton J. R. , Mass C . Stratospheric vacillation cycle. J. Atmos. Sci. 1976; 33: 2218–2225.
- Hoskins B. , Ambrizzi T . Rossby Wave propagation on a realistic longitudinally varying flow. J. Atmos. Sci. 1993; 50: 1661–1671. DOI: 10.1175/1520-0469(1993)050<1661:RWPOAR>2.0.CO;2.
- Karoly D. J . Rossby wave propagation in a barotropic atmosphere. Dyn. Atmos. Oceans. 1983; 7: 111–125. DOI: 10.1016/0377-0265(83)90013-1.
- Karoly D. J. , Hoskins B. J . Three dimensional propagation of planetary waves. J. Meteorol. Soc. Jap. 1982; 60: 109–123.
- Kodera K . Influence of stratospheric sudden warming on the equatorial troposphere. Geophys. Res. Lett. 2006; 33: 06804. DOI: 10.1029/2005GL024510.
- Krüger K. , Naujokat B. , Labitzke K . The unusual midwinter warming in the Southern Hemisphere stratosphere 2002: a comparison to Northern Hemisphere phenomena. J. Atmos. Sci. 2005; 62: 603–613. DOI: 10.1175/JAS-3316.1.
- Kuroda Y . High initial-time sensitivity of medium-range forecasting observed for a stratospheric sudden warming. Geophys. Res. Lett. 2010; 37: 16804. DOI: 10.1029/2010GL044119.
- Labitzke K. , Naujokat B . The lower Arctic stratosphere in winter since 1952. SPARC Newslett. 2000; 15: 11–14.
- Leovy C. B. , Sun C.-R. , Hitchman M. H. , Rosenberg E. E. , Russel J. M., III. , co-authors . Transport of ozone in the middle stratosphere: evidence for planetary wave breaking. J. Atmos. Sci. 1985; 42: 230–244. DOI: 10.1175/1520-0469(1985)042<0230:TOOITM>2.0.CO;2.
- Liu H. , Doornbos E. , Yamamoto M. , Tulasi Ram S . Strong thermospheric cooling during the 2009 major stratosphere warming. Geophys. Res. Lett. 2011; 38: 12102. DOI: 10.1029/2011GL047898.
- Manney G. , Sabutis J. , Allen D. , Lahoz W. , Scaife A. , co-authors . Simulations of dynamics and transport during the September 2002 Antarctic major warming. J. Atmos. Sci. 2005; 62: 690–707. DOI: 10.1175/JAS-3313.1.
- Matsuno T . A dynamical model of stratospheric sudden warming. J. Atmos. Sci. 1971; 28: 1479–1494. DOI: 10.1175/1520-0469(1971)028<1479:ADMOTS>2.0.CO;2.
- Nakamura H. , Nakamura M . The role of high- and low-frequency dynamics in blocking formation. Mon. Weather Rev. 1997; 125(9): 2074–2093. DOI: 10.1175/1520-0493(1997)125<2074:TROHAL>2.0.CO;2.
- Newman P. , Rosenfield J . Stratospheric thermal damping times. Geophys. Res. Lett. 2012; 24(4): 433–436. DOI: 10.1029/96GL03720.
- Nishii K. , Nakamura H . Tropospheric influence on the diminished Antarctic ozone hole in September 2002. Geophys. Res. Lett. 2004; 31: 16103. DOI: 10.1029/2004GL019532.
- Pérot K. , Urban J. , Murtagh D. P . Unusually strong nitric oxide descent in the Arctic middle atmosphere in early 2013 as observed by Odin/SMR. Atmos. Chem. Phys. 2014; 14: 8009–8015. DOI: 10.5194/acp-14-8009-2014.
- Peters D . Zur resonanten Wechselwirkung von planetaren Wellen in einem Zweischichtenmodell unter Berücksichtigung der externen Anregung einer Welle, Teil 1 der Amplitudenverlauf. Z. Meteorol. 1985; 35(5): 239–251.
- Peters D. , Waugh D. W . Influence of barotropic shear on the poleward advection of upper-tropospheric air. J. Atmos. Sci. 1996; 53: 3013–3031. DOI: 10.1175/1520-0469(1996)053<3013:IOBSOT>2.0.CO;2.
- Peters D. , Waugh D. W . Rossby wave breaking in the Southern Hemisphere wintertime upper troposphere. Mon. Weather Rev. 2003; 131: 2623–2634.
- Peters D. , Zülicke C . Atmospheric angular momentum balance for the Southern Hemisphere during the polar vortex break-up of September 2002. Tellus A. 2006; 58: 508–519. DOI: 10.1111/j.1600-0870.2006.00187.x.
- Peters D. H. W. , Vargin P. , Gabriel A. , Tsvetkova N. , Yushkov V . Tropospheric forcing of the boreal polar vortex splitting in January 2003. Ann. Geophys. 2010; 28: 2133–2148. DOI: 10.5194/angeo-28-2133-2010.
- Peters D. , Vargin P. , Koernich H . A study of the zonally asymmetric tropospheric forcing of the austral vortex splitting during September 2002. Tellus A. 2007; 59: 384–394. DOI: 10.1111/j.1600-0870.2007.00228.x.
- Plumb R. A . Instability of the distorted polar night vortex: a theory of stratospheric warmings. J. Atmos. Sci. 1981; 38: 2514–2531. DOI: 10.1175/1520-0469(1981)038<2514:IOTDPN>2.0.CO;2.
- Plumb R. A . On the three-dimensional propagation of stationary waves. J. Atmos. Sci. 1985; 42: 217–229. DOI: 10.1175/1520-0469(1985)042 < 0217:OTTDPO>2.0.CO;2.
- Renwick J. , Revell M . Blocking over the South Pacific and Rossby wave propagation. Mon. Weather Rev. 1999; 127: 2233–2247. DOI: 10.1175/1520-0493(1999)127<2233:BOTSPA>2.0.CO;2.
- Roeckner E. , Arpe K. , Bengtsson L. , Christoph M. , Claussen M. , co-authors . The Atmospheric General Circulation Model ECHAM-4: Model Description and Simulation of Present-Day Climate. 10.1175/1520-0469(1988)045<1228:TGOGRF>2.0.CO;2.
- Sardeshmukh P. , Hoskins B . The generation of global rotational flow by steady idealized tropical divergence. J. Atmos. Sci. 1988; 45: 1228–1250. 10.1175/1520-0469(1988)045<1228:TGOGRF>2.0.CO;2.
- Siskind D. E. , Eckermann S. D. , McCormack J. P. , Coy L. , Hoppel K. W. , co-authors . Case studies of the mesospheric response to recent minor, major, and extended stratospheric warmings. J. Geophys. Res. 2010; 115: 00N03. DOI: 10.1029/2010JD014114.
- Scaife A. , Jackson D. , Swinbank R. , Butchart N. , Thornton H. , co-authors . Stratospheric vacillations and major warming over Antarctica in 2002. J. Atmos. Sci. 2005; 62: 629–639. DOI: 10.1175/JAS-3334.1.
- Scherhag R . Die explosionsartigen Stratosphärenerwärmungen des Spätwinters 1951/52. Berichte des Deutschen Wetterdienstes in der US-Zone 6 (Nr. 38). 1952; 51–63.
- Shutts G. J . The propagation of eddies in diffluent jetstreams - eddy vorticity forcing of blocking flow-fields. Q. J. Roy. Meteorol. Soc. 1983; 109: 737–761.
- Sigmond M. , Scinocca J. F. , Kharin V. V. , Shepherd T. G . Enhanced seasonal forecast skill following stratospheric sudden warmings. Nature Geosci. 2013; 6: 98–102. DOI: 10.1038/ngeo1698.
- Simmons A. , Hortal M. , Kelly A. , McNally A. , Untch A. , co-authors . ECMWF analyses and forecasts of stratospheric winter polar vortex breakup: September 2002 in the Southern Hemisphere and related events. J. Atmos. Sci. 2005; 62: 668–689.
- Vargin P . Stratospheric polar vortex splitting in December 2009. Atmos. Ocean. 2013; 53: 29–41. DOI: 10.1080/07055900.2013.851066.