
Abstract
Microwave radiances from the humidity sounder SAPHIR at 183GHz onboard the MEGHA-TROPIQUES satellite are simulated in cloudy and rainy conditions (all-sky radiances) using short-range forecasts from the operational limited area model ALADIN-Réunion over the Indian Ocean. The simulation of SAPHIR radiances uses cloud and precipitation profiles from the moist physical parameterizations of ALADIN-Réunion describing deep convection and large-scale precipitation, that are coupled to the fast radiative transfer model RTTOV-SCATT accounting for scattering by hydrometeors. Sensitivity studies show that within cloud systems the SAPHIR sounder is particularly sensitive to solid precipitating hydrometeors. An optimal choice of scattering properties for snow particles is undertaken by a systematic comparison of simulated and observed SAPHIR radiances over a 1-month period in February 2012. This choice has required defining a criterion for rain occurrence from SAPHIR radiances that has been calibrated with the TMPA 3B40RT surface precipitation rate product. Finally, a retrieval technique based on Bayesian inversion is proposed to derive atmospheric profiles within clouds to be assimilated in the ALADIN 3D-Var system in a forthcoming study. The retrieved profiles are evaluated through the simulation of radiances from the microwave imager MADRAS that also flew on MEGHA-TROPIQUES.
1. Introduction
Satellite radiances play a major role in improving the skill of Numerical Weather Prediction (NWP) models particularly in data sparse areas where conventional observations can hardly sample the atmosphere. This has been evidenced by Observing System Experiments (OSEs), Forecast Sensitivity to Observations (FSOs) and also through forecasts run from reanalyses over long periods (Radnoti et al., Citation2010; Dee et al., Citation2011; English et al., Citation2013). Forecast scores in the Southern Hemisphere have now reached a level of skill that is similar to the one over the Northern Hemisphere, despite much less conventional data (surface networks, radiosoundings, aircraft measurements). Tropical regions have also benefited from these improvements but to a lesser extent, mostly due to the lack of geostrophic balance that prevents converting temperature information from satellite radiances into wind information.
The strong link between the diabatic heating and the dynamical tropical circulation makes water vapour and cloud variables crucial ingredients for improved analyses in these regions. At global scale (with model grids ranging from 15 to 50km), there has been recent progress in humidity analyses thanks to the use of microwave radiometers (SSM/I, AMSU-B, TMI) combined with the assimilation of microwave radiances in cloudy and rainy areas (Bauer et al., Citation2006b; Kelly et al., Citation2008; Geer et al., Citation2010, Citation2014). At convective scale where cloud dynamics is essentially resolved, the use of radar data has allowed constraining both dynamical and microphysical fields leading to improved predictions of severe thunderstorms. Such demonstration has been done over Europe and US regions where radar networks do exist (Wattrelot et al., Citation2014).
When considering tropical regions, one of the most important natural hazards to predict accurately both in intensity and location is tropical cyclones (TCs). Convective scale models better describe the internal structure of TCs; however, due to computing limitations, the dimension of their geographical domain cannot encompass the whole trajectory during their life cycle (several thousands of kilometres). On the other hand, global models have some skill in predicting their trajectory but have difficulties in simulating the correct intensity in the core of the systems. At Météo-France a regional model ALADIN-Réunion has been developed over a large domain covering a significant part of the Southern Indian Ocean with a resolution of 8km that, even though not sufficient to resolve explicitly moist convection, describes the mesoscale motions taking place in TCs (Faure et al., Citation2008). This represents an interesting compromise between global and convective scale models.
The prediction in track and intensity of TCs can be improved by several means: a better description of sea–atmosphere interactions (formulation of turbulent exchanges), a better knowledge of sea surface temperature (SST) (either through surface analyses or through the coupling with a mixed layer ocean model), more accurate surface wind fields (assimilation of scatterometer data, creation of a ‘bogus vortex’), more accurate description of the three-dimensional (3D) humidity field. The current article will focus on this last point with the ALADIN-Réunion regional NWP model. Indeed, except at the European Centre for Medium range Weather Forecasts (ECMWF), where satellite microwave radiances are assimilated in cloudy and rainy regions in a global model at 15km, most operational NWP data assimilation systems reject such observations and only retain clear-sky radiances or radiances weakly contaminated by clouds.
In this article, we propose the following approach: first we examine the capacity of the ALADIN-Réunion model to simulate all-sky (i.e. clear-sky and cloudy regions) microwave radiances and then we define an inversion technique with its data assimilation system (i.e. 3-D variational scheme: 3D-Var). We will consider the microwave radiances measured by the humidity sounder SAPHIR at 183GHz on board the MEGHA-TROPIQUES (MT) satellite. Two main reasons justify this choice: the particular orbit of MT (20 ° inclination over the Equator) that leads to a more frequent temporal revisit of tropical regions than polar orbiting satellites, and the sounding capabilities of SAPHIR that are quite unique to examine cloudy systems (six sounding channels instead of three for AMSU-B/MHS or SSMI/S). It is important to recall that the assimilation of all-sky microwave radiances has been consolidated over the last 10yr for low-frequency channels (below 37GHz) but that it remains challenging for high-frequency channels (above 85GHz) for various reasons to be explained afterwards.
The data sources used in this study are presented in Section 2 with both the microwave radiances from the MT instruments and the main features of the ALADIN-Réunion NWP model from which atmospheric profiles will be used. The simulation of all-sky radiances requires a radiative transfer model (RTTOV-SCATT) that is described in Section 3. We also present in this section a number of sensitivity studies to highlight the importance of frozen precipitation together with their radiative properties. In Section 4, we describe an inversion method based on the Bayesian technique and show a preliminary evaluation of pseudo-observations to be included in the ALADIN-Réunion 3D-Var system in a forthcoming study. The main conclusions are given in Section 5 with a number of perspectives.
2. Data sources
2.1. Radiances from SAPHIR and MADRAS radiometers
The MEGHA-TROPIQUES mission is a joint mission between the French and Indian space agencies (CNES and ISRO) that was designed to improve the understanding of the hydrological cycle in tropical regions from the synergy between three spaceborne instruments (Roca et al., Citation2015). The satellite was launched on 12 October 2011 and put on a low-inclination orbit (20 ° over the Equatorial plane) at 867km altitude. The payload consists of three instruments: a broadband radiometer SCARAB providing infra-red and solar fluxes at the top of the atmosphere, a cross-track humidity microwave sounder SAPHIR with six channels around the 183GHz water vapour absorption line, and a conical scanning microwave radiometer MADRAS with a set of nine frequencies between 19 and 157GHz providing information on water vapour, cloud and precipitation. Since the MT launch, the behaviour of SCARAB and SAPHIR instruments has been nominal with on board CAL/VAL specifications better than the radiometric noise requirements. On the other hand, the MADRAS instrument has experienced electronic and mechanical difficulties that led to rather discontinuous measurements during the first year of the mission, and was then declared unoperational by the space agencies (26 January 2013).
The SAPHIR and MADRAS instruments are the most interesting ones for use in NWP models since there is a strong heritage on similar instruments with AMSU-B/MHS and SSM/I-SSMI/S that have proved to be very useful for atmospheric water vapour analyses. Given the difficulties of MADRAS, the focus of this study will be on SAPHIR radiances, even though MADRAS radiances will be used for validation purposes on a case study. Another interest for SAPHIR radiances is their real-time availability, making such data potentially attractive for operational forecasting centres in tropical regions, including NWP data assimilation. Indeed the six SAPHIR brightness temperatures are assimilated operationally in clear-sky conditions at Météo-France in the global model ARPEGE and in four ALADIN Overseas Limited Area Models (LAMs) since 13 April 2015 following a methodology described in Chambon et al. (Citation2015). provides the frequencies of the SAPHIR instrument with radiometric noise for Level 1A2 brightness temperatures (T b ) (non-overlapping pixels). The swath is 1700km with 130pixels along each scan line. The actual resolution of the instrument (circles of 10km×10km at nadir and ellipses of 14.5km×22.7km on the edges of the swath) is close to the ALADIN-Réunion model grid (8km), which means that the difficult problem of matching scale between model grid and satellite pixel size (Duffourg et al., Citation2010) can be by-passed.
Table 1. Channel specification for the humidity sounder SAPHIR around the water vapour absorption band at 183GHz, in terms of frequency, bandwidth and radiometric noise
2.2. The ALADIN-Réunion NWP model
2.2.1. Dynamics.
The ALADIN NWP models are limited area versions of the spectral global NWP model ARPEGE (Courtier et al., Citation1991) that has been adapted to this particular geometry by Bubnova et al. (Citation1995), and developed within a European consortium since 1992. The dynamical core of ALADIN models can solve the elastic Euler equations of motion using the hydrostatic pressure vertical coordinate system proposed by Laprise (Citation1992). Since 2006, a version of ALADIN named ALADIN-Réunion has been running operationally at Météo-France to produce forecasts twice a day at 00 and 12 UTC up for 84h (Faure et al., Citation2008). This bi-Fourier spectral model (with an elliptical truncation at wave number 249) has an equivalent horizontal resolution of 8km and covers a large domain of the Southern Indian Ocean with 810×500 grid points (Mercator projection) as shown in . The model has, at its lateral boundary conditions, a Newtonian relaxation (Davies, Citation1976) of the predicted fields towards their equivalents from ARPEGE forecasts that are linearly interpolated every 3h. The vertical is discretized with 70 levels up to 1hPa and ALADIN shares its physical parametrisations with the ones from ARPEGE. The 3-D variational (3D-Var) data assimilation system is also derived from the global model ARPEGE and has been adapted to regional scales by Fischer et al. (Citation2005). The ALADIN-Réunion model solves prognostic equations for surface pressure, wind components, temperature, turbulent kinetic energy (TKE) and the mass concentration of five water species (water vapour q v , cloud water q l , ice crystals q i , rain q r , snow q s expressed in kg/kg) with a Semi-Implicit Semi-Lagrangian temporal scheme allowing a model time step of 450s. In the present study, we use a model version from CY38T1 that was operational at Météo-France from July 2013 to April 2015. The period of interest is taken between December 2011 and February 2012 (rather close to the MT launch) when CAL/VAL activities of MT took place [embedded within the international field campaign CINDY-DYNAMO to study the Madden-Julian Oscillation (MJO)] and when the MADRAS imager produced reliable measurements during several periods.
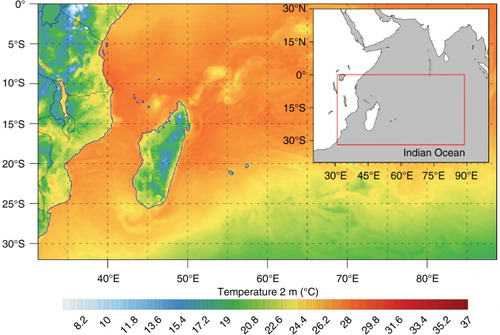
Fig. 1 ALADIN-Réunion domain with a 6-h forecast of 2-m temperature valid at 0000 UTC 15 January 2012. This domain is also displayed within a larger area covering the Western Indian Ocean.
2.2.2. Physical parameterizations.
There is a comprehensive set of physical parameterizations to describe subgrid scale processes. The turbulent fluxes in the boundary layer are represented by an eddy-diffusivity formulation depending upon TKE following the proposal of Bougeault and Lacarrère (Citation1989) for non-local mixing lengths. The radiation scheme is RRTM (Mlawer et al., Citation1997) for the longwave part of the spectrum (with 16 spectral bands) and is based on the Fouquart and Bonnel (Citation1980) scheme for the shortwave part of the spectrum (with six spectral bands). Surface exchanges over land and oceans are described with the externalized module SURFEX (Masson et al., Citation2013) including a parametrisation of ocean turbulent fluxes based on the ECUME model (Belamari, Citation2005).
The moist physical processes generate clouds and precipitation that allow to simulate all-sky microwave radiances from a radiative transfer model described afterwards. Resolved condensation is described with a statistical cloud scheme allowing the formation of condensed water before the saturation of the full grid box. This statistical scheme allows us to diagnose the cloud fraction and the cloud water content of ‘resolved’ clouds (Smith, Citation1990). The partition of condensed water between liquid and solid phases is based on a temperature criterion (with a mixed phase between around −25 °C and 0 °C). The cloud microphysics is a single moment bulk scheme with four prognostic variables (cloud droplets q l , ice crystals q i , rain q r , snow q s ) where the conversions between species are described in Lopez (Citation2002). The autoconversion rate (transformation of cloud particles into precipitating particles) is based on the formulation of Kessler (Citation1969). The collection processes (accretion, aggregation, riming) are described assuming Marshall-Palmer Particle Size Distributions (PSD), specific mass-diameter and fall velocity–diameter relationships presented in Appendix B of Lopez (Citation2002). Evaporation and sedimentation of precipitation are also accounted for. Constant fall velocities are imposed for rain (5m/s) and snow (1.5m/s) within the statistical scheme proposed by Bouteloup et al. (Citation2011) to represent the sedimentation process with long model time steps.
Given the grid size of ALADIN-Réunion, the representation of moist convection needs to be parameterized. Deep convection is described by a mass-flux scheme (Bougeault, Citation1985) with a single bulk cloud representation and a moisture convergence closure. With respect to the original version, a representation of downdrafts has been added and the entrainment/detrainment rates depend upon environmental conditions. Precipitation is diagnosed (implicit infinite fall speed) and a simple microphysics description allows for evaporation, melting and freezing of precipitating condensates. Cloud condensates are diagnosed from an empirical formula depending upon the vertical gradient of the precipitation flux (i.e. rate of condensation). The convective cloud cover at a given model level is a linear function of the cloud condensate. Moist shallow convection (non-precipitating clouds) is represented by the mass-flux scheme of Bechtold et al. (Citation2001) with a CAPE closure. Cloud condensate rates are used to diagnose cloud fraction and cloud water contents. For radiative transfer computations, the resolved, shallow, and deep convective cloud properties are combined by summing the water contents and with a maximum overlap assumption for the cloud fraction in each model layer.
2.2.3. Data assimilation system.
The variational code of the ALADIN-Réunion 3D-Var is based on the incremental formulation proposed by Courtier et al. (1994) for the ARPEGE/IFS global assimilation system. The 3D-Var assimilation cycle is sequential with a 6-h period, which means that the background fields for a specific analysis time are provided by a 6-h forecast from the previous analysis. The background error covariance matrix has been computed specifically over the model domain using a 6-member ensemble of analyses by considering a 9-day period in February 2009. At each analysis, background variances are interpolated from the ARPEGE global ensemble assimilation system. With respect to the 3D-Var ALADIN designed over mid-latitudes (Fischer et al., Citation2005), the variation in latitude of the Coriolis parameter is accounted for in the assimilation. Moreover, a non-linear balance term is introduced in the background error covariance matrix to account for strong horizontal gradients.
The observations assimilated in the 3D-Var are summarized in for a particular day (30 January 2015). They include satellite radiances for polar orbiting platforms (HIRS, AMSU-A, AMSU-B/MHS, SSMI/S, ATMS, IASI, CrIS, AIRS), atmospheric motion vectors from METEOSAT-7, scatterometer ocean surface winds from the ASCAT instruments (METOP-A and B), and also few conventional observations (land surface networks, radiosoundings, aircraft measurements, BUOY and SHIP reports). In addition to these observations, a 3D analytical wind bogus vortex is calculated based on the information contained in TC warning reports (16 bogus points in two concentric circles on each of four atmospheric levels) (Montroty et al., Citation2008). Observations available 3-h before and after the analysis time are considered in the assimilation and assumed to be valid at the analysis time (i.e. the FGATFootnote approach is not used). The observing system is dominated by satellite data that represent 99% of the total observations. The infra-red radiances from four hyperspectral instruments contribute to 64% of the observations, and then comes the AMSU-A radiances with 20%. This very large percentage of observations provides information on temperature and humidity in clear-sky conditions and above cloud top, but the number of channels sensitive to humidity only represents 10% of the total. When considering microwave sounders and imagers that are informative on atmospheric humidity (SSMI/S, AMSU-B, ATMS), they only represent 5% of the total observations. This explains the strong interest for the use of MT instruments in models such as ALADIN-Réunion to bring additional information on water vapour (and condensed water in the future).
Fig. 2 Percentage of observation types assimilated in ALADIN-Réunion over 1day (four analysis cycles) on 30 January 2015 together with the corresponding percentage of information content (DFS: degree of freedom for signal). The total number of observations is 437691 and the total value of the DFS is 26585.
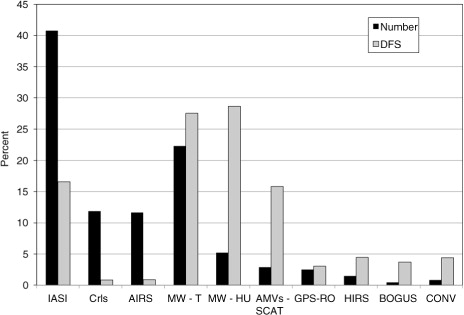
When examining the information content of observations on the analysis as measured by a degree of freedom for signal (DFS) following the method of Chapnik et al. (Citation2006), the contributions are more evenly portioned among the various instruments and the different atmospheric variables (). Satellite temperature sounding instruments contribute to 49% to the DFS whereas instruments informative on water vapour contribute to 28%. The contribution to the DFS of instruments informative on wind (scatterometers and cloud motion vectors) reaches 16%. It also interesting to notice that the ‘bogus data’ representing only 0.5% of the total observations reach almost 4% in terms of DFS, revealing their importance on the final analysis (even though the DFS measure does not give any information on the quality of the resulting forecast).
Every 6h an SST analysis at the resolution of ALADIN-Réunion based on a 2D Optimum Interpolation is performed using BUOY and SHIP reports with a relaxation towards the global daily SST OSTIA analysis (Donlon et al., Citation2012), since the surface network of conventional observations is rather sparse.
3. Simulation of all-sky radiances
3.1. The radiative transfer model RTTOV-SCATT
The SAPHIR radiances have been computed with the RTTOV-SCATT radiative transfer model developed by Bauer et al. (Citation2006a) (version 10 available from the NWP SAF web site). This radiative transfer model that assumes plane parallel atmospheres has two components. The gaseous absorptions by oxygen and water vapour are computed using the clear-sky version of RTTOV (Eyre, Citation1991; Saunders et al., Citation1999) where the transmission functions on a fixed vertical pressure grid are efficiently estimated from linear statistical regressions with a set of relevant predictors. The coefficients of the regression are pre-computed from the Millimeter Propagation Model (Liebe, Citation1989; Liebe et al., Citation1992), a set of atmospheric profiles and the instrumental spectral response of the instruments of interest. In order to simulate cloudy and rainy atmospheres, absorption and scattering by hydrometeors have to be described. RTTOV-SCATT solves the radiative transfer equation within clouds using the two-stream Eddington approximation, with a delta-scaling to account for the fractional forward peak of the phase function (Joseph et al., Citation1976). It has been shown that this simple method is a good compromise between efficiency and accuracy in radiative transfer intercomparisons (Kummerow, Citation1993; Smith et al., Citation2002). The hydrometeor radiative properties (extinction coefficient, single scattering albedo, asymmetry coefficient) are given in look-up tables depending upon temperature, frequency, and hydrometeor contents for snow, rain, cloud droplets and ice crystals. These properties have been pre-computed assuming spherical shapes for the hydrometeors and different densities (1000 kg/m3 for rain and cloud droplets; 900kg/m3 for ice crystals and 50kg/m3 for snow). Snow spheres are assumed to be a mixture of air and ice (Maxwell-Garnett model). Scattering properties are described for all hydrometeors using the Mie theory. They will be also derived from a more general approach, explained afterwards, that relaxes the spherical shape assumption of hydrometeors. Radiative properties for individual particles can be integrated over a parcel volume once a PSD is specified: a modified Gamma-shape for cloud water and ice particles and an exponential shape for liquid and solid precipitation. Finally, when a mixture of hydrometeors is present in the volume of interest, radiative properties are averaged according to Bauer (Citation2001). The RTTOV-SCATT model (v10) uses precipitation fluxes as input values. Therefore the hydrometeor contents q r/s produced by the Lopez large-scale precipitation scheme are converted into fluxes R r/s using the constant fall velocity assumption V r/s defined in the parameterization: R r/s =ρa V r/s q r/s where ρ a is the air density.
The top of the atmosphere brightness temperatures T
b
combine the clear-sky (from atmospheric gases) and the cloudy (from hydrometeors) contributions according to the fractional cloud cover as a linear combination:1
The total effective cloud fraction C* was defined by Bauer et al. (Citation2006a) with a maximum cloud overlap assumption. This proposal was recently improved by Geer et al. (Citation2009) defining it as a weighted average of cloud fraction at each model level by the hydrometeor contents in order to better describe beam filling effects. Regarding the microwave surface properties, the FASTEM-4 model is used to compute emissivity over oceans (Bormann et al., Citation2012) and a constant value of emissivity of 0.8 is imposed over continents.
The RTTOV-SCATT model has been used successfully in variational data assimilation systems in NWP context (Bauer et al., Citation2006b; Deblonde et al., Citation2007). Indeed it is very efficient from a computing point of view and its linearized versions are available to estimate efficiently the gradient of brightness temperatures with respect to model variables (i.e. Jacobians). It is important to mention that, despite the fact that RTTOV-SCATT can simulate all-sky radiances for a range of frequencies between 1.4 and 200GHz, the ECMWF operational assimilation system was until recently only using low frequencies over oceans that are mainly sensitive to cloud liquid water and liquid precipitation. The simulation of higher frequencies (above 100GHz) is more challenging given the fact that scattering by solid particles becomes non-negligible with many uncertainties associated with the specification of their radiative properties (larger variability in particle shape, density and distribution), as shown hereafter.
3.2. Results from sensitivity studies
We have retained a monthly period in February 2012 (southern hemisphere summer) where convective activity was rather intense in the Indian Ocean, with three long lasting tropical storms (Giovanna, Hilwa, Irina) and the propagation of a MJO. During this period, 3D-Var analyses and 6-h short-range forecasts have been run with the observing system available at the time, that was significantly reduced with respect to the one presented in (February 2015). Indeed, instruments on board two satellites METOP-B (AMSU-A, MHS, IASI, GRAS, ASCAT) and NPP (ATMS, CrIS) could not be considered since the operational NWP systems at Météo-France were not yet ready to assimilate them.
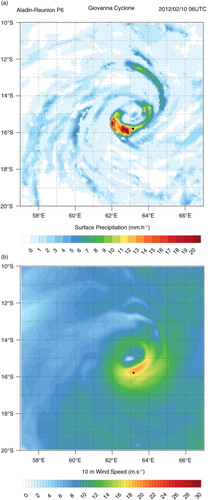
First an atmospheric profile has been taken from a 6-h forecast valid at 0600 UTC 10 February 2012 within the Giovanna cyclone having its central position at 15 ° S and 63 ° E (close to centre of ALADIN-Réunion domain). Giovanna was that day in a phase of rapid intensification going from a moderate to a severe tropical storm and moving westward near Madagascar Island. shows the instantaneous surface precipitation rate and the 10-m wind intensity simulated by a 6-h forecast of ALADIN-Réunion initialized by its own analysis. The precipitation field exhibits patterns following the counter-clockwise spiral bands of the cyclone. The maximum intensity (20mm/h) is located South West from the eye within a ‘U’ shape intense band. A second band of intense precipitation (above 8mm/h) is located further way from the eye in the North East direction. Other precipitating spiral bands can be noticed but with much lower intensities (less than 5mm/h). The surface winds exhibit an asymmetric structure around the central position of the cyclone with maximum values of 20m/s in the southeastern part of the system.
Fig. 3 (a) Instantaneous surface precipitation rate and (b) 10-m wind speed simulated by a 6-h forecast of the ALADIN-Réunion model (10 February 2012 at 0600 UTC) over an area encompassing the tropical cyclone Giovanna. The black dot corresponds to the location of the atmospheric profiles shown in .
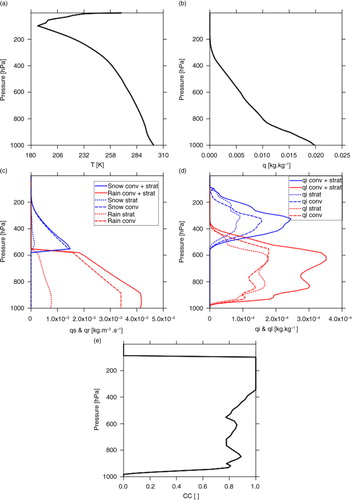
The selected profile is indicated by the black dot in and is located in the southern part of the cyclone, around 0.5 ° from its centre and is associated with significant surface precipitation (14mm/h) and intense winds (20m/s). It has been chosen to examine the Jacobians from the RTTOV-SCATT radiative transfer model (gradients of brightness temperatures with respect to model profiles). In that context, the simulation is performed assuming nadir viewing geometry. Temperature, specific humidity, hydrometeor profiles and total cloud cover are displayed in . This profile exhibits a typical decrease of temperature and water vapour with altitude: the boundary layer is characterized by warm and moist conditions (300K and 20g/kg) and the tropopause is located at 100hPa. Clouds extend from 900hPa up to the tropopause. The cloud cover increases from values around 0.8 in the low and mid-troposphere to values of 1.0 at high levels between 300 and 100hPa, corresponding to a convective anvil. The total effective cloud cover C* used in the microwave radiation scheme reaches 0.87. The warm cloud extends up to 600hPa, with a mixed phase up to 400hPa and a cold cloud above with significant amounts of ice crystals. The mixed phase region is present for cloud hydrometeors whereas for precipitating hydrometeors the transition is very sharp near the 0 ° isotherm at 580hPa. Precipitation fluxes are dominated by convection, the resolved contribution being negligible in the cold part of the cloud. Cloud condensates are more evenly distributed between resolved and subgrid components.
Fig. 4 Atmospheric profiles from a 6-h forecast of the ALADIN-Réunion model (10 February 2012 at 0600 UTC) at a location given in , for (a) temperature (T), (b) specific humidity (q v ), (c) liquid and solid precipitation fluxes including stratiform and convective contributions (q r , q s ), (d) cloud liquid and ice water contents (q l , q i ), and (e) cloud cover (CC).
The Jacobians are presented as perturbations in brightness temperature δT
b
by scaling the actual value with a perturbation δ
x equals to 10% of the profile of the variable of interest x except for temperature where a value of 1K has been chosen:2
In a sensitivity study (not shown), we have checked that model vertical grid spacing does not affect the vertical structure of the Jacobians. The temperature Jacobian (a) reveals the sounding capacity of the instrumentFootnote with a maximum value of 0.09K for channel H6 at 500hPa and a maximum value 0.14K at 300hPa for channel H2. These values are consistent with similar instruments such as AMSU-B and even AMSU-A in the 50GHz oxygen band (Garand et al., Citation2001), but due to their strong non-linear dependency with water vapour load, humidity sounders are not suitable for temperature retrievals. The Jacobian for specific humidity (b) also reveals the sounding capacity of this absorption band, with maximum values at different heights according to the various channels.
Fig. 5 Scaled Jacobians of SAPHIR brightness temperatures T
b
(i.e. multiplied by a reasonable perturbation size to produce a T
b
change in K) with respect to (a) temperature , (b) specific humidity
, (c) cloud liquid water content
, (d) cloud ice water content
, (e) snow water content
and (f) rain water content
for the profiles shown in .
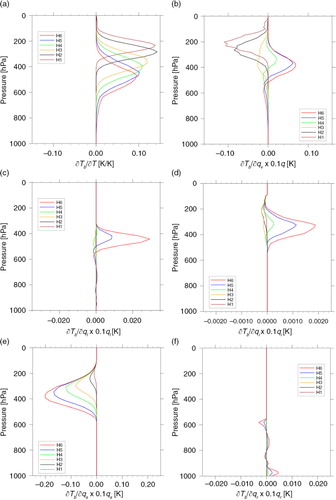
The presence of high concentrations of snow above 500hPa modifies significantly the structure that these Jacobians would have in clear-sky conditions: instead of being negative (an increase in specific humidity increases atmospheric opacity) they exhibit positive values for the three lowest peaking channels between 500 and 300hPa (water vapour emission over a strongly scattering medium that acts as a cold surface). The significant values in δT
b
noticed around 200hPa tend to indicate the capacity of the instrument to provide information on upper tropospheric water vapour. However, this cloudy area being saturated in water vapour, the Jacobians can only be interpreted in the context of physical constraints that are outside the knowledge of RTTOV-SCATT (e.g. physically any increase in water vapour necessary to match observed T
b
would be transformed in cloud ice at that levels). For hydrometeors, it appears that the Jacobian with respect to solid precipitation dominates over the other Jacobians with perturbed values in terms of δT
b
that are around one order of magnitude larger: 0.2K vs. 0.025K for the maximum values. Liquid clouds contribute to a tiny increase in brightness temperatures through emission. Similarly, the very small values for liquid precipitation and ice cloud indicate that SAPHIR T
b
s are not sensitive to these hydrometeors. Indeed, scattering processes by ice crystals can be neglected because their size is too small. Absorption and scattering by cloud and rain particles are masked by the scattering processes from snow particles aloft. The sounding capacity of the six SAPHIR channels can be noticed on the Jacobians : H1 (closest to the line centre) is mostly sensitive to the cloud top snow content, whereas H6 (farthest from the line centre) is sensitive to the snow integrated column (leading logically to properties close to window channels at 90 or 150GHz). Such sounding features are not present for the other hydrometeor Jacobians: the largest values are obtained for channel H6 (the closest to a window channel) and the lowest ones for channel H1. The largest positive values of
take place in the mixed phase layer.
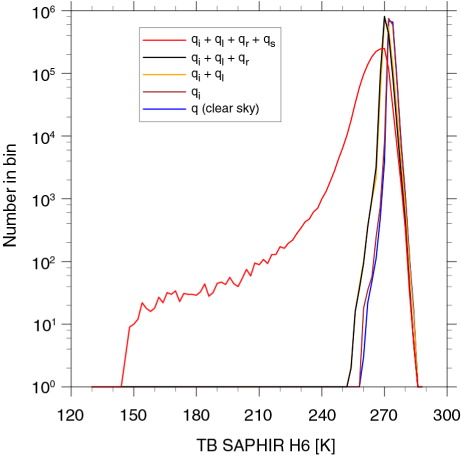
The dominance of frozen precipitation on the SAPHIR T b signal is confirmed by examining simulated brightness temperatures over the whole month of February 2012 (four 6-h forecasts every day) for all ocean grid points of the ALADIN-Réunion domain where surface precipitation has been diagnosed by a 1mm/h threshold (1 440 000 profiles). RTTOV-SCATT simulations have been performed by adding progressively hydrometeors on top of a clear-sky atmosphere, and the corresponding distributions of T b are displayed in . The impact of ice crystals is negligible in agreement with the size of Jacobians shown in , the mean of the distribution remaining very close to 272K with a spread around 20K. The inclusion of liquid hydrometeors induces a slight decrease of the T b values by about 5K. Finally, the presence of snow leads to a significant displacement of cold temperatures towards much lower values induced by scattering processes. Minimum values reach 150K (even though for only 10 profiles) instead of 250K without snow in the atmospheric column. This sensitivity study confirms the importance of solid precipitating hydrometeors on the brightness temperatures at 183GHz. This explains why a number of studies have used the AMSU-B sounding instrument at 183GHz for retrieving snowfall over mid-latitudes (e.g. Kim et al., Citation2008).
Fig. 6 Distributions of simulated SAPHIR T b (Channel 6) over the ALADIN-Réunion domain in a nadir viewing geometry (February 2012; sample size: 1440000 profiles) with RTTOV-SCATT by introducing progressively hydrometeors (cloud and precipitation) on clear-sky profiles. The introduction of frozen precipitation corresponds to the red curve.
3.3. Snow radiative properties
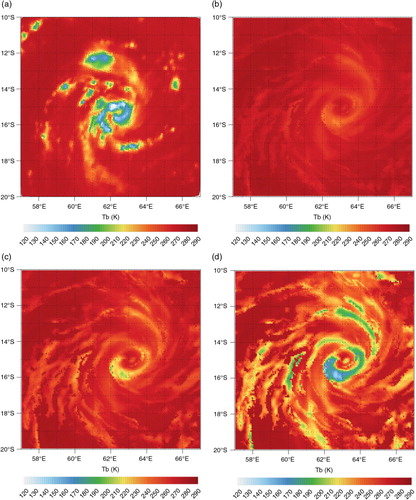
Given the strong sensitivity of the 183GHz channel to solid precipitation, special care has been taken to the specification of radiative properties. A first comparison of SAPHIR radiances simulated by the RTTOV-SCATT model over the Giovanna cyclone revealed that despite a reasonable location of the cyclone by the ALADIN-Réunion 6-h forecast (thanks to the bogus observations included in the previous analysis) and significant surface rainfall rates (up to 20mm/h as shown in ) the brightness temperatures are much too high as displayed when comparing observed (a) and simulated (b) values for channel H6. Minimum temperatures are around 230K in the simulation where values below 120K have been measured in the core of the cyclone.
Fig. 7 (a) Observed SAPHIR T b (H6) for cyclone Giovanna (10 February 2012 at 0600 UTC), and simulated T b with ALADIN-Réunion 6-h forecast and RTTOV-SCATT assuming various snow radiative properties: (b) Mie spheres and exponential PSD, (c) ‘Sector snowflake’ and Field et al. (2007) PSD, (d) ‘Block hexagonal column’ and Field et al. (2007) PSD.
The simulation of microwave scattering properties by solid precipitating particles raises a number of difficulties. The variety of shapes and densities present in nature cannot be precisely specified in NWP microphysical schemes or in radiative transfer models. For example, the density chosen in the RTTOV-SCATT model would correspond to ‘dry snow’ and the fall velocity of 1.5m/s in the Lopez microphysical scheme is also compatible with such type of particle, but there are many others in nature (hail, graupels, wet snow, aggregates, etc.).
The lack of scattering by frozen precipitation at high microwave frequencies with RTTOV-SCATT was recently identified by Geer and Boardo (Citation2014) who also noticed too strong scattering at low microwave frequencies. Indeed, assuming that snow particles are ‘soft spheres’ is convenient since the Mie theory can provide analytical scattering properties, but it is not very realistic. Geer and Boardo (Citation2014) proposed a number of improvements to the original RTTOV-SCATT model without changing the radiative transfer equation. They have considered radiative properties for individual solid hydrometeors of various sizes, shapes and densities tabulated by Liu (Citation2008) as a function of size, temperature and frequency (defining the dielectric properties of the medium) resulting from numerical simulations based on the Discrete Dipole Approximation (DDA) (Draine and Flatau, Citation1994).
Two other aspects were improved when going from particle scattering properties to bulk scattering properties. The mass-diameter laws (m(D)=αD β ) combining the information on particle shape and density have been taken from a data base proposed by Kulie et al. (Citation2010) for the particles chosen by Liu (Citation2008). The values of α and β are displayed in , showing that there are three main particle types: hexagonal shapes with various aspect ratios (3D particles with β=3 and rather high densities with α values between 30 and 200, compatible with ice crystals), rosettes that are arrangements of hexagonal columns (particles with 2D-like shape since β=2.37 and lower densities with α=0.32 indicating a significant fraction of air in the volume), and snowflakes that are also 2D particles with even lower densities than rosettes. The PSD has been improved by relaxing the classical Marshall-Palmer formula and using the recent formulation of Field et al. (Citation2007) based on the concept of normalized distribution allowing to propose ‘universal’ shapes when two moments are known (e.g. mean diameter and ice water content).
Table 2. Coefficients of a mass-diameter law: m=αD β (Kulie et al., Citation2010) for various snow and ice particles from a database of radiative properties in the microwave spectrum (Liu, Citation2008)
An optimal choice of particle has been proposed by Geer and Boardo (Citation2014) based on the reduction of differences between observed and simulated T b s in all-sky conditions using short-range forecasts from the ECMWF global model over a large sample of profiles and a rather wide range of frequencies from 10 to 183GHz. The ‘sector snowflake’ particle selected at ECMWF has been used to simulate the SAPHIR T b for the Giovanna cyclone. The simulation of SAPHIR channel H6 with this particle shows (c) that the scattering by snow has been significantly enhanced with respect to the use of ‘soft spheres’ from Mie theory. Minimum values are close to 190K in the South-Western part of the cyclone core. However, simulated temperatures remain systematically overestimated in cloudy regions (shown for H6 but also evidenced for all other channels).
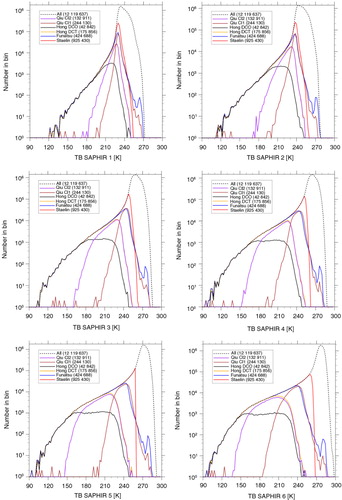
Instead of using the particle chosen by Geer and Boardo (Citation2014), we have performed an optimal choice over the ALADIN-Réunion geographical domain with T b simulated by 6-h forecasts (i.e. model background from the 3D-Var data assimilation system). This is justified by the fact that we use a model with different moist physics over a tropical area with an interest that is limited to the simulation of the 183GHz channel. The month of February 2012 has been chosen and a rainfall detection criterion has been defined based on SAPHIR radiances in order to compare only precipitating profiles both in the model and in the observations. The TRMM Multisatellite Precipitation Analysis (TMPA) 3B40RT (Huffman et al., Citation2007) product providing every 3-h instantaneous precipitation rates derived from conical scanning microwave radiometers at 0.25 ° resolution has been collocated with SAPHIR T b s during the month of February 2012. Rainy pixels are identified in TMPA with a threshold of 1mm/h. A number of studies propose rain occurrence criteria based on channels from the AMSU-B humidity sounder (Staelin and Chen, Citation2000; Hong et al., Citation2005; Qiu et al., Citation2005; Funatsu et al., Citation2007).
We have applied to SAPHIR channels a number of published criteria for the AMSU-B instruments. For that, we have used channels H2, H3 and H5 that are the closest to AMSU-B frequencies. The SAPHIR and TMPA pixels are compared when the time difference is less than 30min and the spatial distance of the central points is less than 7km. From an initial set of 12 028 975 SAPHIR radiances and 6 083 040 TMPA precipitation rates, a sample of 811 472 collocated (in space and time) data has been retained. Six criteria defined in have been compared and assessed in terms of classical categorical scores [Frequency Bias Index (FBI), Probability Of Detection (POD), False Alarm Ratio (FAR), Equitable Threat Score (ETS)] that are displayed in (definitions can be found in Hogan and Mason (Citation2012) for example). It appears that the Funatsu criterion leads to the largest values in terms of POD and ETS, and that the FBI value is the closest to one (smallest bias). The Hong DCT and Qiu CI2 have the lowest FAR values that are counterbalanced by poor detection values.
Table 3. Definition of six criteria proposed by Staelin and Chen (2000), Hong et al. (2005), Qiu et al. (2005) and Funatsu et al. (2007) for rain occurrence based on various thresholds applied to three SAPHIR channels (H2, H3 and H5) adapted from AMSU-B channels
Table 4. Categorical scores of rain occurrence following various criteria using SAPHIR channels () against a precipitation threshold above 1mm/h from the TMPA 3B40RT product over the month of February 2012 within the ALADIN-Réunion domain (811 472 collocated values)
The distribution of observed SAPHIR T b s for the month of February are displayed in for all radiances and for rainy radiances sorted according to the criteria defined in . It appears that with the Funatsu criterion a largest sample of observations is kept. Other criteria have difficulties to retain very cold temperatures (Qiu) or warm temperatures (Hong). A rather small sample (around 100) of T b values above 270K is retained with the Funatsu criterion that is less apparent with other criteria (Staelin, Qiu CI1). Being located on the warm side of the T b distribution they are very likely representative of non-precipitating situations. Therefore we have added a threshold on channel H6 (T b <270K) to the Funatsu criterion in order to identify rain occurrence from the SAPHIR brightness temperatures. It is interesting to notice that the Funatsu criterion developed over the Mediterranean region appears to be also well suited for tropical regions.
Fig. 8 Distributions of observed SAPHIR T b for the six channels in February 2012 over the ALADIN-Réunion domain. The dashed curves represent the distributions with all observations (clear-sky and cloudy scenes) and the coloured curves represent the distributions of T b kept by the various rain occurrence criteria summarized in .
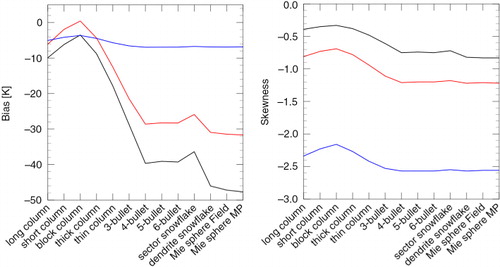
For the month of February 2012, SAPHIR T b channels H1, H4 and H6 have been simulated using RTTOV-SCATT for profiles with a surface precipitation rate larger than 1mm/h and compared to observed values satisfying the modified Funatsu criterion. The radiative transfer model has been run for the 12 particle types available in the Liu data base. The bias and the mean skewness of the differences between observed and simulated T b have been computed () showing that the ‘block hexagonal column’ particle () leads to the smallest values for the three channels.Footnote This result means that with this choice, the underlying assumptions for the optimality of the assimilation system are satisfied (unbiased and Gaussian errors). The largest bias is obtained for H6 with the original version of RTTOV-SCATT (spheres with Marshall-Palmer distribution). The optimal particle proposed by Geer and Boardo (Citation2014) maintains significant biases in this experimental context. The simulation of channel H6 with the ‘block hexagonal column’ reveals larger regions with very low T b even though not always located at the right place (b). The important and realistic reduction of T b s in the core of the cyclone down to 150K has been obtained at the expense of too low values in the outer regions of the system particularly in the southern part of the domain. This feature can reflect the fact that one single particle cannot characterize the whole variety of scattering properties that exists in nature over this region. The α parameter of the mass-diameter law suggests that such precipitating particles could be associated to ‘hail’ rather than to ‘dry snow’ as suggested by the Lopez's scheme. Indeed, the contribution of ‘resolved’ precipitation is rather small compared to that of convective precipitation for the severe tropical storms sampled in February 2012 over the Indian Ocean (e.g. ). Therefore, such choice is more likely to occur in restricted tropical areas than when considering all precipitating systems at global scale as in the study of Geer and Boardo (Citation2014).
Fig. 9 Differences between observed and simulated (6-h forecasts from ALADIN-Réunion in February 2012) SAPHIR T b for three channels (H1: blue curves; H4: red curves; H6: black curves) for rainy grid points and rainy satellite pixels with varying radiative properties of snow particles according to Liu (2008), with also Mie spheres using either Marshall-Palmer (MP) or Field et al. (Citation2007) PSDs. The differences are measured in terms of bias (left panel), and skewness (right panel).
4. Inversion of all-sky radiances
4.1. Choice of a methodology
The capacity of the NWP model ALADIN-Réunion to simulate all-sky radiances from the microwave sounder SAPHIR onboard MEGHA-TROPIQUES using the radiative transfer model RTTOV-SCATT has been demonstrated in Section 3. This model has some skill in simulating SAPHIR radiances but significant differences still exist despite improved scattering properties of solid precipitating hydrometeors in RTTOV-SCATT. The inversion of SAPHIR radiances could help to improve the initial conditions of ALADIN-Réunion in rainy systems where no other observations are available except Atmospheric Motion Vector derived winds. However, there is no single method to perform such inversion.
The assimilation of all-sky microwave radiances in a variational system requires linearized physical processes as part of the observation operator if the model variables to be analysed do not contain the hydrometeors (e.g. Geer et al., Citation2010). On the other hand, when the hydrometeors are analyzed, their background error covariance matrices are needed by the assimilation system (Martinet et al., Citation2013). However, none of these requirements is fulfilled by the ALADIN-Réunion model and data assimilation system. This explains why Montroty et al. (Citation2008) developed with ALADIN-Réunion a two-step approach for the assimilation SSM/I brightness temperatures in rainy areas. Pseudo-observations (i.e. retrievals) of total column water vapour (TCWV) in rainy areas were generated from statistical regressions between a set of five SSM/I brightness temperatures and ECMWF analyses and then assimilated in the ALADIN 3D-Var. This approach had the advantage of not requiring a complex observation operator to simulate radiances in rainy areas. On the other hand, it relied on ECMWF water vapour fields and on rainy radiances assimilated at ECMWF, making the maintenance and the evolution of such system for the generation of pseudo-observations rather difficult.
Another approach of interest is the Bayesian inversion that only needs the forward model to simulate observations and a database of profiles that can be derived from NWP model short-range forecasts. It has been used successfully for the retrieval of precipitation from microwave radiances (Kummerow et al., Citation2001) and also for the operational assimilation of radar reflectivities in the Météo-France convective scale model AROME (Wattrelot et al., Citation2014). In the following, we explore the relevance of the Bayesian inversion on a case study.
4.2. Description of the case study
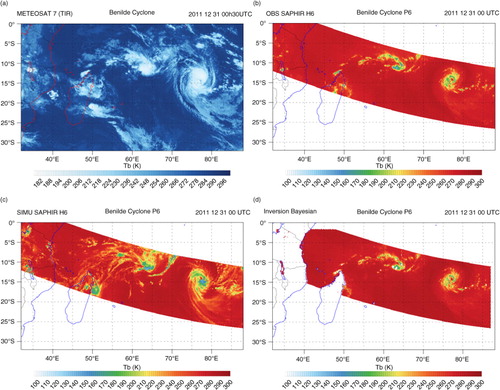
We consider the TC Benilde on 31 December 2011 at 0000 UTC. For this specific date, MADRAS radiances allowing the evaluation of the Bayesian inversion with independent observations. This TC, that lasted from 28 December 2011 to 4 January 2012, was at that time quickly intensifying in a westerly flow. The core of the system is located at 14 °S and 77 °E as shown in a [Infra-Red (IR) T b at 11.5 µm from METEOSAT-7] and b [MicroWave (MW) SAPHIR H6 T b ]. A rather intense mesoscale convective system with a smaller spatial extent compared to Benilde but with rather low T b s (about 150K for SAPHIR and 190K for METEOSAT-7) is developing around 12 °S and 63 °E. Similarly along the North coast of Madagascar Island a small area of intense convection has a signature in both IR and MW images.
The simulation of SAPHIR H6 T b (c) with RTTOV-SCATT and a 6-h forecast of ALADIN-Réunion demonstrates the capacity of this regional model to predict the position of the main convective systems present in the domain with significant skill, the simulated patterns being present in the IR and/or MW images. Simulated SAPHIR T b s with intermediate values around 210K have a too large spatial extent with respect to the observed ones, even though they are associated with cloudy regions as revealed by rather cold IR T b values reaching 230K compared to the warm background around 290K. Near Madagascar, the small scale intense convective system noticed North of the island is absent in the model whereas the mesoscale system located on the eastern side has a too strong signature in the MW simulation despite the existence of a signature in the IR. The central position of Benilde with an eye present both in the simulated and observed SAPHIR H6 T b has a correct location in the model thanks to the ‘bogus’ data used in the previous analysis. In the following, we examine how a Bayesian inversion can help to correct these differences.
4.3. Description of the Bayesian inversion
An optimal state x
a
of an atmospheric vector x knowing a set of observations y
o
can be given by the expectation of the Probability Density Function (PDF) P(x=x
t
|y=y
o
), that is:3
Using the Bayes's theorem stating that P(x|y)=P(y|x)P(x)/P(y), and assuming Gaussian PDFs, one can write:4
where y(x) is the simulated observations given an atmospheric state x and R is the error covariance matrix. The a-priori probability that x is the true state of the atmosphere x
t
is generally expressed as the probability of the deviation of x from some initial background state x
b
, and assuming that the probability P(x–x
b
) has a Gaussian form:5
where B is the background error covariance matrix.
This leads to a minimum variance solution that minimizes a cost-function. Olson et al. (Citation1996) highlighted a number of difficulties of the variational approach for the retrieval of atmospheric profiles (including hydrometeors) from microwave brightness temperatures: the computational cost associated with the estimation of the gradient at each iteration of a minimization process, non-linearities that could lead to multiple minima in the search and also the specification of background errors that are non-Gaussian for hydrometeors water contents. They proposed an alternative approach to make an approximate evaluation of the integral expression in eq. (4), that relies on a database of atmospheric profiles x
j
. The integrals in eq. (4) are replaced by summations over model simulated profiles present in the database:6
where A is a normalization factor:7
The above expression shows that the analysis is a weighted average of the database profiles, with large weights given to the ones simulating accurately the observations. Olson et al. (Citation1996) stated that the main assumption of the approach is that profiles from the database occur with nearly the same frequency as those found in the region where the retrieval method is to be applied. In that case, the weighting by P(x=x t ) in eq. (4) is represented by the relative number of occurrences of a given profile x j in the summation of eq. (6). Therefore, the relative frequency of simulated profiles should be roughly the same as that of naturally occurring profiles. In practice, the database of profiles is taken from a 6-h forecast of the ALADIN-Réunion model, as proposed by Caumont et al. (Citation2010) and Wattrelot et al. (Citation2014) for the assimilation of radar reflectivities with a similar method. The observations are a set of 6 SAPHIR brightness temperatures. They are simulated with RTTOV-SCATT and ALADIN-Réunion atmospheric profiles. For each observation, a limited number of model profiles (N) located in its neighbourhood are selected to compute the summation in eq. (6) and (7) A static bias correction scheme is considered in order to account for biases in the radiative transfer model (Chambon et al., Citation2014). This correction that varies between −1K for H1 and 2K for H6 is rather small in cloudy atmospheres regarding the other sources of discrepancies.
4.4. Results
In the current experimental set-up, the SAPHIR radiances are first projected on the ALADIN-Réunion model grid (avoiding afterwards model interpolations at observation point) to the nearest grid point. Then, model profiles x are retrieved according to eq. (6). Around each observation location, model grid points having an observation counterpart (simulated T
b
) are searched within a square box of 50×50 points (400×400km2). The total number of profiles in the summation of eq. (6) varies between 400 and 1500 points (mean value of 1178). With a smaller box (e.g. 20×20 points), the Bayesian inversion is more efficient from a computing point of view but the probability of finding simulated observations in agreement with observed T
b
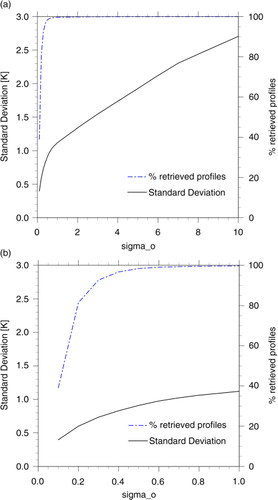
is lower, leading to lower weights in the summation. When the weights are too small, the retrieval becomes meaningless from both physical and computational point of views. The observation error covariance matrix R is set diagonal with elements equal to K2 (same value for all channels and no interchannel error correlations). Such specification is consistent with the radiometric noise values presented in . Wattrelot et al. (Citation2014) showed that it is better to impose a rather small observation error in order to get retrievals close to observations, thereby reducing the effect of using twice the background information in a two-step approach (1D+3D-Var) for assimilation. shows that with too small values of σ
o
the fraction of profiles that can be retrieved is strongly reduced (e.g. 40% with σ
o
=0.1K) and that with too large observation errors, the retrieved profiles lead to simulated brightness temperatures quite far from the observed ones (e.g. the mean standard deviation of departures
reaches 2.6K for σ
o
=10K whereas it is only 1K for σ
o
=1K).
Fig. 10 Sensitivity of the Bayesian inversion to the specification of observation error on retrieved SAPHIR T b s for the tropical cyclone Benilde (31 December 2011 at 0000 UTC) described by the fraction of profiles that can be inverted and by the standard deviation between observed and retrieved brightness temperatures, for values ranging between (a) 0.1 and 1K and (b) 1 and 10K.
d displays the capacity of the Bayesian inversion to retrieve a field of T b for channel 6 that is very close to the observations. The retrieved T b s have been computed with the radiative transfer model RTTOV-SCATT using the retrieved profiles. The important regions in the background field with T b values below 210K have been significantly increased (e.g. the convective system on the East coast of Madagascar). The creation of low T b values when missing in the background can be difficult in some areas when they have a small spatial extent. This is the case for example for the convective system North of Madagascar that cannot be created and for some grid points in the convective system between Madagascar and Benilde, where the retrieval has not been successful.
Fig. 11 (a) Observed METEOSAT-7 Infra-Red brightness temperature at 11.5µm at 0000 UTC 31 December 2011 for tropical cyclone Benilde. (b) Observed, (c) simulated and (d) retrieved with a Bayesian inversion of channel H6 microwave SAPHIR brightness temperature for the same event.
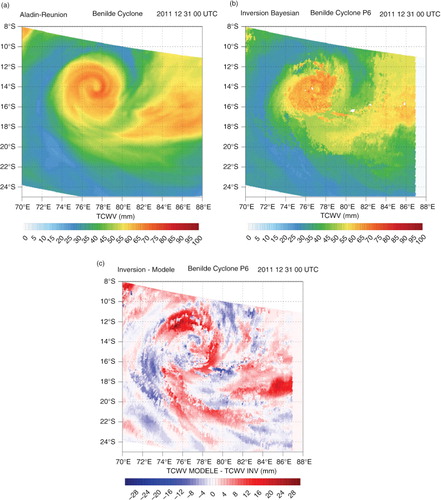
The changes induced on the water vapour field are displayed in c for the TCWV, together with the background (a) and retrieved (b) fields. Regions associated with a significant decrease in TCWV, such as in the spiral band located on the Northern part of the cyclone (up to 20mm), were corresponding to a strong underestimation of the T b by more than 50K. The creation of small scale rainy structures on the southeastern side of the cyclone revealed by a significant reduction in T b (d) corresponds to increments in TCWV around 15mm. Despite a spatially coherent retrieved field of TCWV, it appears to have much smaller scales than the background field. Indeed the Bayesian inversion can retrieve structures at the model grid scale whereas the smallest scales resolved by the ALADIN model are of the order of 5–7 grid points. Such small scales will be filtered when introducing inversed profiles in a 3D-Var assimilation, either through a data spatial thinning or through the filtering properties of the background error covariance matrix. Too large values of TCWV corrections could be used as quality control in order to discard the corresponding retrieved profiles from entering the 3D-Var system.
Fig. 12 TCWV (expressed mm) from a 6-h forecast of the ALADIN-Réunion model (a), produced by the Bayesian inversion of SAPHIR T b (b) together with the difference of the two fields (showing the corrections induced by the SAPHIR observations) (c) over the tropical cyclone Benilde (31 December 2011 at 0000 UTC).
4.5. Evaluation of the inversion with MADRAS radiances
The quality of the retrieved profiles from the Bayesian inversion has been assessed by simulating the 9 T b s from the MADRAS microwave imager that were available for this particular date. The MADRAS instrument measures the Earth's radiation in five frequency bands: 18.7, 23.8, 36.5, 89 and 157GHz with V and H polarizations except for the 23.8GHz channel (V only) located in the water vapour absorption band. The pixel resolution is 40×67.25km2 for the three lowest frequencies, 10×16.81km2 for the 89GHz channel and 6×10.1km2 for the 157GHz channel. These resolutions are constant along the conical scan of the instrument with a 1700km swath with 54pixels along a scan line for the three lowest frequencies, 214 for the 89GHz and 356 for the 157GHz. The brightness temperatures are mapped on the ALADIN-Réunion model grid using the nearest neighbour approach.
The RMS differences of observed and simulated T b s are presented in over the whole ALADIN-Réunion domain using the background profiles and the retrieved profiles. The RMS are systematically lower with the retrieved profiles which shows that the inversion is producing a more realistic state of the atmosphere in terms of temperature, water vapour and hydrometeors. The improvement is the largest for channels above 37GHz that is 89 and 157GHz where the RMS is reduced by values between 10 and 20K. Indeed when examining the Jacobians of the MADRAS channels, the 89 and 157GHz frequencies have rather similar signatures in terms of sensitivity to hydrometeors to the 172GHz channel (H6) from SAPHIR, in particular the large values with respect to solid precipitation (not shown). The 19GHz is mostly sensitive to liquid precipitation and to water vapour. The physical consistency of model precipitating profiles leads to a non-negligible reduction of the RMS difference for this channel by the retrievals. On the other hand, the changes produced by the retrieved profiles at 23.8 and 36.5GHz also sensitive to water vapour are rather small.
Fig. 13 RMS differences between observed and simulated all-sky MADRAS brightness temperatures with atmospheric profiles from a 6-h forecast of the ALADIN-Réunion model (blue curve) and profiles derived from a Bayesian inversion using all-sky SAPHIR brightness temperatures (red curve) (31 December 2011 at 0000 UTC).
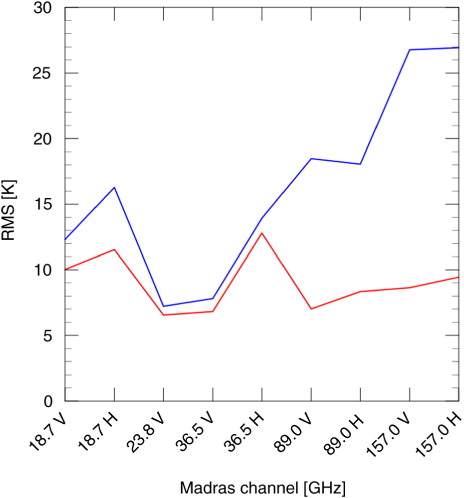
This comparison against MADRAS T b s reveals that the retrieved profiles using the six SAPHIR channels in a Bayesian inversion improve the simulation of the high frequencies that are the closest to the 183GHz absorption band (89 and 157GHz) and sensitive to the same type of hydrometeors (snow). The improvement of the low frequencies that are sensitive to water vapour is smaller. When scattering hydrometeors are present in the column at high altitudes, the emission signal of water vapour that comes from the lower troposphere does not reach the satellite radiometer. It is known that the use of scattering signatures at high microwave frequencies to derive information on liquid precipitation over continents is rather indirect (e.g. Spencer et al., Citation1989). Similarly would be the use of humidity profiles inferred in rainy areas from the Bayesian inversion of SAPHIR radiances at 183GHz. In order to have a retrieval that is better constrained by observations regarding water vapour, the combined inversion of MADRAS and SAPHIR radiances could be performed. However, such methodology cannot be envisaged for operational applications given the present unavailability of the MADRAS instrument. Nevertheless, the positive signal noticed on the 19GHz channels is encouraging enough to examine the impact of retrieved humidity profiles in the ALADIN-Réunion 3D-Var system.
5. Discussion and conclusion
The prediction of severe weather events such as TCs remains a challenge for operational forecasting centres. There are promising areas of improvements, such as the development of high-resolution NWP models with realistic representations of clouds and dynamics, the use of more frequent and more accurate data from new observing systems within dedicated data assimilation systems in order to provide better initial states for NWP models. Along these lines, since 2006 Météo-France has set-up an operational LAM over the Southern Indian Ocean: ALADIN-Réunion with a fine scale resolution of 8km. This model has its own data assimilation system based on a 3D-Var technique with a 6-h cycling. The recent MEGHA-TROPIQUES satellite, launched in October 2011 with an orbit covering only the Tropics and a humidity microwave sounder SAPHIR with six channels around 183GHz, has significantly enhanced the observing network in these regions particularly regarding the humidity field. Since April 2015, clear-sky radiances from SAPHIR are assimilated operationally in the ALADIN-Réunion 3D-Var system leading to a factor of three increase of microwave satellite humidity sounding data.
The present study is addressing the challenging issue of the assimilation of SAPHIR radiances in all-sky conditions, that is in clear-sky and in cloudy/rainy areas. This problem has been a long standing issue in NWP data assimilation (Errico et al., Citation2007; Auligné et al., Citation2011) but the efforts at ECMWF during the last 10yr resulting in an operational use of all-sky microwave radiances are encouraging enough to examine a similar methodology. A first step towards the assimilation is the capacity of the NWP model to simulate the counterpart of observations. The simulation of cloudy/rainy microwave radiances can be done with the RTTOV-SCATT radiative transfer model (Bauer et al., Citation2006a) that is based on the Delta-Eddington solution for scattering atmospheres. Modelling scattering effects by hydrometeors at 183GHz is more challenging than at lower frequencies. Indeed low frequencies (<50GHz) are sensitive to cloud droplets and rain drops for which the density and the shape are known, the main source of uncertainty being in the PSDs. At high frequencies, the upwelling radiation is governed by the scattering of solid precipitating hydrometeors, that can have many shapes (columns, dendrites, spheroids, plates, etc.) with varying densities and orientations, on top of the uncertainty on the PSDs.
The ALADIN-Réunion describes a number of microphysical processes leading to the formation of rain and snow from water vapour (e.g. accretion, rimming, collection, evaporation, sedimentation, etc.) with a number of limitations. This description is only valid for ‘resolved’ clouds, whereas all convective clouds are assumed to be ‘subgrid’ and their effects on resolved scales (heat, moisture and momentum transports) are parameterized. Despite this incomplete description of cloud systems by the model, all-sky radiances can be simulated by RTTOV-SCATT with some realism. In agreement with Geer and Boardo (Citation2014), we found that the use of ‘soft spheres’ with a Marshall-Palmer distribution underestimates considerably the scattering by solid precipitation at 183GHz. The use of revised radiative properties based on DDA simulations and ‘normalized’ PSDs in RTTOV-SCATT increases the scattering effects and produces much lower brightness temperatures than the original configuration. Since a variety of particles shapes exist for solid precipitation, a number of criteria have been defined to estimate an optimal one over a particular period in February 2012. The identification of rainy pixels with SAPHIR has been done by considering and adapting a rain detection criterion proposed by Funatsu et al. (2007) for AMSU-B over the Mediterranean. The ‘block hexagonal column’ particle leads to the best agreement between the simulated and observed SAPHIR T b s. This choice is different from the one of Geer and Boardo (Citation2014) who found the ‘sector snowflake’ particle. This can be explained by two main reasons: they used a global model with a different description of clouds and precipitation and they have examined the optimisation over a wider range of frequencies (from 10 to 183GHz). Indeed, deep tropical convective systems are often associated with frozen precipitating particles having a rather high density (hail, graupel) compared to the one of snowflakes.
Finally, preliminary tests of a Bayesian inversion have shown the capacity of the ALADIN-Réunion model to simulate SAPHIR radiances closer to the observed ones: in the vicinity of an observation, it is possible to find model profiles that can improve the T b simulation. This method has been chosen since it does not require linearized version of the radiative transfer and of the physical parameterizations schemes (Mahfouf, Citation2014) and it is used successfully at Météo-France for the operational assimilation of radar reflectivities in the convective scale model AROME (Wattrelot et al., Citation2014). It has been shown that the signal present in the SAPHIR T b s informative about the upper part of tropical convective clouds cannot be easily related to humidity changes over the whole column, particularly for TCWV that has its major contribution in the lower troposphere. A more robust inversion could be obtained by combining MADRAS and SAPHIR observations.
The study will be continued by performing an assimilation of pseudo-profiles of humidity in the ALADIN-Réunion 3D-Var for the TC Benilde and examining the impact of these additional observations on the analyses and forecasts (trajectory and intensity). The description of convective clouds in the ALADIN-Réunion model remains rather crude for the simulation of all-sky microwave radiances. Several areas will be explored: the use of a prognostic cloud convection scheme (PCMT: Prognostic Cloud Microphysics and Transport) describing explicitly the microphysical processes and the transport of condensed variables in the fraction of the grid box covered by convective clouds (Piriou et al., Citation2007). The use of PCMT should lead to more realistic hydrometeors in the convective part of the grid mesh. Another approach is to use a finer scale model describing explicitly moist convection such as AROME (Seity et al., Citation2011) but with limitations on the domain size. The AROME model offers new possibilities in terms of cloud microphysics descriptions with more prognostic condensed species such as graupels and hail. It has also a second order moment scheme providing information on number concentration on top on mass concentration to better constrain the shape of the PSDs. The evolution of variational assimilation techniques towards ensemble approaches will allow to by-pass the 1D retrieval technique. These techniques do not require linearized versions of the forecast model and the control vector can be extended rather naturally to condensed variables with flow dependent background covariance matrices generated from the ensembles once suitable localisation functions are defined (Desroziers et al., Citation2014). Such flow dependent statistics could help to produce improved error correlations between moisture and dynamical fields within convective systems.
6. Acknowledgements
We acknowledge the French Space Agency (CNES), and particularly Philippe Veyre, for the financial support of this scientific research activity (PhD grants to the first author). We also thank Philippe Chambon for his interest and useful suggestions during the course of the study. Yves Bouteloup provided extremely valuable advice regarding the representation of cloud and precipitation processes in the ALADIN-Réunion model. The perturbed assimilation experiments necessary to obtain the DFS values were kindly performed by Hervé Bénichou.
Notes
1FGAT: First Guess at Appropriate Time.
2Sounding theory: see, for example, section 6.1 from Kidder and Vonder Haar (1995) for additional explanations on spaceborne sounding radiometers.
3A sensitivity study has been undertaken where the collocated observed and simulated Tb s have been selected using the Funatsu criterion for both samples, leading to an identical result in terms of particle choice.
Related Research Data
References
- Auligné T. , Lorenc A. , Michel Y. , Montmerle T. , Jones A. , co-authors . Toward a new cloud analysis and prediction system. Bull. Amer. Meteor. Soc. 2011; 92: 207210.
- Bauer P . Including a melting layer in microwave radiative transfer simulations for clouds. Amos. Res. 2001; 57: 9–30.
- Bauer P. , Lopez P. , Benedetti A. , Salmond D. , Saarinen S. , co-authors . Implementation of 1D+4D-Var assimilation of precipitation affected microwave radiances at ECMWF. Part II: 4D-Var. Quart. J. Roy. Meteor. Soc. 2006b; 132: 2307–2332.
- Bauer P. , Moreau E. , Chevallier F. , O'Keeffe U . Multiple scattering microwave radiative transfer for data assimilation applications. Quart. J. Roy. Meteor. Soc. 2006a; 132: 1259–1281.
- Bechtold P. , Bazile E. , Guichard F. , Mascart P. , Richard E . A mass-flux convection scheme for regional and global models. Quart. J. Roy. Meteor. Soc. 2001; 127: 869–886.
- Belamari S . Report on uncertainty estimates of an optimal bulk formulation for surface turbulent fluxes. Marine EnviRonment and Security for the European Area Integrated Project (MERSEA IP), Deliverable D. 2005; 4: 29.
- Bormann N. , Geer A. , English S . Evaluation of the microwave ocean surface emissivity model FASTEM-5 in the IFS. ECMWF Tech. Memo. No 667. 2012
- Bougeault P . A simple parameterization of the large scale effects of cumulus convection. Mon. Wea. Rev. 1985; 113: 2108–2121.
- Bougeault P. , Lacarrère P . Parameterization of orography-induced turbulence in a meso-beta scale model. Mon. Wea. Rev. 1989; 117: 1870–1888.
- Bouteloup Y. , Seity Y. , Bazile E . Description of the sedimentation scheme used operationally in all Météo-France NWP models. Tellus. 2011; 63A: 300–311.
- Bubnova R. , Hello G. , Bénard P. , Geleyn J.-F . Integration of the fully elastic equation cast in the hydrostatic pressure terrain-following in the framework of the ARPEGE/ALADIN NWP model. Mon. Wea. Rev. 1995; 123: 515–535.
- Caumont O., Ducrocq V., Watterelot E., Jaubert G., Pradier-Vabre S. 1D+3DVar assimilation of radar reflectivity data: a proof of concept. Tellus A. 2010; 6 173187. DOI: http://dx.doi.org/10.1111/j.1600-0870.2009.00430.x.
- Courtier P. , Freydier C. , Geleyn J.-F. , Rabier F. , Rochas M . The ARPEGE project at Météo-France. Proc. 1991 ECMWF Seminar on Numerical Methods in Atmospheric Models. 1991; 193–231. Shinfield Park, Reading, ECMWF.
- Courtier P. , Thépaut J.-N. , Hollingsworth A . A strategy for operational implementation of 4D-Var using an incremental approach. Quart. J. Roy. Meteor. Soc. 1994; 120: 1367–1387.
- Chambon P. , Meunier L.-F. , Guillaume F. , Piriou J.-M. , Roca R. , co-authors . Investigating the impact of water vapour sounding observations from SAPHIR on board Megha-Tropiques into ARPEGE global model. Quart. J. Roy. Meteor. Soc. 2015; 141: 1769–1779.
- Chapnik B. , Desroziers G. , Rabier F. , Talagrand O . Diagnosis and tuning of observational error in a quasi-operational data assimilation setting. Quart. J. Roy. Meteor. Soc. 2006; 132: 543–565.
- Davies H. C . A lateral boundary formulation for multi-level prediction models. Quart J. Roy. Meteor. Soc. 1976; 102: 405–418.
- Deblonde G. , Mahfouf J.-F. , Bilodeau B. , Anselmo D . One-dimensional variational data assimilation of SSM/I observations in rainy atmospheres at MSC. Mon. Wea. Rev. 2007; 135: 152–172.
- Dee D. P., Uppala S. M., Simmons A. J., Berrisford P., Poli P., co-authors. The ERA-Interim reanalysis: configuration and performance of the data assimilation system. Quart. J. Roy. Meteor. Soc. 2011; 137 553597. DOI: http://dx.doi.org/10.1002/qj.828.
- Desroziers G., Camino J.-T., Berre L. 4DEnVar: link with 4D state formulation of variational assimilation and different possible implementations. Quart. J. Roy. Meteor. Soc. 2014; 140 20972110. DOI: http://dx.doi.org/10.1002/qj.2325.
- Donlon C. J., Martin M., Stark J. D., Roberts-Jones J., Fiedler E., co-authors. The Operational Sea Surface Temperature and Sea Ice analysis (OSTIA). Remote Sens. Env. 2012; 116: 140–158. DOI: http://dx.doi.org/10.1016/j.rse.2010.100172011.
- Draine B. T. , Flatau P. J . Discrete-dipole approximation for scattering calculations. J. Opt. Soc. Am. A. 1994; 11: 1491–1499.
- Duffourg F. , Ducrocq V. , Fourrié N. , Jaubert G. , Guidard V . Simulation of satellite infrared radiances for convective scale data assimilation over the Mediterranean. J. Geophys. Res. 2010; 115: D15107.
- English S. , co-authors . Impact of satellite data. ECMWF Tech. Memo No 711. 2014; 48. ECMWF, Reading, UK,.
- Errico R. M. , Bauer P. , Mahfouf J.-F . Issues regarding the assimilation of cloud and precipitation data. J. Atmos. Sci. 2007; 64: 3785–3798.
- Eyre J. R . A fast radiative transfer model for satellite sounding systems. ECMWF Tech. Memo No 176. 1991. ECMWF, Reading, UK.
- Faure G. , Westrelin S. , Roy D . Un nouveau modèle de prévision à Météo-France: Aladin-Réunion. La Météorologie. 2008; 60: 29–35.
- Field P. R. , Heymfield A. J. , Bansemer A . Snow size distribution parameterization for midlatitude and tropical ice clouds. J. Atmos. Sci. 2007; 64: 4346–4365.
- Fischer C. , Montmerle T. , Berre L. , Auger L. , Stefanescu S. E . An overview of the variational assimilation in the ALADIN/France NWP system. Quart. J. Roy. Meteor. Soc. 2005; 131: 3477–3492.
- Fouquart Y. , Bonnel B . Computations of solar heating of the Earth's atmosphere: a new parameterization. Beitr. Phys. Atmos. 1980; 53: 35–62.
- Funatsu B., Claud C., Chaboureau J.-P. Potential of Advanced Microwave Sounding Unit to identify precipitating systems and associated upper-level features in the Mediterranean region: case studies. J. Geophys. Res. 2007; 112: D17113. DOI: http://dx.doi.org/10.1029/2006JD008297.
- Garand L. , Turner D. S. , Larocque M. , Bates J. J. , Boukabara S. , co-authors . Radiance and Jacobian intercomparison of radiative transfer models applied to HIRS and AMSU channels. J. Geophys. Res. 2001; 106: 24017–24031.
- Geer A. J. , Bauer P. , Lopez P . Direct 4D-Var assimilation of all-sky radiances. Part II. Assessment. Quart. J. Roy. Meteor. Soc. 2010; 136: 1886–1905.
- Geer A. J. , Bauer P. , O'Dell C. W . A revised cloud overlap scheme for fast microwave radiative transfer. J. Appl. Meteor. Clim. 2009; 48: 2257–2270.
- Geer A. J. , Boardo F . Improved scattering radiative transfer for frozen hydrometeors at microwave frequencies. Atmos. Meas. Tech. 2014; 7: 1839–1860.
- Geer A. J. , Boardo F. , Bormann N. , English S . All-sky assimilation of microwave humidity sounders. ECMWF Tech. Memo. No 741. 2014; 59.
- Hogan R. J. , Mason I. B . Jolliffe I. T. , Stephenson D. B . Deterministic forecasts of binary events. Forecast Verification: A Practitioner's Guide in Atmospheric Science. 2012; Wiley-Blackwell, Chichester, UK. 32–59.
- Hong G., Heygster G., Miao J., Kunzi K. Detection of tropical deep convective clouds from AMSU-B water vapor channels measurements. J. Geophys. Res. 2005; 110: D05205. DOI: http://dx.doi.org/10.1029/2005JD004949.
- Huffman G. J. , Bolvin D. T. , Nelkin E. J. , Wolff D. B. , Adler R. F. , co-authors . The TRMM Multisatellite Precipitation Analysis (TMPA): quasi-global, multiyear, combined-sensor precipitation estimates at fine scales. J. Hydrometeor. 2007; 8: 38–55.
- Joseph J. H. , Wiscombe W. J. , Weinman J. A . The Delta-Eddington approximation for radiative flux transfer. J. Atmos. Sci. 1976; 33: 2452–2459.
- Kelly G. A. , Bauer P. , Geer A. J. , Lopez P. , Thépaut J.-N . Impact of SSM/I observations related to moisture, clouds and precipitation on global NWP forecast skill. Mon. Wea. Rev. 2008; 136: 2713–2726.
- Kessler E . On the distribution and continuity of water substance on atmospheric circulation. Meteorol. Monogr. 1969; 10(30): 84.
- Kidder S. Q. , Vonder Haar T. H . Satellite Meteorology: An Introduction. 1995; Academic Press, San Diego, USA. 466.
- Kim M.-J., Weinman J. A., Olson W. S., Chang D.-E., Skofronick-Jackson G., co-authors. A physical model to estimate snowfall over land using AMSU-B observations. J. Geophys. Res. 2008; 113 D09201. DOI: http://dx.doi.org/10.1029/2007JD008589.
- Kulie M. S. , Bennartz R. , Greenwald T. J. , Chen Y. , Weng F . Uncertainties in microwave properties of frozen precipitation: implications for remote sensing and data assimilation. J. Atmos. Sci. 2010; 67: 3471–3487.
- Kummerow C . On the accuracy of the Eddington approximation for radiative transferin microwave frequencies. J. Geophys. Res. 1993; 98(D2): 2757–2765.
- Kummerow C. , Hong Y. , Olson W. , Yang S. , Adler R. , co-authors . The evolution of the Goddard Profiling Algorithm (GPROF) for rainfall estimation from passive microwave sensors. J. Appl. Meteor. 2001; 40: 1801–1820.
- Laprise R . The Euler equations of motion with hydrostatic pressure as an independent variable. Mon. Wea. Rev. 1992; 120: 197–207.
- Liebe H. J . MPM- an atmospheric millimeter-wave propagation model. Int. J. Infrared Milli. Waves. 1989; 10: 631–650.
- Liebe H. J. , Rosenkranz P. W. , Hufford G. A . Atmospheric 60-GHz oxygen spectrum: new laboratory measurements and line parameters. J. Quant. Spectrosc. Radiat. Transfer. 1992; 48: 629–643.
- Liu G . A database of microwave single-scattering properties for nonspherical ice particles. Bull. Amer. Met. Soc. 2008; 111: 1563–1570.
- Lopez P . Implementation and validation of a new prognostics large-scale cloud and precipitation scheme for climate and data-assimilation purposes. Quart. J. Roy. Meteor. Soc. 2002; 128: 229–257.
- Mahfouf J.-F . Advances in model physics and their relevance to satellite data assimilation. Proceedings of the ECMWF Seminar of Satellite Data Assimilation. 2014. September 2014, Reading, UK, 14 pp.
- Martinet P. , Fourrié N. , Guidard V. , Rabier F. , Montmerle T. , co-authors . Towards the use of microphysical variables for the assimilation of cloud-affected infrared radiances. Quart. J. Roy. Meteor. Soc. 2013; 139: 1402–1416.
- Masson V. , Le Moigne P. , Martin E. , Faroux S. , Alias A. , co-authors . The SURFEX v7.2 land and ocean surface platform for coupled or offline simulations of Earth surface variables and fluxes. Geoscientific Model Dev. 2013; 6: 929–960.
- Mlawer E. J. , Taubman S. J. , Brown P. , Iacono M. J. , Clough S. A . Radiative transfer for inhomogeneous atmospheres: RRTM, a validated correlated-k model for the longwave. J. Geophys. Res. 1997; 102: 16663–16682.
- Montroty R. , Rabier F. , Westrelin S. , Faure G. , Viltard N . Impact of wind bogus and cloud- and rain-affected SSM/I data on tropical cyclones analysis and forecasts. Quart. J. Roy. Meteor. Soc. 2008; 134: 1673–1690.
- Olson W. S. , Kummerow C. D. , Heymsfield G. M. , Giglio L . A method for combined passive-active microwave retrievals of cloud and precipitation profiles. J. Appl. Meteor. 1996; 35: 1763–1789.
- Piriou J.-M. , Redelsperger J.-L. , Geleyn J.-F. , Lafore J.-P. , Guichard F . An approach for convective parameterization with memory: separating microphysics and transport in grid-scale equations. J. Atmos. Sci. 2007; 64: 4127–4139.
- Qiu S. , Pellegrino P. , Ferraro R. , Zhao L . The improved AMSU rain-rate algorithm and its evaluation for a cool season event in the western United States. Weather Forecast. 2005; 20: 761–774.
- Radnoti G. , Bauer P. , McNally A. , Cardinali C. , Healy S. , co-authors . ECMWF study on the impact of future developments of the space-based observing system on Numerical Weather Prediction. ECMWF Tech. Memo. No 638. 2010; 117. ECMWF, Reading, UK,.
- Roca R., Brogniez H., Chambon P., Chomette O., Cloché S., co-authors. The Megha-Tropiques mission: a review after three years in orbit. Front Earth Sci. 2015; 3: 17. DOI: http://dx.doi.org/10.3389/feart.2015.00017.
- Saunders R. W. , Matricardi M. , Brunel P . An improved fast radiative model for assimilation of satellite radiance observations. Quart. J. Roy. Meteor. Soc. 1999; 125: 1407–1425.
- Seity Y. , Brousseau P. , Malardel S. , Hello G. , Bénard P. , co-authors . The AROME-France convective-scale operational model. Mon. Wea. Rev. 2011; 139: 976–991.
- Smith E. , Bauer P. , Marzano F. S. , Kummerow C. D. , McKague D. , co-authors . Intercomparison of microwave radiative transfer models for precipitating clouds. IEEE Trans. Geosci. Remote Sens. 2002; 40: 541–549.
- Smith R. B . Scheme for predicting layer clouds and their water content in a general circulation model. Quart. J. Roy. Meteor. Soc. 1990; 116: 435–460.
- Spencer R. W. , Goodman H. M. , Hood R. E . Precipitation retrieval over land and ocean with the SSM/I: identification and characteristics of the scattering signal. J. Atmos. Ocean Tech. 1989; 6: 254–273.
- Staelin D. H. , Chen F. W . Precipitation observations near 54 and 183 GHz using the NOAA-15 satellite. IEEE Trans. Geos. Remote Sens. 2000; 38: 2322–2332.
- Wattrelot E. , Caumont O. , Mahfouf J.-F . Operational implementation of the 1D+3D-Var assimilation method for radar reflectivity in the AROME model. Mon. Wea. Rev. 2014; 142: 1852–1873.