
Abstract
A sharp temperature contrast, observed mostly in summer, between high temperatures over land and lower temperatures over the ocean and the typical summer synoptic scale configuration (high-pressure system over the ocean and thermal low inland) are responsible for the development of a coastal low-level jet (CLLJ). The low-level horizontal pressure gradient induces, through geostrophic adjustment, a strong alongshore flow, which is also influenced by local orography and the high-pressure subsidence over the maritime boundary layer. In this study, the EURO-CORDEX hindcast forced by ERA-Interim (1989–2009), the historic reference (1960–2006) and the future (2006–2100; RCP8.5) simulations, forced by EC-Earth global model, are used to determine the climate change signal on the CLLJ off the Iberian Peninsula's western coast. Although the boundary conditions of the hindcast and historic reference simulations have different resolutions, both have similar distributions and features of CLLJ. In the summer, a clear rise in the occurrence of CLLJ is expected throughout the 21st century, with the highest increase off the northwest coast of Iberia (~14%). The CLLJ prevailing height is confined between 300 and 400 m and the most frequent maximum wind speed is 15 m s−1 both in present and future climate; nevertheless, a shift to higher values is expected. The predominant wind direction at jet height is north–northeast in all simulations. The temporal evolution of CLLJ occurrence during the 21st century shows that there is no significant trend in spring and autumn, although some decadal variability is observed.
To access the supplementary material to this article, please see Supplementary files under ‘Article Tools’.
1. Introduction
Coastal low-level jets (CLLJ) play an important role in coastal weather and have significant impacts on regional climate. These jets are related to sharp land–sea temperature gradients, which give rise to strong coast parallel winds (Beardsley et al., Citation1987; Zemba and Friehe, Citation1987; Pomeroy and Parish, Citation2001). Most CLLJs are associated with the oceanic high-pressure systems and thermal low over land (Pomeroy and Parish, Citation2001; Rahn and Parish, Citation2007). The CLLJ is also influenced by the local orography, and its intensity and structure depend on the high-pressure subsidence over the maritime atmospheric boundary layer (MABL), which generates a sharp temperature inversion where the maximum wind of the CLLJs can be found (Beardsley et al., Citation1987; Tjernström and Grisogono, Citation2000). This inversion slopes onshore implying a horizontal temperature gradient over the MABL. Therefore, the CLLJ vertical wind structure results from the dual retardation due to the surface friction and the fast decrease in the local pressure gradient associated with the thermal wind above the MABL (Pomeroy and Parish, Citation2001). CLLJs are mainly located along cold eastern boundary marine currents, in upwelling regions offshore California, Peru-Chile, Benguela, Portugal, Canary and West Australia, and offshore Yemen–Oman (Winant et al., Citation1988; Ranjha et al., Citation2013, Citation2015). The alongshore flow enhances coastal upwelling through the strengthening of the offshore Ekman transport and Ekman pumping, bringing, thus, more deep cold water to the surface and lowering even more the sea surface temperature (Vallis, Citation2012). This, in turn, reinforces the across-shore temperature and the horizontal pressure gradient, leading to stronger winds. These feedback processes between the CLLJ and upwelling play a crucial role in the regional climate, namely, promoting aridity since the parallel flow prevents the intrusion of moisture inland (Nicholson, Citation2010), and increasing fish stocks through the transport of rich nutrient cold water from the bottom (Bakun, Citation1990). It should be mentioned that upwelling regions are one of the most productive oceanic ecosystems, where 17% of the world's fish captures occur (Pauly and Christensen, Citation1995). CLLJ occurrences are also relevant for aeronautic and maritime safety and wind energy. For the latter, it is vital to characterise, thoroughly and consistently, the spatiotemporal evolution of turbine hub height wind fields over coastal and offshore regions (Nunalee and Basu, Citation2013).
Soares et al. (Citation2014) described in a detailed manner the Iberian CLLJ for present climate, using a 20-yr WRF simulation at 9-km resolution. This study suggested that the Iberian CLLJ has a mean maximum wind speed around 15 m s−1, in heights between 300 and 400 m, and presents a strong seasonality. The hourly frequencies of occurrence are above 30% in summer, and <10% in the intermediate seasons. Importantly, these authors stress the large interannual variability of the frequency and of the spatial pattern of occurrence.
The strong intertwined ocean and atmospheric dynamics of coastal jets and their influence on the coastal ecosystems and economics highlight the need for a comprehensive study of the influence of a warming climate on these events. This is emphasised by the expected substantial climate change signal due to global warming in these regions (Snyder et al., Citation2003; Bakun et al., Citation2010; Miranda et al., Citation2013), with major losses of precipitation and increasing aridity, for example, in Iberia (Giorgi et al., Citation2009; Soares et al., Citation2015). Moreover, it is known that both the Azorean anticyclone and the Iberian thermal low will have their persistency and mean intensities increased in a future climate (Snyder et al., Citation2003; Miranda et al., Citation2013). In this context, it is expected that the occurrence and intensity of the Iberian CLLJ may augment significantly in a future warmed climate. In fact, the analysis of global climate model EC-Earth CMIP5 simulations show that the Iberian Peninsula's jet has the second highest projected increase in the frequency of occurrence, jet strength and height towards the end of the 21st century (Semedo et al., Citation2016).
In the present paper, the first regional climate change assessment study on the occurrence of the Iberian CLLJ is performed by using three simulations executed in the EURO-CORDEX framework. First, the near-surface winds from the hindcast, forced by ERA-Interim (1989–2009), are evaluated against an observational data set. Afterwards, the ability of the historic reference simulation (1971–2000) to represent the CLLJs spatio-temporal features is assessed by comparing its results to the hindcast's. Finally, the results from the future downscaling (2071–2100) are evaluated in relation to the historic reference and the evolution of the CLLJs features throughout the 21st century is also addressed.
2. Methods and data
The algorithm used by Ranjha et al. (Citation2013) and Soares et al. (Citation2014) is applied to three regional climate simulations (see below) to identify CLLJ in present climate and the climate change signal on its properties.
According to Ranjha et al. (Citation2013), a CLLJ occurs when the following criteria are met:
The jet maximum height is below the first kilometre.
The wind speed at jet maximum is at least 20% higher than the wind speed at the surface.
The wind speed above the jet maximum decreases to below 80% of the wind speed at the surface (i.e. a 20% fall off) in the first 5 km.
The jet maximum occurs within a temperature inversion, i.e.
The temperature at the jet maximum is lower than the temperature at two model levels above it (inversion detection).
The maximum temperature does not occur at the base (rejection of surface-based inversion).
These criteria were applied sequentially to wind-speed and temperature vertical profiles to detect the location and frequency of CLLJ.
2.1. Model
The version 3.5 of the WRF model (Skamarock et al., Citation2008) was set up according to the COordinated Regional climate Downscaling EXperiment (CORDEX; Giorgi et al., Citation2009), more particularly the EURO-CORDEX (Jacob et al., Citation2013) guidelines. WRF was developed as a research and forecasting model but is increasingly used as a regional climate model displaying state of the art skills for the description of regional climate, namely in Iberia (Soares et al., Citation2012; Cardoso et al., Citation2013; Rios-Entenza et al., Citation2014; Fraga et al., Citation2014; Martins et al., Citation2015). Three simulations were performed: a hindcast (1989–2009) forced by ERA-Interim (Dee et al., Citation2011), a historic reference (1960–2006) and future (2006–2100) simulations with lateral and lower boundary conditions produced by an EC-Earth v2.2 (Hazeleger et al., Citation2010) global run. In the future simulation, a high emissions scenario (RCP8.5; Riahi et al., Citation2011) is considered. WRF was set up using a 126×123 grid with a 0.44° resolution, covering the European continent () in agreement with EURO-CORDEX WRF common prescription. In this simulation, 40 vertical levels were used, with the model top fixed at 50 hPa, the first model level is set at approximately 30 m, 500 m is between levels 5 and 6 and 5.2 km is the 16th model level. WRF was integrated continuously for each of the experiments, with the lateral boundary conditions and SST, from ERA-Interim or EC-Earth, updated every 6 h. The WRF Single-Moment six-class microphysics scheme (WSM6, Hong and Lim, Citation2006) and Betts–Miller–Janjic (BMJ; Janjic, Citation2000) cumulus scheme were chosen to parameterise precipitation and the Rapid Radiative Transfer Model (Iacono et al., Citation2008) was used for radiation. The surface model and the boundary layer parameterisations were commonly selected amongst the EURO-CORDEX WRF community; these were the Noah Land Surface Model (NOAH; Chen et al., Citation1996), the Yonsei University scheme for the Planetary Boundary Layer (PBL) scheme (Hong et al., Citation2006; Hong and Lim, Citation2006) and MM5 similarity as the surface layer option. The hindcast results have been evaluated against regular gridded data sets over land, for different variables and purposes. Katragkou et al. (Citation2015) assessed the WRF hindcast EURO-CORDEX simulations, for temperature, precipitation, short- and long-wave downward radiation at the surface, and total cloud cover. The latter study showed that the hindcast simulation here explored has similar results to the other WRF simulations. However, to present knowledge there are not any evaluations of the 3-D WRF results either over land or ocean or, in particular, addressing its ability to describe the surface wind and temperature and wind vertical profiles. Hence, the similarity of model hindcast 3-D temperature and wind profiles was assessed against four radiosonde mandatory levels (925, 850, 700 and 500 hPa) from Lisbon and La Coruña soundings [available from Earth System Research Laboratory (ESRL) radiosonde database], and a comparison between model hindcast surface wind and buoys moored offshore of Galicia and Gibraltar belonging to Puertos del Estado is here performed. Since there are no buoys off the coast of Portugal, the Cross-Calibrated Multi-Platform (CCMP) Ocean Surface Wind Vector Analyses (Atlas et al., Citation2011) was also used to gauge WRF's ability to simulate surface wind. Since the detection algorithm requires 3-D information beyond the CORDEX standard archive specifications (surface, 850, 500 and 200 hPa), a multi-model ensemble could not be analysed.
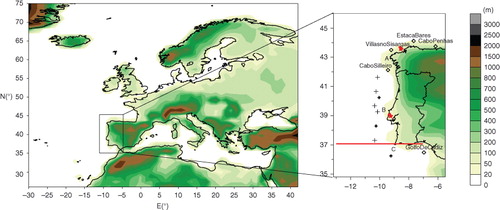
Fig. 1 WRF model domain (contours from the model domain overlaid by current coast line). Solid red line marks the area of the cross-section at 37.05°N (illustrated in ), pins mark the location of the radiosondes, lozenges pinpoint the ocean buoys and all crosses indicate the points used in and bold crosses locate where the maximum frequency of occurrence is observed (illustrated in ). (A) Cape Finisterra, (B) Cabo Carvoeiro and (C) Cabo São Vicente.
2.2. Observations
The CCMP Ocean Surface Wind Vector Analyses (Atlas et al., Citation2011; www.podaac.jpl.nasa.gov/datasetlist?ids=Measurement:GridSpatialResolution&values=OceanWinds:0.25/; accessed 26 February 2014) is a 6-hourly 0.25° gridded analysis of ocean surface winds. These winds are obtained through variational analysis (VAM) of cross-calibrated satellite winds. The VAM uses ECMWF reanalysis (ERA-40 for 1987–1998 winds) or analysis (from 1999 onwards) as a first guess and combines it with the satellite data and in situ measurements. The radiometer and scatterometer data were compared against ocean moored buoys revealing a good agreement with in-situ observations (within 0.8 m s−1) regardless of the different instrument measurement dynamics wind retrieval procedures. The buoy data were provided by the Spanish Public Agency of Marine Affairs, Puertos del Estado (www.puertos.es/en-us/oceanografia/Pages/portus.aspx), which deployed several buoys around the coast of Spain and the soundings were obtained from the ESRL soundings database (www.esrl.noaa.gov/raobs/General_Information.html). The soundings from Lisbon and La Coruña are the ones nearest to Iberia's west coast.
3. Present climate
To assess the quality of the historical simulations for the description of the CLLJs, firstly, a comparison of the hindcast surface wind-speed with the CCMP Ocean Surface Wind data set and the ocean buoys is performed, as well as an assessment of the vertical temperature and wind profiles against the soundings from Lisbon and La Coruña; and, secondly, the CLLJ properties of the historical run are evaluated against the hindcast.
3.1. Model evaluation
For each data set, the bias, mean absolute error (MAE), mean absolute percentage error (MAPE), root mean square error (RMSE) and correlation coefficient were computed by linking the nearest grid point of the hindcast grid to the buoys, radiosondes and the CCMP Ocean Surface Wind grid point. For details on how the statistics were performed, see Cardoso et al. (Citation2013).
In the radiometer and scatterometer database, the pixels near the shore are affected by backscatter from land which contaminate the measurements and according to Tang et al. (Citation2004) they should not be viewed as absolute. Nevertheless, these grid points were not removed from this evaluation and thus, the errors decrease from the shoreline to the open ocean (not shown). The left side of each cell in shows the global error statistics calculated for the domain highlighted in . Both wind speed components have similar correlations, RMSE and absolute errors, but due to the lower intensity of the meridional component, the latter's MAPE is higher. The high RMSE for both wind speeds emphasises the occurrence of high deviations from observations and since the bias and percentual bias (not shown) are very low, these errors cancel each other. The wind speed errors are lower than the ones for the individual components. The agreement between the simulated surface wind speeds and the observations demonstrates the ability of WRF to reproduce reasonably the surface flow off the coast of the Iberian Peninsula.
Table 1. Global error statistics of surface wind
The right side of each cell in shows the global error statistics for the five buoys, in the area of interest, marked with lozenges in . The frequency of the available data is not uniform between buoys and within each buoy's operational period with long intervals of missing data. Thus, the wind speeds and components were aggregated into daily time series for days in which 75% of the data were available. Between 1989 and 2009, only 60–70% of the data were available per buoy, but none was discarded in the validation. For each time step and buoy, the height of the ocean waves was added to the height of the anemometer (3 m) and the model 10-m wind speeds were interpolated to this level assuming a log wind profile. In general, the results are similar to the ones from the CCMP Ocean Surface Wind database, but slightly higher values are found, in particular, the bias presents the larger discrepancies.
displays global error statistics for each sounding. The Lisbon sounding is only available at 1200 UTC and for 51% of the days, while La Coruña is provided at 0000 UTC and 1200 UTC for 47% and 61% of days, respectively; nevertheless, no sounding was disregarded. The bulk vertical bias errors are small, possibly due to some compensation through the vertical profiles. MAE, MAPE and RMSE reveal some differences, larger for wind speed than for temperature, but show that considering the full profiles is still reasonable. This agreement reveals the ability of WRF to reproduce realistically the vertical temperature and wind profiles.
Table 2. Global statistics of vertical wind and temperature profiles
3.2. Coastal low-level jet climatology
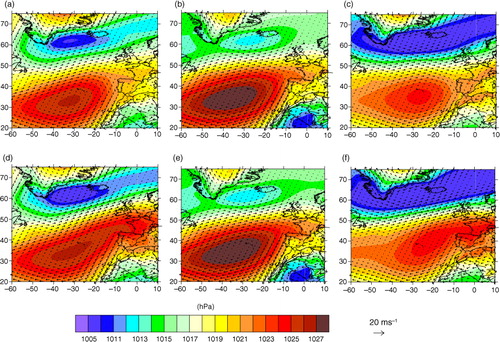
The CLLJ detection algorithm was applied to the hourly output of the ERA-Interim downscaling and the number of hours of CLLJ identified, in each grid point, was seasonally aggregated. During winter, there are a very small number of CLLJs detections, associated with easterly winds, that are strong enough to generate a near-neutral PBL, through boundary-layer mixing, which is thick enough to pass the surface inversion criterion in the algorithm (see a discussion on such flows in Ranjha et al., Citation2013). In spite of its interest, the winter season will not be addressed since the frequency of occurrence is <2%. To illustrate the seasonal synoptic configuration over the North Atlantic associated with the presence of Iberian CLLJs, shows the ERA-Interim (1989–2009) mean sea-level pressure (MSLP) for spring (MAM), summer (JJA) and autumn (SON) for the entire seasons (a–c) and for days when CLLJ are detected offshore Iberia (d–f). In all panels, the east flank of the Azorean high influences western Iberia, where northerly winds along the coast are present. When CLLJ are observed, the Azorean high is stronger and the high pressure extends to northern France inducing a higher pressure gradient and stronger northerly flow in the western Iberian coast. The differences in the summer circulation patterns are relatively smaller, when compared to the intermediate seasons. On average, the synoptic surface flow is northerly and northwesterly, whereas it is north–northeasterly when CLLJs occur, due to the anticyclone ridge over north Iberia.
Fig. 2 North Atlantic, ERA-Interim synoptic configurations for (a) MAM, (b) JJA and (c) SON and for days when CCLJ are detected offshore of Iberia (d) MAM, (e) JJA and (f) SON. Mean sea-level pressure in contours and wind in vectors.
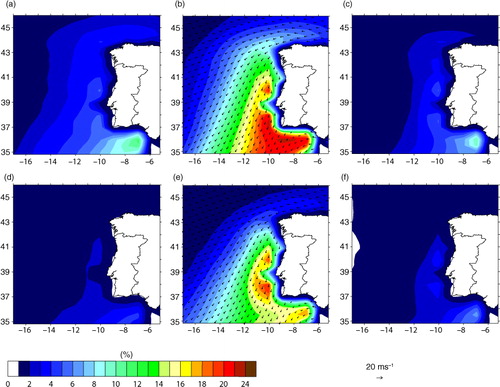
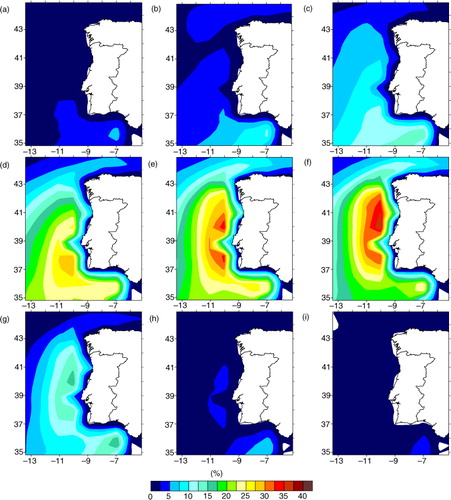
The percentage of seasonal hourly incidence of CLLJ is presented in . In the intermediate seasons (spring and autumn), the ERA-Interim downscaling shows CLLJs in the western coast of the Iberian Peninsula with a low frequency of occurrence; lower than 6%. In spring, the jets have a considerable offshore extension to the west and are also detected along the north coast of Iberia. These features are less pronounced in autumn. In summer, there is a considerable increase in frequency and off-shore extension; CLLJ are generally present along the southwest and south coast of Portugal ~22% of the time (at least one every 5 d; 7 d per month). This value is lower in the centre of Portugal and decreases along the west and north coast of Galicia. The mean wind direction at the jet maximum, when CLLJ occur, can also be seen in b. A well-defined and consistent north–northeasterly wind is the main feature along the west coast of Iberia. The CLLJ in the north coast of the Peninsula is an easterly wind parallel to the coast, contouring the Peninsula along the coast of Galicia towards the western coast. These frequencies of occurrence are smaller than the ones in Soares et al. (Citation2014), which showed summer incidences over 30%. The location of the maxima of occurrence in Soares et al. (Citation2014) is intrinsically linked to the most prominent capes in the Portuguese coast and to the northern coastal topography, and in this simulation the maxima are also related to the largest irregularities of the coast, as in Ranjha et al. (Citation2013). These differences might be due to the downscaling resolution. According to Song et al. (Citation2009), reductions in resolution dampen kinetic energy, especially in phenomena with scales shorter than the effective resolution of ~6Δx (~300 km for a grid spacing of 50 km); thus, the thermal circulations and the interaction of the flow with local orographic features and the slope of the marine boundary layer are coarsely represented here. Nevertheless, the results still illustrate the prominence of the CLLJ offshore of Iberia. In the historic reference run, the frequency is slightly lower, but the spatial distribution is similar. In spring and autumn, the western and northern extensions are missing, which, apart from the differences in the atmospheric forcing, could also be related to the SST resolution. A higher resolution (ERA-Interim has a 0.75° resolution while EC-Earth has a 1.125° resolution) is usually accompanied by a better representation of surface forcings, topographic or SST gradients over the ocean which, according to Song et al. (Citation2009), can be responsible for a small-scale energy increase in the low-level wind fields. Thus, SST resolution is a critical parameter in the representation of coupling surface wind speed and SST perturbations, especially in the western boundaries of the major ocean basins where high pressure and thermal gradients occur.
Fig. 3 Maps of seasonal hourly CLLJ frequency of occurrence (%) for ERA-Interim downscaling (a) MAM, (b) JJA and (c) SON, and for historic reference (d) MAM, (e) JJA and (f) SON.

The Levanter winds (easterly winds) off the Strait of Gibraltar are a form of gap flow mostly due to a mesoscale surface low near Tangier, which induces ageostrophic flow across the strait. The higher wind speeds downstream of the narrows is explained by a stratified flow passing over a 3-D barrier where the lower level flow is blocked by the topography and funnelled through the strait. The flow above it is partially blocked and transposes the topography inducing adiabatic heating. Thus, a temperature inversion emerges on the western side of the strait accompanied by a wind jet, sharing similar vertical profiles to the CLLJ (Dorman et al., Citation1995). Although persistent in all seasons in the ERA Interim downscaling, they will not be considered here due to the different genesis.
The jet height and wind speed histograms, for ERA-Interim and historic reference simulations, are shown in a and b. The distributions of both downscalings are very similar, depicting shallow jets which in 99% of the cases remain below 600 m and with almost half of the cases (~45%) occurring between 270 and 420 m. The wind speed at the jet core occurs mostly (>80%) within 10–20 m s−1, with more than 6% with wind speeds higher than 20 m s−1. While both distributions are very similar, the ERA-Interim is slightly skewed to lower values whilst the historic reference is skewed towards higher wind speeds. The 2-D histograms, wind speed versus height, indicate that the most frequent jets have a wind speed maximum between 300 and 400 m and the latter is within 12–18 m s−1. As expected, due to the thermal wind effect, the wind veers with height (c and g or d and h), with the wind speed at jet maximum being primarily from north–northeast (38% in ERA-Interim and 41% in historic reference). The predominant bearing of the surface wind, when a jet is observed aloft, is north (>35% of events), followed by north–northeast. The differences between the ERA-Interim and the historic reference simulations are rather small. Although the horizontal and vertical resolutions of the underlying ERA Interim simulation are coarser than the 9 km ERA-Interim driven simulation from Soares et al. (Citation2014), these results are in close agreement. To assess the influence of the resolution in the CLLJ properties, we recomputed the ERA-Interim CLLJ distributions at 0.7° and the analysis of the summer frequency differences in the jet height and of the wind speed maximum between the 9 km resolution, the 0.44° and ERA-Interim is performed and is shown in Supplementary Figs. S1 and S2. All the distributions were calculated for the same box (−13° < longitude < − 7.7°E and 35° < latitude < 44°N) as in Soares et al. (Citation2014).
Fig. 4 CLLJ statistics of ERA-Interim and historic reference for summer (JJA): (a) jet height histogram (%), (b) jet wind speed histogram (%), (c and d) jet wind rose, (e and f) jet height-wind histogram (%) and (g and h) surface wind speed when jet occurs.
The analysis of the intermediate seasons performed is shown in Supplementary Fig. S3.
4. Future climate
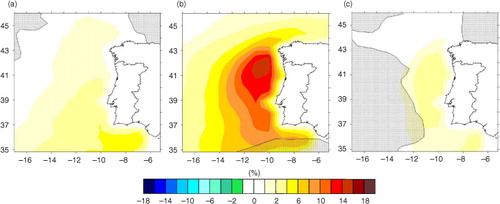
The seasonal MSLP anomalies (future minus present) are depicted in . In the future, the location of the centre of the Azores high is expected to remain unchanged in the three seasons analysed here. Nevertheless, in spring, its dimensions are broader, hence the positive anomalies in the western and eastern Atlantic, but there does not seem to be a change in the pressure gradient off the coast of the Iberian Peninsula. The northward shift of the predominant North Atlantic storm track has become a consensual consequence of climate change (Bengtsson et al., Citation2006; Ulbrich et al., Citation2008; Harvey et al., Citation2014) and is expected to lead to a reduction of the wind speed in its former location. Corroborating such configuration is the decrease in wind speed across the North Atlantic and off the western coast of the Iberian Peninsula (d). Thus, the projected impact of climate change on the Iberian coastal jet in spring is a mere increase of ~2% in the frequency of occurrence (a). In autumn, the pressure changes are more relevant over the British Isles and similar reasoning applies, hence an increase in ~2% is expected (c). In the summer, the northward expansion of the Hadley cell (Kang and Lu, Citation2012) and of the Azorean high imply a significant positive pressure anomaly over the British Isles, and the strengthening of the Iberian thermal low. This not only enhances the pressure gradient across the western coast, but the north–south increased pressure gradient leads to the strengthening of the flow around Cape Finisterre (e). Consequently, the stronger northerly wind amplifies the upwelling events, lowering the sea-surface temperature and strengthening the across-shore temperature gradient. Similar results have been suggested by Bakun (Citation1990), Schwing and Mendelssohn (Citation1997), Snyder et al. (Citation2003) and Miranda et al. (Citation2013), where an increase in upwelling due to global warming is attributed to an intensification of the inland thermal low. Not surprisingly, the northwestern coast projections of CLLJ point to a projected growth of 14% of occurrences (b); whereas, along the remaining coast an increase of only 10% is expected. This augment represents more than doubling the jet occurrence in the northwest of Iberia, and a relative increase above 60% in the south. Also noteworthy is the projected expansion of the offshore extension to the west. All of the results are statistically significant.
Fig. 5 Anomalies (2071–2100 minus 1971–2000) of the synoptic configurations associated with the occurrence of low-level jets. Mean sea-level pressure anomalies for (a) MAM, (b) JJA and (c) SON season and anomalies of surface wind speed for (d) MAM, (e) JJA and (f) SON season. Shaded areas specify changes not statistically significant using a Student's t-test at the 75% confidence level.
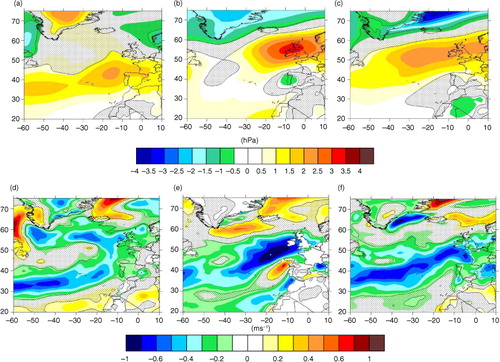
Fig. 6 Maps of anomalies (future – historic reference) of seasonal hourly CLLJ frequency of occurrence (%) (2071–2100 minus 1971–2000), (a) MAM, (b) JJA and (c) SON. Shaded areas specify changes not statistically significant using a Student's t-test at the 90% confidence level.
Future CLLJ are most likely to be more intense and occur at a higher altitude; wherefore the height and wind speed histograms are shifted to higher values in relation to the historic reference (a and b). A Kolmogorov–Smirnov statistical significance test was performed on both distributions and the results show that the differences are statistically significant. Although an increase in the frequency of the higher altitude jets (heights above 400 m) is projected, the prevailing height is still confined between 300 and 400 m (d) and the most frequent maximum wind speed is 15 m s−1 (~24%). The prevailing wind direction at jet maximum is, as in the historic reference run, north–northeast. There is, though, a shift towards north, with an increase of northerly and north–northeasterly jets occurrences and a reduction of the northeast ones (c). Analogous behaviour occurs at the surface, with a reduction in north–northeast jets and an increase in the north–northwest ones (f). e illustrates the future summer mean wind speed and potential temperature cross-section through the region where CLLJ has a maximum summer incidence (marked in red in ). The jet core, with mean wind speeds of the order 14 m s−1, is located below 400 m; approximately 90 km off the coast and extends for a few hundred kilometres offshore. Also visible is the sea breeze front, which crosses Portugal, and is an essential element in the formation of the Iberian thermal low. The low coastal topography at this latitude allows the inland intrusion of this zonal flow, which is not destroyed by the predominant and stronger meridional component. The interannual variability for the period 2071–2100 is illustrated in the monthly mean of frequency of occurrence from March to November (). The monthly mean percentage of occurrences of CCLJ and the corresponding spatial extension increases from south to north and from March to August. From August onwards, the number of CCLJ decreases and by November no jet are observed. The majority of the spring jets develop in May and similarly the greatest contribution to the jet statistics in autumn is observed in September, that is, the months adjacent to JJA. In June, the highest frequency (~28% of the days) occurs off the Portuguese southwest coast. In July, two maximums (~33%) evolve in the southwest and north of Cabo Carvoeiro and by August, the northern section is where the highest frequency is observed (>35%). By August, the number of jets in the southern coast starts to decrease and the pattern in September is very similar to August, but the frequencies are significantly smaller.
Fig. 7 Future CLLJ statistics (RCP8.5) for summer (JJA): (a) jet height histogram (%), (b) jet wind speed histogram (%), (c) jet wind rose, (d) jet height-wind histogram (%), (e) east–west cross section (illustrated in ) at 37.05°N, colours for mean wind speed (m s−1) and isentropes (K) and (f) surface wind speed when jet occurs.
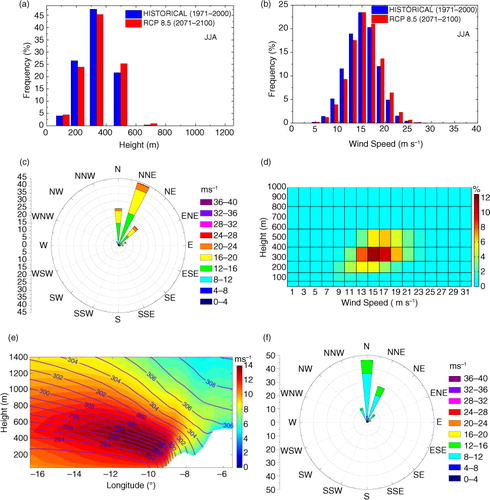
Fig. 8 Maps of monthly mean frequency of future CLLJ occurrence (%) for (a) March, (b) April, (c) May, (d) June, (e) July, (f) August, (g) September, (h) October and (i) November.
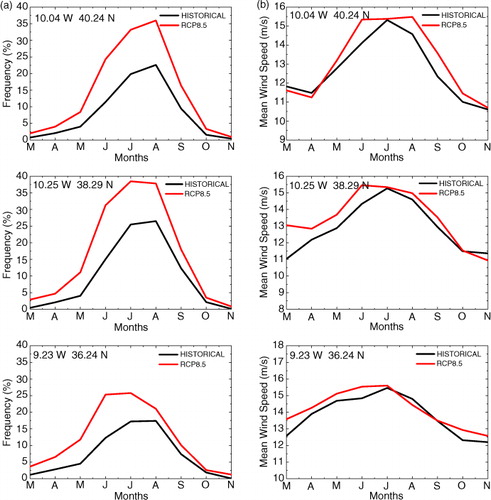
To illustrate the climate change impact on the aggregate monthly evolution of the CLLJ mean wind speed and frequency of occurrence, three points with the highest frequencies of occurrence in July for present climate (bold crosses in ) were chosen (). For present and future climate, the evolution of the monthly mean frequencies is similar in the three points, where an increase in CLLJ events until August is followed by a decrease in the following months (a). Although the months of March, April, October and November have a very low number of occurrences in the historic reference and future scenarios, the latter are double than the former. More significant is the doubling which also occurs in June. In July and August, changes are more moderate, but nevertheless, in the western coast of Portugal there is an increase in frequency of more than 10% in absolute value. The jets mean intensity (b) does not change significantly from the period 1971–2000 to 2071–2100. The highest wind speeds increase slightly and are recorded in the months with higher frequencies, with maxima wind speed slightly above 15 m s−1.
Fig. 9 Present (historic reference) and future (RCP8.5) climate (a) mean monthly frequency of occurrence (%) and (b) mean monthly wind speed (m s−1), from March to November, both for three different geographical locations, for the 30 yr.
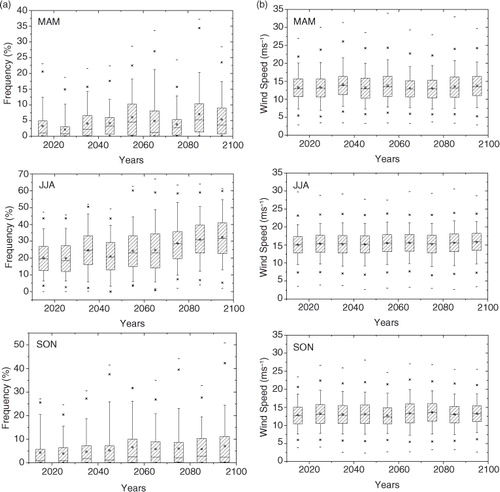
To evaluate the evolution of both parameters along the 21st century, the decadal tendency for the three seasons was determined through box plots for frequency of occurrence and wind speed (). Each box plot contains 30 yr of data from the eight points shown in , centred in a decade and overlap their neighbouring box plots by 10 yr. During spring and autumn, the frequency of occurrence displays high variability, both inter and intradecades, but without a clear tendency during the 21st century. In between years, there are several grid points in which no jet is observed, thus the minimum and the lowest quartiles are zero and the distributions are heavily positively skewed. Spring has a higher variability than autumn and although there are areas where CLLJ occur more than 10% of the days (~9 d), these are very limited. In the intermediate seasons, there is not a very strong change along the century, whereas in summer a clear increase can be perceived. Both the mean and the median of the CLLJ occurrences reveal a positive tendency, from 20% in the beginning of the century to 30% in the end. The interquartile range is rather constant, oscillating between 14% and 20%. When compared with the intermediate seasons, summer distributions are more symmetrical with similar median and average. The wind speed distributions (b) are comparable for all three seasons, with 5 m s−1 as interquartile range, almost Gaussian and with no change across decades. The differences between seasons stem from the stronger jets in summer which shift the median from ~13 m s−1 in spring and autumn to ~15 m s−1 in summer.
Fig. 10 Decadal tendency in the 21st century of (a) jet frequency of occurrence and (b) jet wind speed. Individual boxes span from the 25th to the 75th percentile, with the median represented by a straight line and the average by a floating square. The 99th and 1st percentiles are denoted by crosses, with the maximum and minimum indicated by a dash.
5. Conclusions
The EURO-CORDEX hindcast (1989–2009), historic reference (1960–2006) and future RCP8.5 (2006–2100) scenarios were used to determine the climate change signal on the CLLJ off the Iberian Peninsula's western coast. The CLLJ's occurrence was determined by following the detection algorithm proposed by Ranjha et al. (2013). An assessment of the hindcast's surface wind speed against remote sensing observations provided the necessary confidence in WRF model's ability to realistically reproduce the wind offshore of the Iberian Peninsula.
The CLLJs develop not only in summer but also during spring and autumn. For the hindcast, the maximum occurrence is ~22% in summer that drops to <6% during spring and autumn. The EC-Earth's lower resolution entails a weaker representation of the SST gradients and surface forcings. Accordingly, the maximum incidence is ~20% in the summer and <4% in spring and autumn. Nevertheless, the spatial distribution is similar in both simulations. The distributions of the wind speed and height (at jet core) histograms are very similar. As in Soares et al. (Citation2014), the CLLJ are shallow jets where 99% of the cases remain below 600 m and with almost half (~45%) occurring between 270 and 420 m. As well, the wind speed at the jet core occurs mostly (>80%) within 10–20 m s−1, with more than 6% with wind speeds >20 m s−1, and is mostly from north–northeast (~40%).
The summer climate change signal in this area is represented by a projected strengthening of the pressure gradient in the west and north coast. Thus, a 10–14% absolute increase in the jet frequency is expected and also a broadening to the west. This augment represents more than doubling the jet occurrence in the northwest of Iberia, and a relative increase above 60% in the south. The future jets are most likely expected to be more intense and occur at a higher altitude; wherefore the height and wind speed histograms are shifted to higher values in relation to the historic reference. Nevertheless, the prevailing height is still confined between 300 and 400 m, and the most frequent maximum wind speed is 15 m s−1 (~24%).
The box plots with the frequency decadal tendency throughout the 21st century show a steady increase in the summer's frequency of occurrence, while in spring and autumn no clear tendency is expected. In the summer, both the mean and the median of the CLLJ occurrences reveal a positive tendency, from 20% in the beginning of the 21st century to 30% in the end. While, in summer, the distributions are almost Gaussian, in the intermediate seasons they are positively skewed. The wind speed distributions are comparable for all three seasons, almost Gaussian and with no change across decades. The differences between seasons stem from the stronger jets in summer, which shift the median from ~13 m s−1 in spring and autumn to ~15 m s−1 in summer.
In the future, the extension of this study for an ensemble of RCMs would allow an increase in the confidence of the results achieved and uncertainty could be characterised. Nevertheless, as mentioned earlier, this study needs 3-D data, which are beyond the archive specifications of CORDEX and many teams do not keep these records.
6. Acknowledgements
The authors wish to acknowledge the projects SOLAR (PTDC/GEOMET/7078/2014), SHARE (RECI/GEO-MET/0380/2012) and EUPORIAS (7th Framework Programme for Research, Grant Agreement 308291) and the EarthSystems Doctoral Programm of the Faculty of Sciences of the University of Lisbon (grant PD/BD/106008/2014) without which this work wouldn't be possible. Publication supported by project FCT UID/GEO/50019/2013 – Instituto Dom Luiz.
Notes
To access the supplementary material to this article, please see Supplementary files under ‘Article Tools’.
Related Research Data
References
- Atlas R., Hoffman R. N., Ardizzone J., Leidner S. M., Jusem J. C., co-authors. A cross-calibrated, multiplatform ocean surface wind velocity product for meteorological and oceanographic applications. Bull. Am. Meteor. Soc. 2011; 92: 157–174. DOI: http://dx.doi.org/10.1175/2010BAMS2946.1.
- Bakun A . Global climate change and intensification of coastal ocean upwelling. Science. 1990; 247: 198–201.
- Bakun A., Field D. B., Redondo-Rodriguez A., Weeks S. J. Greenhouse gas, upwelling-favorable winds, and the future of coastal ocean upwelling ecosystems. Global Change Biol. 2010; 16: 1213–1228. DOI: http://dx.doi.org/10.1111/j.1365-2486.2009.02094.x.
- Beardsley R. C., Rosenfeld L. K., Dorman C. E., Friehe C. A., Winant C. D. Local atmospheric forcing during the coastal ocean dynamics experiment 1. A description of the marine boundary layer and atmospheric conditions over a northern California upwelling region. J. Geophys. Res. 1987; 92: 1467–1488. DOI: http://dx.doi.org/10.1029/JC092iC02p01467.
- Bengtsson L. , Hodges K. I. , Roeckner E . Storm tracks and climate change. J. Clim. 2006; 19: 3518–3543.
- Cardoso R. M., Soares P. M. M., Miranda P. M. A., Belo-Pereira M. WRF high resolution simulation of Iberian mean and extreme precipitation climate. Int. J. Climatol. 2013; 33: 2591–2608. DOI: http://dx.doi.org/10.1002/joc.3616.
- Chen F. , Mitchell K. , Schaake J. , Xue Y. , Pan H. , co-authors . Modeling of land-surface evaporation by four schemes and comparison with FIFE observations. J. Geophys. Res. 1996; 101: 7251–7268.
- Dee D. P., Uppala S. M., Simmons A. J., Berrisford P., Poli P., co-authors. The ERA-Interim reanalysis: configuration and performance of the data assimilation system. Q. J. Roy. Meteorol. Soc. 2011; 137: 553–597. DOI: http://dx.doi.org/10.1002/qj.828.
- Dorman C. E. , Beardsley R. C. , Limeburner R . Winds in the Strait of Gibraltar. Q. J. Roy. Meteorol. Soc. 1995; 121: 1903–1921.
- Fraga H., Malheiro A. C., Moutinho-Pereira J., Cardoso R. M., Soares P. M. M., co-authors. Integrated analysis of climate, soil, topography and vegetative growth in Iberian viticultural regions. PLOS ONE. 2014; 9: e108078. DOI: http://dx.doi.org/10.1371/journal.pone.0108078.
- Giorgi F. , Jones C. , Asrar G . Addressing climate information needs at the regional level: the CORDEX framework. WMO Bull. 2009; 58(3): 175–183.
- Harvey B. J., Shaffrey L. C., Woollings T. J. Equator-to-pole temperature differences and the extra-tropical storm track responses of the CMIP5 climate models. Clim. Dyn. 2014; 43: 1171–1182. DOI: http://dx.doi.org/10.1007/s00382-013-1883-9.
- Hazeleger W., Severijns C., Semmler T., Ştefãnescu S., Yang S., co-authors. EC-Earth: a seamless earth system prediction approach in action. Bull. Am. Meteor. Soc. 2010; 91: 1357–1363. DOI: http://dx.doi.org/10.1175/2010BAMS2877.1.
- Hong S. Y. , Lim J. O. J . The WRF single-moment 6-class microphysics scheme (WSM6). J. Korean Meteor. Soc. 2006; 42: 129–151.
- Hong S. Y. , Noh Y. , Dudhia J . A new vertical diffusion package with an explicit treatment of entrainment processes. Mon. Weather Rev. 2006; 134: 2318–2341.
- Iacono M. J., Delamere J. S., Mlawer E. J., Shephard M. W., Clough S. A., co-authors. Radiative forcing by long-lived greenhouse gases: calculations with the AER radiative transfer models. J. Geophys. Res. 2008; 113: D13103. DOI: http://dx.doi.org/10.1029/2008JD009944.
- Jacob D., Petersen J., Eggert B., Alias A., Christensen O. B., co-authors. EURO-CORDEX: new high-resolution climate change projections for European impact research. Reg. Environ. Change. 2013; 14: 563–578. DOI: http://dx.doi.org/10.1007/s10113-013-0499-2.
- Janjic Z. I . Comments on “development and evaluation of a convection scheme for use in climate models”. J. Atmos. Sci. 2000; 57: 3686.
- Kang S. M., Lu J. Expansion of the Hadley cell under global warming: winter versus summer. J. Clim. 2012; 25: 8387–8393. DOI: http://dx.doi.org/10.1175/JCLI-D-12-00323.1.
- Katragkou E., García-Díez M., Vautard R., Sobolowski S., Zanis P., co-authors. Hindcast regional climate simulations within EURO-CORDEX: evaluation of a WRF multi-physics ensemble. Geosci. Model Dev. 2015; 8: 603–618. DOI: http://dx.doi.org/10.5194/gmd-8-603-2015.
- Martins J. P. A., Cardoso R. M., Soares P. M. M., Trigo I., Belo-Pereira M., co-authors. The summer diurnal cycle of coastal cloudiness over west Iberia using Meteosat/SEVIRI and a WRF regional climate model simulation. Int. J. Climatol. 2015. DOI: http://dx.doi.org/10.1002/joc.4457.
- Miranda P. M. A., Alves J. M. R., Serra N. Climate change and upwelling: response of Iberian upwelling to atmospheric forcing in a regional climate scenario. Clim. Dyn. 2013; 40: 2813–2824. DOI: http://dx.doi.org/10.1007/s00382-012-1442-9.
- Nicholson S. E . A low-level jet along the Benguela coast, an integral part of the Benguela current ecosystem. Clim. Change. 2010; 99: 613–624.
- Nunalee C. G., Basu S. Mesoscale modeling of coastal low-level jets: implications for offshore wind resource estimation. Wind Energy. 2013; 17: 1199–1216. DOI: http://dx.doi.org/10.1002/we.1628.
- Pauly D. , Christensen V . Primary production required to sustain global fisheries. Nature. 1995; 374: 255–257.
- Pomeroy K. R. , Parish T. R . A case study of the interaction of the summertime coastal jet with the California topography. Mon. Weather Rev. 2001; 129: 530–539.
- Rahn D. A. , Parish T. R . Diagnosis of the forcing and structure of the coastal jet near Cape Mendocino using in situ observations and numerical simulations. J. Appl. Meteorol. Climatol. 2007; 46: 1455–1468.
- Ranjha R., Svensson G., Tjernström M., Semedo A. Global distribution and seasonal variability of coastal low-level jets derived from ERA-Interim reanalysis. Tellus A. 2013; 65: 20412. DOI: http://dx.doi.org/10.3402/tellusa.v65i0.20412.
- Ranjha R., Tjernström M., Semedo A., Svensson G., Cardoso R. M. Structure and variability of the Oman coastal low-level jet. Tellus A. 2015; 67: 25285. DOI: http://dx.doi.org/10.3402/tellusa.v67.25285.
- Riahi K., Rao S., Krey V., Cho C., Chirkov V., co-authors. RCP 8.5 – a scenario of comparatively high greenhouse gas emissions. Clim. Change. 2011; 109: 33–57. DOI: http://dx.doi.org/10.1007/s10584-011-0149-y.
- Rios-Entenza A., Soares P. M. M., Trigo R. M., Cardoso R. M., Miguez-Macho G. Moisture recycling in the Iberian Peninsula from a regional climate simulation: spatiotemporal analysis and impact on the precipitation regime. J. Geophys. Res. 2014; 119: 5895–5912. DOI: http://dx.doi.org/10.1002/2013JD021274.
- Schwing F. B., Mendelssohn R. Increased coastal upwelling in the California current system. J. Geophys. Res. 1997; 102: 3421–3438. DOI: http://dx.doi.org/10.1029/96JC03591.
- Semedo A., Soares P. M. M., Lima D. C. A., Cardoso R. M., Bernardino M., co-authors. The impact of climate change on the global low-level wind jets: EC-EARTH simulations. Global Planet. Change. 2016; 137: 88–106. DOI: http://dx.doi.org/10.1016/j.gloplacha.2015.12.012.
- Skamarock W. C., Klemp J. B., Dudhia J., Gill D. O., Barker D. M., co-authors. A Description of the Advanced Research WRF Version 3. DOI: http://dx.doi.org/10.1007/s00382-014-2432-x.
- Snyder M. A., Sloan L. C., Diffenbaugh N. S., Bell J. L. Future climate change and upwelling in the California current. Geophys. Res. Lett. 2003; 30: 1823. DOI: http://dx.doi.org/10.1029/2003GL017647.
- Soares P. M. M., Cardoso R. M., Ferreira J. J., Miranda P. M. A. Climate change and the Portuguese precipitation: ENSEMBLES regional climate models results. Clim. Dyn. 2015; 45: 1771–1787. DOI: http://dx.doi.org/10.1007/s00382-014-2432-x.
- Soares P. M. M., Cardoso R. M., Miranda P. M. A., Medeiros J., De Belo-Pereira M., co-authors. WRF high resolution dynamical downscaling of ERA-Interim for Portugal. Clim. Dyn. 2012; 39: 2497–2522. DOI: http://dx.doi.org/10.1007/s00382-012-1315-2.
- Soares P. M. M., Cardoso R. M., Semedo A., Chinita M. J., Ranjha R. Climatology of the Iberia coastal low-level wind jet: weather research forecasting model high-resolution results. Tellus A. 2014; 66: 22377. DOI: http://dx.doi.org/10.3402/tellusa.v66.22377.
- Song Q. , Chelton D. B. , Esbensen S. K. , Thum N. , O'Neill L. W . Coupling between sea surface temperature and low-level winds in mesoscale numerical models. J. Clim. 2009; 22: 146–164.
- Tang W. Q. , Liu W. T. , Stiles B. W . Evaluations of high resolution ocean surface vector winds measured by QuikSCAT scatterometer in coastal regions, IEEE Trans. Geosci. Rem. Sens. 2004; 42: 1762–1769.
- Tjernström M. , Grisogono B . Simulations of supercritical flow around points and capes in a coastal atmosphere. J. Atmos. Sci. 2000; 57: 108–135.
- Ulbrich U. , Pinto J. , Kupfer H. , Leckebusch G. , Spangehl T. , co-authors . Changing northern hemisphere storm tracks in an ensemble of IPCC climate change simulations. J. Clim. 2008; 21: 1669–1679.
- Vallis G. K . Climate and the Oceans. 2012; Princeton University Press, Princeton, NJ. 244.
- Winant C. D. , Dorman C. E. , Friehe C. A. , Beardsley R. C . The marine layer off northern California: an example of supercritical channel flow. J. Atmos. Sci. 1988; 45: 3588–3605.
- Zemba J. , Friehe C. A . The marine boundary layer jet in the coastal ocean dynamics experiment. J. Geophys. Res. 1987; 92: 1489–1496.