
Abstract
Heavy precipitation affected Central Europe in May/June 2013, triggering damaging floods both on the Danube and the Elbe rivers. Based on a modelling approach with COSMO-CLM, moisture fluxes, backward trajectories, cyclone tracks and precipitation fields are evaluated for the relevant time period 30 May–2 June 2013. We identify potential moisture sources and quantify their contribution to the flood event focusing on the Danube basin through sensitivity experiments: Control simulations are performed with undisturbed ERA-Interim boundary conditions, while multiple sensitivity experiments are driven with modified evaporation characteristics over selected marine and land areas. Two relevant cyclones are identified both in reanalysis and in our simulations, which moved counter-clockwise in a retrograde path from Southeastern Europe over Eastern Europe towards the northern slopes of the Alps. The control simulations represent the synoptic evolution of the event reasonably well. The evolution of the precipitation event in the control simulations shows some differences in terms of its spatial and temporal characteristics compared to observations. The main precipitation event can be separated into two phases concerning the moisture sources. Our modelling results provide evidence that the two main sources contributing to the event were the continental evapotranspiration (moisture recycling; both phases) and the North Atlantic Ocean (first phase only). The Mediterranean Sea played only a minor role as a moisture source. This study confirms the importance of continental moisture recycling for heavy precipitation events over Central Europe during the summer half year.
1. Introduction
Major river floods are one of the main natural hazards affecting Central Europe. Most severe flood events occur during the summer half year and often affect multiple river catchments. For example, the flood in July 1997 affected the Oder and the Vistula basins (Ulbrich et al., Citation2003b). In July 2001, a flood on the Vistula was induced by two precipitation events (Ulbrich et al., Citation2003b; Cyberski et al., Citation2006). In August 2002, a severe flood occurred in Central Europe, which affected both the Danube and the Elbe (Ulbrich et al., Citation2003a; Stohl and James, Citation2004). This event is generally considered the most expensive natural hazard in Germany (Schröter et al., Citation2015). In May 2010, heavy precipitation over Eastern Europe led to floods in Poland, Czech Republic, and Slovakia (Winschall et al., Citation2014b).
An exceptional flood occurred in late May/early June 2013, and affected two major rivers in Central Europe, the Danube and the Elbe, leading to high destruction and disruption in several countries. Peak discharges were associated with a return period on the order of 100 yr in several sub-catchments (Blöschl et al., Citation2013). Three major dike bursts at the Danube and at the Elbe were reported, causing large direct and indirect damages. The highest inundation levels in the Danube River were 12.24, 7.92 and 8.89 m, respectively, at Passau, Korneuburg (upstream to Vienna) and Budapest. The water level of the Elbe at Dresden (8.78 m; BfG, Citation2013) almost reached the 2002 record level (9.4 m; Ulbrich et al., Citation2003a). The precipitation event triggering the flood was connected to the passage of two related surface depressions associated with a quasi-stationary upper level cut-off low. These cyclones moved counter-clockwise around the Alpine ridge and brought large amounts of moisture towards the northern slopes of the Alps.
The Mediterranean Sea and the North Atlantic have been recognized as the primary sources of moisture for flood events around the Western Mediterranean and particularly over the Southern Alpine range (e.g. Rudari et al., Citation2005; Winschall et al., Citation2012; Pinto et al., Citation2013). For floods over Central Europe, the Mediterranean Sea is also often considered to be the main moisture source, as for example Vb cyclones and associated moist air masses move from the Mediterranean around the Alps (e.g. Ulbrich et al., Citation2003b). However, moisture source diagnostics have revealed other source regions. Evapotranspiration over continental land masses was an important moisture source for the 2002 and 2010 floods, together with the Mediterranean Sea and the North Atlantic Ocean (Stohl and James, Citation2004; Sodemann et al., Citation2009; Winshall et al., Citation2014b). This suggests that precipitation recycling over land can be an important moisture source for Central European flood events. This is in line with a study by Sodemann and Zubler (Citation2010), who provided evidence that on longer time scales the moisture source regions for Alpine precipitation are (in order) the North Atlantic Ocean, the Mediterranean Sea, the European land surface and the North and Baltic Seas. Moreover, the contribution of the different moisture sources to precipitation over Europe strongly depends on the season (Gimeno et al., Citation2010; Sodemann and Zubler, Citation2010; Winschall et al., Citation2014a). During winter, the moisture is mainly coming from the North Atlantic region and from the Mediterranean Sea (Gimeno et al., Citation2010; Winschall et al., Citation2014a). During summer, the flow over the Alpine region is primarily influenced by local air masses, and thus, the role of local continental evaporation increases. However, all the four main contributors listed above have an approximately equal role as a moisture source for the Alpine precipitation during the summer half year (Sodemann and Zubler, Citation2010). Still, the variability of moisture sources is quite high between individual events (Winschall et al., Citation2014a).
The synoptic situation that led to the flood in 2013 was analysed by Grams et al. (Citation2014) using high-resolution operational analyses of the European Centre for Medium-Range Weather Forecasts (ECMWF). Their moisture diagnostics showed that the main moisture source for the 2013 heavy precipitation event was evapotranspiration over land along the tracks of the flood-producing cyclones.
In our study, we investigate the moisture sources of the 2013 summer Central European flood using a modelling approach with the regional climate model (RCM) Consortium for Small-Scale Modeling-Climate Limited-area Model (COSMO-CLM). The modelling of the flood event enables the evaluation of the synoptic situation in detail and allows the identification and quantification of moisture sources by performing sensitivity studies. The analysis of the event based on sensitivity studies is a complementary approach to the Lagrangian moisture diagnostics used in a previous study (Grams et al., Citation2014). Our sensitivity studies aim to establish connection between the potential source regions and the resulting precipitation event.
The structure of this article is as follows: Section 2 introduces the used data sets. The RCM and its simulations together with the applied analysis tools are discussed in Section 3. In Section 4, a brief synoptic description of the investigated flood event is given. The results of the CCLM control simulations and sensitivity studies are described in Sections 5 and 6. A detailed analysis of the main source regions is given in Section 7, and finally, the conclusions are presented in Section 8.
2. Data
In this study, the ERA-Interim reanalysis data set (Dee et al., Citation2011) and the observational data set E-OBS (Haylock et al., Citation2008) are used for evaluation purposes, and to analyse the synoptic situation and the moisture sources, which led to the exceptional flood event in 2013 (see Sections 4 and 5). ERA-Interim is also used to provide initial and boundary conditions for the RCM simulations (see Section 3.2). ERA-Interim is a global atmospheric reanalysis data set of ECMWF. Its spectral resolution is T255, which corresponds to a horizontal resolution of approximately 80 km. Data products include 3-hourly surface parameters and 6-hourly upper-air parameters on a regular 0.75×0.75° grid.
The version 10.0 of the observational data set E-OBS, based on ECA&D (European Climate Assessment & Dataset) is used to evaluate the performance of the RCM in simulating realistic precipitation fields. E-OBS provides gridded daily values of different surface parameters on various spatial resolutions from 1950 to present. The E-OBS data set has been designed to provide reliable grid box averages, so that they are well suitable for comparisons with RCM outputs. To generate a data set for Europe, point measurements from a dense network of stations have been interpolated on various grids using a three-step process of interpolation (Haylock et al., Citation2008). In this study, we use daily sums of precipitation on a regular 0.25×0.25° grid.
3. Methods
3.1. Model description
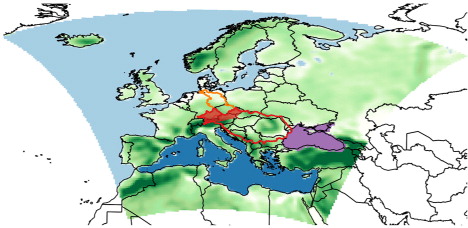
Simulations with an RCM are performed in order to analyse the flood event in detail. RCM simulations also allow to conduct sensitivity experiments, for example, with altered boundary and/or initial conditions, and thus to analyse their impacts on the results. The model applied in this study is the non-hydrostatic COSMO model (Consortium for Small-Scale Modeling; www.cosmo-model.org) in its climate version 4.8, subversion 17 (CLM), henceforth termed CCLM (Rockel et al., Citation2008). The physical parameterizations, including convection (Tiedtke, Citation1989), cloud microphysics (Doms et al., Citation2011), the shortwave and long-wave radiation (Ritter and Geleyn, Citation1992) and the dynamical core are similar for the numerical weather prediction (NWP) and for the climate model. The CCLM, in contrast to the NWP version, does not consider data assimilation of observational data nor latent-heat nudging of radar data. The successful application of CCLM for different real-case studies is documented in, for example, Born et al. (Citation2012), Hermans et al. (Citation2012) and Ludwig et al. (Citation2014). The CCLM simulations are performed on a 0.375°×0.375° rotated grid with 32 vertical layers covering the whole of Europe (see domain on ). Initial and boundary conditions are provided by 6-hourly ERA-Interim data.
Fig. 1 Model domain, river catchments and regions where surface fluxes are switched off for the sensitivity experiments. Green: land areas (LANDOFF) with orography; dark blue: Mediterranean Sea (MEDOFF); purple: Black Sea (BLSEAOFF); light blue: North Atlantic Ocean (NAOFF). Red contour: Danube catchment; red shaded: Upper Danube catchment; orange contour: Elbe catchment.
3.2. Experiment setup
We used several model setups and sensitivity experiments to investigate the 2013 summer flood event. The sensitivity experiments are designed to analyse the role of different potential moisture source areas contributing to the accumulated heavy precipitation causing the flood.
First, different CCLM setups are tested in various control simulations to find which run captures the event best in terms of the spatial rainfall distribution. Spectral nudging, a technique where the model is forced to keep the large-scale flow conditions close to the driving field inside the domain (von Storch et al., Citation2000), is applied to the upper level wind components down to 850 hPa in the majority of the simulations. The effect of different initial dates is analysed by choosing three starting dates (20, 23 and 26 May, which is 10, 7 and 4 d prior the first precipitation peak in E-OBS, respectively). The large lead time between the event and the initialization in case of the 20 and 23 May simulations is chosen to enable enough spin-up time, which is of particular importance for the evaluation of moisture sources (Winschall et al., Citation2014a). Four control simulations are examined: three including spectral nudging with initial dates at 20, 23 and 26 May 2013, respectively, and one without spectral nudging starting on 26 May.
The sensitivity experiments are designed to evaluate the role of surface evaporation over different parts of the domain during the evolution of the event. To quantify the contribution of the potential moisture sources, the atmosphere and the surface are disconnected for a selected region by decreasing the surface fluxes to zero. This affects the surface latent and sensible heat fluxes and consequently also the surface evaporation. This approach allows excluding potential surface moisture sources from the atmospheric processes. In our case, we assume that the modified latent heat flux is the dominant factor compared to the sensible heat flux. The lack of surface fluxes is a caveat and may have some influence on the development of the event and/or on the moisture source contributions. To minimize this effect and to compensate the possible modification of the large-scale circulation, the spectral nudging technique is used to keep the upper air flow close to the reanalysis. The assumed moisture sources considered in this study are the Mediterranean Sea, the Black Sea, the North Atlantic Ocean and evaporation over land surfaces (see ). For each of these areas, a sensitivity experiment with switched off surface fluxes over that area is performed. In order to analyse the effect of land evapotranspiration in detail, an additional experiment with decreased surface fluxes by 50 % was performed. The starting date for all sensitivity experiments is 23 May 2013.
An overview of both the control simulations and the sensitivity experiments is given in . The results of the control simulations and the sensitivity experiments are described in detail in Sections 5 and 6, respectively.
Table 1. Summary of the analysed CCLM simulations
3.3. Analysis tools
Vertically integrated moisture flux, backward trajectories and cyclone tracks are computed from reanalysis data and compared to the results of the model simulations.
Vertically integrated moisture flux is used to evaluate the moisture transport and moisture flux convergence areas. The horizontal convergence of low-level vertically integrated moisture flux is related to upward motion and thus serves as a precursor for cloud water and consequently precipitation formation. The vertically integrated moisture flux, Q, can be calculated as (see Peixoto and Oort, Citation1992):where q is the specific humidity, v denotes the horizontal wind vector, p is the pressure and g is the gravitational acceleration. In our study, we integrate the moisture fluxes from surface (p
b
) up to 700 hPa (p
t
).
Identifying moisture sources with moisture flux streamlines is a Eulerian approach, which may be misleading in some cases, since the wind and moisture flux fields are not stationary over time. Thus, this analysis is complemented with Lagrangian backward trajectories. Three-dimensional trajectories are calculated with an algorithm that solves a finite integral with a fourth-order Runge–Kutta scheme to trace back an air parcel from a specified location (Law, Citation1993; Noone and Simmonds, Citation1999). The trajectories reconstruct the backward path of an air parcel in space and time, based on the three-dimensional wind vectors. Assuming minor humidity exchange with the surrounding (e.g. mixing, condensation and evaporation), it is also possible to trace water vapour along a trajectory. The specific humidity along a trajectory can be used as a proxy for the path of humidity transport.
Finally, cyclone centres are identified and tracked as local minima in the mean sea level pressure field and consecutively connected in time by a nearest neighbour approach. The method is described in more detail in Kelemen et al. (Citation2015).
4. Synoptic evaluation
Heavy precipitation fell primarily between 30 May and 2 June 2013. Weather conditions over Central Europe were already wet and cold during the two previous weeks, with above average precipitation (Grams et al., Citation2014). Thus, the soils became moist and potentially saturated, which led to increased surface run-off during the heavy precipitation event (Schröter et al., Citation2015).
The heavy precipitation event itself was associated with an upper-level trough that developed over Western Europe at the end of May 2013. A cut-off low formed as the trough moved eastward. Cold air from the north was advected over the western parts of Europe, while warm and moist air from the south flowed along the eastern flank of the cut-off low towards Eastern Europe. The warm and moist air masses were advected counter-clockwise around the cut-off low and reached the northern slopes of the Alps.
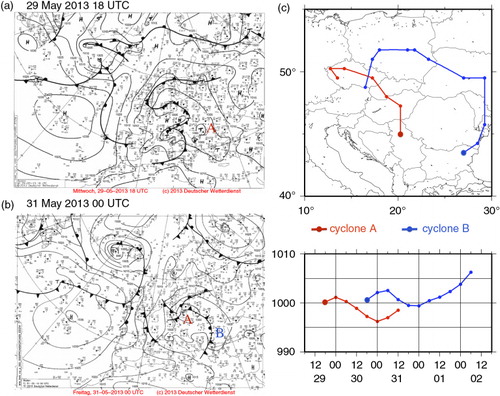
To analyse the cyclones associated with the cut-off low and the flood event, surface analyses charts from the German Weather Service (Deutscher Wetterdienst, DWD, a and b) and cyclone tracks obtained from ERA-Interim mean sea level pressure data (c) are considered. On 29 May, a low formed over the Balkans, hereafter called cyclone A (cf. ‘A’ in a and track in c), which is the first of the two cyclones related to the flood event. Cyclone A moved northward from the Balkans, turned counter-clockwise to the west around the Alps along the northern flank of the cut-off low (not shown) and spiralled back to the northern slopes of the Alps (c). The track of cyclone A suggests that moist air from the Mediterranean region was advected towards the northern slopes of the Alps. The upper level trough moved slowly eastward during the lifetime of cyclone A. Along the eastern flank of the cut-off low, which coincides with the cold front of cyclone A, a new surface low developed on the evening of 30 May near the northern coast of the Black Sea (cyclone B; cf. ‘B’ in b and track in c). Cyclone B also moved counter-clockwise around the cut-off low and followed a similar track like cyclone A, but slightly easterly shifted (c), also bringing very moist air to the northern slopes of the Alps (not shown). On 2 June, cyclone B occluded and the cut-off low was filled up. In the following days, an anticyclone extended towards Central Europe from the west, leading to sunny weather for several days, while the flood waves were propagating downstream on the Elbe and Danube rivers. Our cyclone tracks are similar to those discussed in Grams et al. (Citation2014), who additionally discuss the role of a third cyclone prior to the event. The effect of this third cyclone to the event is indirectly analysed in our study through the sensitivity experiments.
Fig. 2 Surface analyses from the German Weather Service (Deutsche Wetterdienst DWD, left) and cyclone tracks identified in ERA-Interim (right). (a) Surface analysis of DWD at 29 May 2013 18 UTC, and (b) at 31 May 2013 00 UTC. (c) Tracks and core pressure evolution of cyclone A and B.
The precipitation associated with both cyclones A and B fell mainly in a 4-d period between 30 May 2013 and 2 June 2013 in the Alpine region and around the Ore Mountains (). Two rainfall peaks can be distinguished in the upper Danube and the Elbe catchments: the first on 30 May and the second on 1 June (a). On 30 May, precipitation was observed over large parts of the whole Danube catchment. Between 31 May and 2 June 2013, the moist air hit the northern slopes of the west-to-east oriented mountain ranges (Alps and Ore Mountains) and caused very intense precipitation in the upper Danube and the Elbe catchment.
Fig. 3 Spatiotemporal distribution of the precipitation in E-OBS. (a) Time series of spatial mean daily precipitation totals [mm/day] in the Danube, the upper Danube and the Elbe catchment. (b) Four-day (30.05.2013–02.06.2013) accumulated precipitation [mm].
![Fig. 3 Spatiotemporal distribution of the precipitation in E-OBS. (a) Time series of spatial mean daily precipitation totals [mm/day] in the Danube, the upper Danube and the Elbe catchment. (b) Four-day (30.05.2013–02.06.2013) accumulated precipitation [mm].](/cms/asset/7a299b38-6074-4716-a231-43d4fd390ccf/zela_a_11827517_f0003_ob.jpg)
5. Control simulations
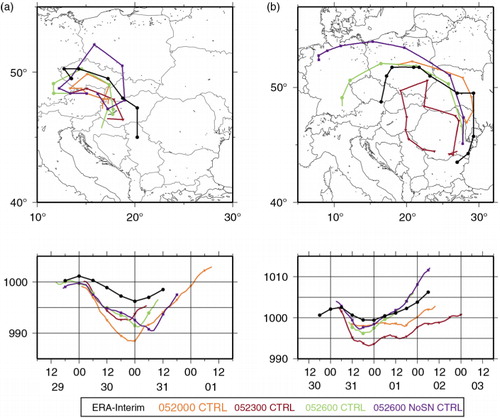
The representation of the tracks of cyclones A and B in the CCLM control simulations (see ) is compared to ERA-Interim tracks (). The track positions in the control simulations exhibit slightly different locations and have a generally deeper core pressure than in the ERA-Interim reanalysis. This can be due to the higher resolution of CCLM, as well as due to the different dynamical development of the cyclone in the model. In the control simulations, the tracks of cyclone A generally start further north–west compared to ERA-Interim, but all end up on the northern side of the Alps (a). Cyclone B is also present in all control simulations, but the spread of the tracks is larger, and cyclolysis occurs in different areas (b).
Fig. 4 Cyclone tracks and core pressure evolution in ERA-Interim reanalysis and in the CCLM control simulations; (a) cyclone A, (b) cyclone B.
The different cyclonic developments in the control simulations lead to altered precipitation patterns. These are analysed with respect to their spatial distribution and temporal evolution. The total accumulated precipitation sums of the CCLM control simulations are shown in for the period 30 May to 2 June 2013, which is the same time period shown for E-OBS in b. While the Alpine precipitation peak is represented in all simulations, the peak near the Ore Mountains is underestimated. This is probably associated with a relatively flat orography due to the relatively coarse resolution of the CCLM, leading to potentially reduced orographic lifting. Other precipitation patterns, like the clear northwest-to-southeast gradient over Germany (cf. b for E-OBS), are reproduced best by the 052300 CTRL simulation (b). To further judge the performance of the control simulations, time series of simulated daily accumulated precipitation in the Danube and in the Elbe catchments is compared to E-OBS. As the event was most intense in the upper Danube catchment (), focus is given to this region. The correlation and the root mean square error (RMSE) values of the CCLM simulations against E-OBS are shown in . While the 052600 CTRL simulation performs better for the Elbe catchment, the 052300 CTRL simulation performs best for the Danube and particularly for the upper Danube catchment. Hence, this control simulation is chosen to investigate the event in more detail. 23 May is also used as the starting date for the sensitivity experiments (see Section 6).
Fig. 5 Spatial distribution of 4-d (30.05.2013–02.06.2013) accumulated precipitation [mm] in the CCLM control simulations.
![Fig. 5 Spatial distribution of 4-d (30.05.2013–02.06.2013) accumulated precipitation [mm] in the CCLM control simulations.](/cms/asset/e238405c-124a-4dcd-a8d5-d4c6620e63e1/zela_a_11827517_f0005_ob.jpg)
Table 2. The correlation and RMSE of daily total precipitation per river basin in the CCLM control simulations compared to E-OBS
In the following, the atmospheric circulation and the potential moisture source regions are investigated based on the 052300 CTRL simulation. First, we analyse moisture fluxes () and Lagrangian backward trajectories ( and ; see Section 3.3). In the first phase of the strong precipitation event, the moisture streamlines show cyclonal circulation associated with cyclone A, centred over the Alpine region (a). The areas with strongest convergence correspond to its occlusion point and cold front over eastern Germany and Poland (a, e1 and e2). The streamlines indicate that the cyclone incorporates air masses arriving from Eastern Europe, the Mediterranean Sea, Western Europe, the North Atlantic Ocean and the Baltic Sea. The streamlines on 2 June (b) show the circulation associated with cyclone B, corresponding to the second phase of the event. The cyclone centre is located at the eastern part of the Carpathian Basin, with a strong moisture convergence in the Alpine region (b, e3). The moisture flux streamlines, associated with the strong moisture convergence, indicate air flow from Eastern European land areas and also from the Baltic Sea. There is also a strong convergence zone over Eastern Europe (b, e4), which corresponds to the cold front of cyclone B. The related streamlines suggest that moisture can potentially arrive also from the Black Sea.
Fig. 6 Streamlines of vertically integrated (from surface up to 700 hPa) moisture flux (arrows) and moisture flux divergence (convergence: divQ<0) [mm s−1] (blue shading) in the 052300 CTRL simulation at (a) 31.05.2013 04UTC and (b) 02.06.2013 00UTC. Red ellipses in (a) and (b) denote moisture flux convergence zones (e1,e2,e3,e4).
![Fig. 6 Streamlines of vertically integrated (from surface up to 700 hPa) moisture flux (arrows) and moisture flux divergence (convergence: divQ<0) [mm s−1] (blue shading) in the 052300 CTRL simulation at (a) 31.05.2013 04UTC and (b) 02.06.2013 00UTC. Red ellipses in (a) and (b) denote moisture flux convergence zones (e1,e2,e3,e4).](/cms/asset/97f3ebc0-e3c4-4d89-ae46-d5d72648e9ab/zela_a_11827517_f0006_ob.jpg)
Fig. 7 Four-day backward trajectories starting from 31.05.2013 04UTC in the 052300 CTRL simulation (clustered based on spatial origin and humidity amount, see text for details). The lower two diagrams show the vertical level and specific humidity values of the cluster means, respectively. The box whisker plot shows the minimum, maximum, 25th and 75th percentile values of the clusters. The clusters are: North Atlantic, upper levels, dry (blue); North Atlantic, low levels (magenta); Mediterranean (green); Continental (orange).
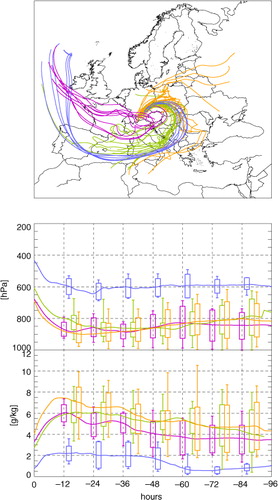
Fig. 8 Same as , but the starting date is 02.06.2013 00UTC and the clusters are: Mediterranean (orange); Continental, very moist, near surface (blue); Continental, less moist, higher (green).
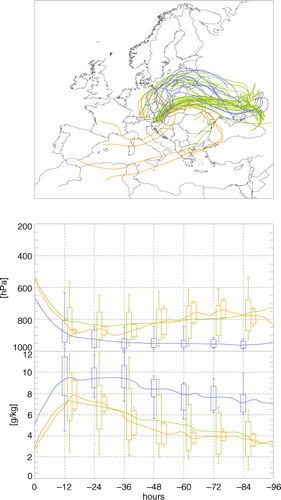
Backward trajectory analysis is started on 31 May () and on 2 June () from grid points in the upper Danube catchment, where the moisture flux exhibits its strongest convergence (cf. a and b). From seven starting levels (900, 800, 700, 600, 500, 400 and 300 hPa), a total of 280 air parcels are traced back. Their backward trajectories are calculated for 4-d, since the main moisture uptake of heavy precipitation events mainly occur 2 or 3 d before the event (Winschall et al., Citation2014a). Here, only trajectories fulfilling upward lifting and decrease of specific humidity for the last 6 h are plotted, since this is an indication for precipitable air masses. The backward trajectories started during the first phase of the event show the different origins of the air masses involved in cyclone A (). The trajectories are grouped into four clusters based on their origin and moisture content: dry upper-level air masses from the North Atlantic region (close to 600 hPa) turning counter-clockwise around the Alps (blue trajectories on ), moist low-level air masses from the North Atlantic region (magenta), moist low-level air masses from the Mediterranean (green) and moist low-level air masses from continental areas (orange). As the latter three air masses are relatively humid, they are probably transporting moisture towards the heavy precipitation area and thus contributing to the first precipitation peak. For the second precipitation peak, the trajectories starting on 2 June 2013 00 UTC are grouped into three clusters (): very moist near surface air masses from the Eastern European continental regions (blue trajectories in ) and two less moist air masses originating from the continental region (green) and from the Mediterranean (orange), respectively.
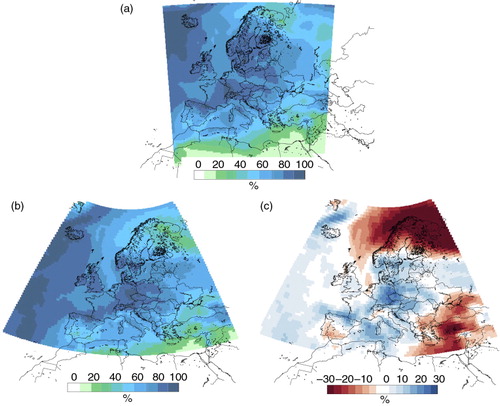
The CCLM simulated near surface relative humidity (at 925 hPa) prior and during the event (27 May 2013–2 June 2013) reveals high values over Central Europe (a). This pattern in CCLM is in good agreement with ERA-Interim (b). High relative humidity may lead to precipitation, as it enhances the probability of condensation and thus cloud development if air masses are uplifted. On the other hand, precipitation can also increase relative humidity in the boundary layer due to the evaporation of rain drops. The anomaly of humidity for this period compared to the climatological mean for May between 1979 and 2013 is shown in c. Positive anomalies of the relative humidity of up to +30 % are found for Central and Eastern Europe, the Gulf of Lyon, the Bay of Biscay and the Baltic Sea.
Fig. 9 Mean relative humidity at 925 hPa prior and during the event (27.05.2013–02.06.2013) (a) in 052300 CTRL simulation (b) in ERA-Interim. (c) The difference of (b) from ERA-Interim climatological (1979–2013) mean relative humidity in May.
The qualitative analysis of the moisture fluxes and backward trajectories shows that the event can be split into two phases concerning the atmospheric circulation and the precipitation: For the first peak, dominated by cyclone A, the main moisture sources are the Eastern European land area, the Mediterranean Sea and the North Atlantic. For the second peak, driven by cyclone B, the main moisture source is the Eastern European land area. Besides the continental region, the Baltic Sea, the Black Sea and the Mediterranean Sea might also contribute as moisture sources. The relatively low relative humidity values over the Black Sea suggest that the influence of this area is probably of minor relevance. However, it is included in our investigation as a possible moisture source, because cyclone B has its genesis near the coast of the Black Sea and the moisture convergence shows its possible role. A more detailed analysis of the potential moisture sources is performed based on different sensitivity experiments described in the next section.
6. Sensitivity experiments
The sensitivity experiments are performed to emphasize the influence of the different moisture sources in the context of the event by switching off the surface fluxes over a selected area. The analysis focuses on the moisture transport towards the upper catchment of the Danube River.
The mid-tropospheric circulation during the event (cf. mean 500 hPa geopotential for 30.05.2013–02.06.2013, a) is very similar in the different sensitivity studies (see , hereafter referred as MEDOFF, BLSEAOFF, NAOFF and LANDOFF), the control run (052300 CTRL) and ERA-Interim, particularly in terms of the location of the cut-off low. The 4-d mean (30.05.2013–02.06.2013) equivalent potential temperature field at 850 hPa, which is used to distinguish the different air masses, differs only slightly between the sensitivity studies, the control run and ERA-Interim (b). The tracks of the two cyclones causing the intense precipitation are shown in c and d. Their general characteristics are similar to ERA-Interim and to each other, but the modifications of the boundary conditions in the sensitivity experiments (switching off the surface fluxes) have some impact on the cyclone tracks. In ERA-Interim, cyclone A evolved over the Balkans and dissipates in the Alpine region (c). The simulated cyclone A tracks start further west compared to the ERA-Interim track (except for the NAOFF simulation, which genesis area is very close to the ERA-Interim track). Nevertheless, all simulated cyclones have a similar track and end up approximately in the same region, on the northern side of the Alps. Cyclone B evolved in ERA-Interim along the east coast of the Black Sea on the evening of 30 May and transported moisture into the heavy precipitation region mainly on 2 June (d black line). The CCLM simulations generally capture the cyclone B track, but the different tracks show more variability than for cyclone A (d). While in ERA-Interim cyclone B reaches the northern slopes of the Alps, the simulated cyclones turn southward earlier, passing east of the Alps (d). In all CCLM simulations, both cyclones A and B show generally a deeper minimum core pressure than in ERA-Interim, which may be partially due to the higher resolution of CCLM. Among the simulated tracks, the largest deviations to the control run are found for the LANDOFF experiment, in particular, for cyclone A. These differences can be partially attributed to the changed latent heat fluxes. However, the mid- and low-tropospheric dynamics as well as the tracks of the surface cyclones differ only slightly in the sensitivity simulations from those in the control simulation. We conclude that the general atmospheric circulation is not substantially altered when modifying the surface fluxes in the sensitivity experiments. Thus, these experiments can be considered suitable to quantify the contributions of the different moisture sources to the event.
Fig. 10 Spaghetti diagram of mean (a) 500 hPa geopotential levels [555 and 565 gpdm] (b) 850 hPa equivalent potential temperature levels [300 and 310 K] between 30.05.2013 and 02.06.2013. Cyclone tracks for (c) cyclone A and (d) cyclone B in the CCLM sensitivity and control (052300 CTRL) simulations and ERA-Interim.
![Fig. 10 Spaghetti diagram of mean (a) 500 hPa geopotential levels [555 and 565 gpdm] (b) 850 hPa equivalent potential temperature levels [300 and 310 K] between 30.05.2013 and 02.06.2013. Cyclone tracks for (c) cyclone A and (d) cyclone B in the CCLM sensitivity and control (052300 CTRL) simulations and ERA-Interim.](/cms/asset/8cf507fd-c428-4839-a8dc-a7663c3f73b5/zela_a_11827517_f0010_ob.jpg)
Backward trajectories are calculated to compare the control simulation to ERA-Interim and to investigate the altered moisture transport in the different sensitivity experiments (). For all simulations, the same number (280) of backward trajectories is started from exactly the same location (to enable comparability). The trajectories are started on 2 June 00 UTC from seven different levels and from grid points that exhibit strong moisture convergence in the upper Danube catchment in the control simulation (b, e3). Here, we focus on trajectories starting at the second phase of the event (cyclone B) that is previously shown to be influenced primarily by the continental moisture source. The moist (blue) trajectories in the control simulation (b) originate mainly from the continental regions and follow a path in a north–northeast direction. Due to a rather low humidity, it is reasonable that trajectories from the Mediterranean and the North Atlantic have only small contribution to the precipitation of cyclone B and thus to the second peak of the event. The trajectories in the MEDOFF and the BLSEAOFF simulations do not differ considerably from the CTRL trajectories (e and f). The most noticeable drying of the moist trajectories from Eastern Europe is revealed for the LANDOFF simulation (c), and dominant changes are also visible in the NAOFF simulation (d). When considering the mean specific humidity along the trajectories, a shift towards dryer trajectories is present in all sensitivity experiments.
Fig. 11 Four-day backward trajectories starting from 02.06.2013 00 UTC in (a) ERA-Interim (b) 052300 CTRL, and (c–f) in the sensitivity simulations (MEDOFF, LANDOFF, NAOFF, BLSEAOFF). Colours denote the specific humidity along the trajectories [g/kg].
![Fig. 11 Four-day backward trajectories starting from 02.06.2013 00 UTC in (a) ERA-Interim (b) 052300 CTRL, and (c–f) in the sensitivity simulations (MEDOFF, LANDOFF, NAOFF, BLSEAOFF). Colours denote the specific humidity along the trajectories [g/kg].](/cms/asset/d9a1f808-de6a-49e4-b04a-c96eb7532d7c/zela_a_11827517_f0011_ob.jpg)
Differences of the 4-d (30 May–02 June 2013) total precipitation between the sensitivity experiments and the control experiment are shown in . There is evidence that the LANDOFF simulation has the largest impact on the accumulated precipitation field. Precipitation is reduced not only over the target region (Danube catchment), but over almost the whole continental area (a). This reveals the importance of moisture recycling over land during this event. The MEDOFF and NAOFF simulations show decreased total precipitation in the upper Danube catchment and a westward shift of precipitation towards the Rhine catchment (b and c). The decrease of precipitation in the Danube catchment and the increase of precipitation over Germany are larger in NAOFF than in MEDOFF. The increase of precipitation over Germany in NAOFF is connected to the slightly larger extension of the trough compared to the control simulation (not shown). The BLSEAOFF precipitation field exhibits positive and negative affected areas, but differences to 052300 CTRL are rather small and compensate each other (d and f). Thus, the modification of the evaporation over the Black Sea has only small effects on the precipitations amount in the Danube catchment.
Fig. 12 (a–d) Four-day (30.05.2013–02.06.2013) accumulated precipitation differences [mm] between the sensitivity simulations and the control simulation (053200 CTRL). (e) Same as (a–d) but for additional LANDOFF 50 % sensitivity experiment. (f) Four-day (30.05.2013–02.06.2013) accumulated precipitation mean in the Danube basin in the control and in the sensitivity simulations.
![Fig. 12 (a–d) Four-day (30.05.2013–02.06.2013) accumulated precipitation differences [mm] between the sensitivity simulations and the control simulation (053200 CTRL). (e) Same as (a–d) but for additional LANDOFF 50 % sensitivity experiment. (f) Four-day (30.05.2013–02.06.2013) accumulated precipitation mean in the Danube basin in the control and in the sensitivity simulations.](/cms/asset/573ae51c-8a68-46cf-807c-b641da7a2723/zela_a_11827517_f0012_ob.jpg)
A quantitative analysis of the area-wide simulated precipitation for the entire Danube basin shows that switching off the evaporation over land (LANDOFF simulation) has the highest impact on the precipitation event compared to the control simulation (f). The 4-d (30 May 2013–2 June 2013) precipitation sum over the Danube catchment declines by more than 50 %, when the land evapotranspiration is switched off. Reduced rainfall amounts are also found for NAOFF and MEDOFF (27 and 15 %, respectively; f), but decreases are distinctly weaker than in LANDOFF. Only negligible changes are found for BLSEAOFF (2 % increase; f). Considering only the upper part of the Danube catchment, the total precipitation decreases by 22 % in both the LANDOFF and the NAOFF simulations (not shown). In the MEDOFF and in the BLSEAOFF simulations, the negative and positive values balance each other, and only small changes are found in the total field mean values (1–2 % increase; not shown).
7. Detailed analysis of main source regions
The sensitivity studies reveal that the precipitation during the flood event is primarily affected by the evaporation over continental Eastern Europe and the North Atlantic Ocean. In terms of the continental evapotranspiration, the interpretation of the results is rather straightforward, since the air masses associated with the precipitation passed over this land area. The cyclones triggering the flood event gather moisture along their track over the evaporating land areas. By eliminating this moisture source, the precipitation decreases considerably. In the LANDOFF simulation, the decrease of the evaporation over land is massive, as surface fluxes are set to zero in this experiment. In order to better evaluate the role of continental evaporation, we designed a less ‘extreme’ sensitivity experiment, where the surface fluxes over the land areas are reduced to 50 % of the values from the control simulation (hereafter called LANDOFF 50 %). When considering the precipitation response to this modification, a very similar pattern to LANDOFF is identified, but the decrease in precipitation totals is smaller (e). The accumulated precipitation in the Danube catchment decreases by 40 %, which is still a stronger response than in the NAOFF simulation (f). Land evapotranspiration thus has a major role as a moisture source even in this less ‘extreme’ sensitivity experiment.
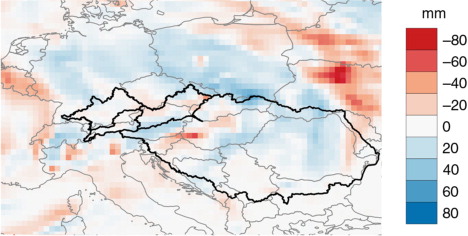
The role of the North Atlantic as moisture source for the event is more difficult to interpret. The absence of this moisture source can trigger different feedbacks over the study area. For example, less moisture from the North Atlantic might cause less precipitation over land in days prior to the flood event. This may lead to a decrease of evapotranspiration over land due to the recycling process, and thus less precipitation during the event. To analyse the role of this feedback in the NAOFF simulation, we computed the precipitation differences during the week before the event in the NAOFF simulation compared to the control simulation (). We found that the precipitation is slightly higher than in the CTRL simulation for Central Europe, where the majority of the previously investigated trajectories originate. The decrease of precipitation is noticeable only along parts of the cyclone B track. This suggests that precipitation decrease in the NAOFF simulation is primarily due to the decreased moisture transport and not due to the weakened precipitation recycling.
Fig. 13 Difference of accumulated precipitation prior to the event (23.05.2013–29.05.2013) between NAOFF and the control simulation.
Based on the results of the sensitivity experiments, we conclude that the continental area and the North Atlantic Ocean were the most important moisture sources for this heavy precipitation event. Based on our simulations, the Mediterranean had only a moderate influence, and the Black Sea played almost no role as a moisture source.
8. Summary and conclusions
The objective of this study was to identify and estimate the role of different potential moisture sources of the 2013 Central European flood event with a modelling approach. Based on the evaluation of different control simulations, we could show that CCLM is generally able to capture the heavy precipitation event along the northern range of the Alps, which led to the flood event on the Danube. The backward trajectory analysis and a set of sensitivity experiments revealed that the main moisture sources contributing to the heavy precipitation event were primarily the continental evapotranspiration over Eastern Europe and secondly the North Atlantic region. In comparison, the role of evaporation from the Mediterranean is small, which is somewhat unexpected given the tracks of the studied cyclones. A previous climatological analysis by Sodemann and Zubler (Citation2010) had shown that during summer the moisture is transported into Central Europe from the North Atlantic, the Mediterranean Sea, the North and Baltic Sea and continental land surfaces in an approximately equal amount. Thus, the combination of the land evapotranspiration and the North Atlantic Ocean as moisture sources for the summer flood in 2013 is not necessarily unusual. For example, the two main contributing moisture sources for the Eastern European flood of May 2010 were the continental evapotranspiration and the North Atlantic (Winschall et al., Citation2014b). For both the 2010 and the 2013 flood events, the relevant cyclones moved from southerly direction counter-clockwise around a mountain ridge (Carpathian Mountains in 2010 and the Alps in 2013), which resulted in orographically induced precipitation. Furthermore, our present results indicate that a heavy precipitation event can incorporate moist air from both local and distant regions.
The importance of land evapotranspiration for the 2013 event found in this study agrees well with the findings of Grams et al. (Citation2014). Furthermore, we have identified the North Atlantic as second moisture source, which the Lagrangian method of Grams et al. (Citation2014) did not reveal. These results demonstrate the added value of performing sensitivity studies with RCMs to evaluate the development of extreme events like heavy precipitation events and floods.
Our results confirm the importance of continental moisture recycling for heavy precipitation events affecting Central Europe during the summer half year. Moreover, this case study confirms that given favourable pre-conditionings like enhanced soil moisture and a quasi-stationary cut-off low, the involved cyclones do not necessarily need to be unusually strong to lead to severe flooding and thus to strong socio-economic impacts.
9. Acknowledgements
We thank the European Centre for Medium-Range Weather Forecasts (ECMWF) for providing the ERA-Interim data. We acknowledge the E-OBS data set from the EU-FP6 project ENSEMBLES (www.ensembles-eu.metoffice.com) and the data providers in the ECA&D project (www.ecad.eu). We thank the German Climate Computer Centre (DKRZ, Hamburg) for computer and storage resources within the context of DKRZ project ANDIVA (Number 105). Also we thank the International Commission for Protection of Danube River (ICPDR) for the information on the Danube catchment. We thank both reviewers whose constructive comments helped to improve the manuscript.
Related Research Data
References
- BfG. Das Juni-Hochwasser des Jahres 2013 in Deutschland (The 2013 June flood in Germany). 2013; Koblenz, Germany: Federal Institute of Hydrology. BfG Report no. 1793.
- Blöschl G. , Nester T. , Komma J. , Parajka J. , Perdigão R. A. P . The June 2013 flood in the Upper Danube Basin, and comparisons with the 2002, 1954 and 1899 floods. Hydrol. Earth Syst. Sci. 2013; 17: 5197–5212.
- Born K. , Ludwig P. , Pinto J. G . Wind gust estimation for Mid-European winter storms: Towards a probabilistic view. Tellus A. 2012; 64: 17471. http://dx.doi.org/10.3402/tellusa.v64i0.17471 .
- Cyberski J. , Grześ M. , Gutry-Korycka M. , Nachlik E. , Kundzewicz Z. W . History of floods on the River Vistula. Hydrol. Sci. J. 2006; 51: 799–817.
- Dee D. P. , Uppala S. M. , Simmons A. J. , Berrisford P. , Poli P. , co-authors . The ERA-Interim reanalysis: configuration and performance of the data assimilation system. Q. J. Roy. Meteorol. Soc. 2011; 137: 553–597.
- Doms G. , Förstner J. , Heise E. , Herzog H. J. , Mironov D. , co-authors . A Description of the Nonhydrostatic Regional COMOS Model. Part II: Physical Parameterization. 2011. Technical Report, Consortium for Small-Scale Modelling. Online at: http://www.cosmo-model.org .
- Gimeno L. , Drumond A. , Nieto R. , Trigo R. M. , Stohl A . On the origin of continental precipitation. Geophys. Res. Lett. 2010; 37: L13804.
- Grams C. M. , Binder H. , Pfahl S. , Piaget N. , Wernli H . Atmospheric processes triggering the Central European floods in June 2013. Nat. Hazards Earth Syst. Sci. 2014; 14: 1691–1702.
- Haylock M. R. , Hofstra N. , Klein Tank A. M. G. , Klok E. J. , Jones P. D. , co-authors . A European daily high-resolution gridded dataset of surface temperature and precipitation. J. Geophys. Res. Atmos. 2008; 113: 20119. http://dx.doi.org/10.1029/2008JD10201 .
- Hermans A. , Ament F. , Geyer B. , Matthias V. , Quante M. , co-authors . Evaluation of humidity, clouds and precipitation in COSMO-CLM and MM5 over Germany. Meteorol. Z. 2012; 21: 487–502.
- Kelemen F. D. , Bartholy J. , Pongracz R . Multivariable cyclone analysis in the Mediterranean region. Idojaras Q. J. Hungarian Meteorol. Service. 2015; 119: 159–184.
- Law R. M . Modelling the Global Transport of Atmospheric Constituents. 1993; Perkville, Victoria, Australia: School of Earth Sciences, University of Melbourne. PhD Thesis.
- Ludwig P. , Pinto J. G. , Reyers M. , Gray S. L . The role of anomalous SST and surface fluxes over the southeastern North Atlantic in the explosive development of windstorm Xynthia. Q. J. Roy. Meteorol. Soc. 2014; 140: 1729–1741. http://dx.doi.org/10.1002/qj.2253 .
- Noone D. , Simmonds I . A Three-Dimensional Spherical Trajectory Algorithm. 1999. Research Activities in Atmospheric and Oceanic Modelling, Report No. 28, WMO/TD-No. 942. H. Ritchie, Ed., World Meteorological Organization, 3.26–3.27.
- Pinto J. G. , Ulbrich S. , Parodi A. , Rudari R. , Boni G. , co-authors . Identification and ranking of extraordinary rainfall events over Northwest Italy: The role of Atlantic moisture. J. Geophys. Res. Atmos. 2013; 118: 2085–2097. http://dx.doi.org/10.1002/jgrd.50179 .
- Peixoto J. P. , Oort A. H . Physics of climate. 1992; New York: Springer-Verlag. 520.
- Ritter B. , Geleyn J.-F . A comprehensive radiation scheme for numerical weather prediction models with potential applications in climate simulations. Mon. Wea. Rev. 1992; 120: 303–325.
- Rockel B. , Castro C. L. , Pielke R. A. , von Storch H. , Leoncini G . Dynamical downscaling: Assessment of model system dependent retained and added variability for two different regional climate models. J. Geophys. Res. Atmos. 2008; 113: 21107. http://dx.doi.org/10.1029/2007JD009461 .
- Rudari R. , Entekhabi D. , Roth G . Large-scale atmospheric patterns associated with mesoscale features leading to extreme precipitation events in Northwestern Italy. Adv. Water Res. 2005; 28: 601–614.
- Schröter K. , Kunz M. , Elmer F. , Mühr B. , Merz B . What made the June 2013 flood in Germany an exceptional event? A hydro-meteorological evaluation. Hydrol. Earth Syst. Sci. 2015; 19: 309–327. http://dx.doi.org/10.5194/hessd-11-8125-2014 .
- Sodemann H. , Wernli H. , Schwierz C . Sources of water vapour contributing to the Elbe flood in August 2002 – A tagging study in a mesoscale model. Q. J. Roy. Meteorol. Soc. 2009; 135: 205–223. http://dx.doi.org/10.1002/qj.374 .
- Sodemann H. , Zubler E . Seasonal and inter-annual variability of the moisture sources for alpine precipitation during 1995–2002. Int. J. Climatol. 2010; 30: 947–961. http://dx.doi.org/10.1002/joc.1932 .
- Stohl A. , James P . A Lagrangian analysis of the atmospheric branch of the global water cycle: Part 1: Method description, validation, and demonstration for the August 2002 flooding in central Europe. J. Hydrometeorol. 2004; 5: 656–678.
- Tiedtke M . A comprehensive mass flux scheme for cumulus parameterization in large-scale models. Mon. Wea. Rev. 1989; 117: 1779–1800.
- Ulbrich U. , Brücher T. , Fink A. H. , Leckebusch G. C. , Krüger A. , co-authors . The central European floods of August 2002: Part 1 – Rainfall periods and flood development. Weather. 2003a; 58: 371–377.
- Ulbrich U. , Brücher T. , Fink A. H. , Leckebusch G. C. , Krüger A. , co-authors . The central European floods of August 2002: Part 2 – Synoptic causes and considerations with respect to climatic change. Weather. 2003b; 58: 434–442.
- Von Storch H. , Langenberg H. , Feser F . A Spectral nudging technique for dynamical downscaling purposes. Mon. Wea. Rev. 2000; 128: 3664–3673.
- Winschall A. , Pfahl S. , Sodemann H. , Wernli H . Impact of North Atlantic evaporation hot spots on southern Alpine heavy precipitation events. Q. J. Roy. Meteorol. Soc. 2012; 138: 1245–1258.
- Winschall A. , Sodemann H. , Pfahl S. , Wernli H . How important is intensified evaporation for Mediterranean precipitation extremes?. J. Geophys. Res. Atmos. 2014a; 119: 5240–5256. http://dx.doi.org/10.1002/2013JD021175 .
- Winschall A. , Pfahl S. , Sodemann H. , Wernli H . Comparison of Eulerian and Lagrangian moisture source diagnostics – The flood event in Eastern Europe in May 2010. Atmos. Chem. Phys. 2014b; 14: 6605–6619.