
Abstract
Most peripheral seas of the Arctic Ocean have seen a pronounced rise in sea surface temperatures in the past century, and this signature of Arctic amplification in proximity to the land suggests that the observed marine and terrestrial changes might be connected to each other. Using in situ observations of temperature from nine coastal meteorological stations around Greenland (GrSTs) and remotely sensed fields of sea ice extent (SIE), we examine the interannual variations of surface air temperature (T2m) and sea level pressure (SLP) anomalies associated with the GrSTs and SIEs surrounding Greenland, specifically within Baffin Bay, the Greenland Sea and Kara-Barents Seas. During winter, the interannual variation in T2m and SLP of the west and south coasts of GrSTs and the Baffin Bay SIE are different from that of the east coast of GrSTs and the SIEs in the Greenland Sea and Kara-Barents Seas. The GrSTs on the west and south coasts of Greenland and the Baffin Bay SIE are associated with the T2m anomalies over Baffin Bay and Davis Strait. The winter SLP patterns associated with these GrSTs and SIEs show positive anomalies over the Arctic and negative anomalies over the North Atlantic with a large-scale atmospheric circulation such as the winter NAO. On the contrary, the east coast of GrSTs and the SIEs in the Greenland Sea and Kara-Barents Seas are correlated with the T2m anomalies over the Greenland Sea and Barents Sea. The surface wind pattern associated with the SIEs in the Greenland Sea and Kara-Barents Seas has a cyclonic circulation in the Greenland Sea and Barents Sea. At the local scale the cyclonic circulation could induce negative SIE anomalies and contribute to increasing open water in the Greenland Sea and Barents Sea. The effect of the loss of sea ice and the heat from the open ocean warming to the atmosphere may influence the GrSTs in the east coast of Greenland. As a result, the T2m pattern associated with the GrSTs in the east coast of Greenland is similar to the pattern of the SIEs in the Greenland Sea and Kara-Barents Seas. During summer, the T2m anomalies associated with all GrSTs and SIEs have positive anomalies over mid-latitudes. The two times series of all GrSTs and SIEs fluctuate quickly and display large trends towards warming temperatures and decreasing SIE. The summer SLP associated with all GrSTs and SIEs are characterised by a seesaw pattern between positive anomalies over the Arctic and negative anomalies over mid-latitudes. The summer SLP anomalies are similar to the summer AO pattern, and it is noteworthy that the summer anticyclonic circulation over the Arctic and Greenland has contributed to the variability and trends in both summer GrSTs and SIEs.
1. Introduction
Since the 1970s, the Northern Hemisphere has become significantly warmer over the Arctic region (Serreze and Francis, Citation2006; Screen and Simmonds, Citation2010; Walsh, Citation2014; Overland et al., Citation2015) including Greenland (Box et al., Citation2012; Hanna et al., Citation2012). In particular, warmer conditions in the past decade are associated with the decrease in Arctic sea ice (Ogi and Wallace, Citation2007; Serreze et al., Citation2007, Citation2009; Screen and Simmonds, Citation2010) and increased melt of the Greenland ice cap (Graversen et al., Citation2011; Box et al., Citation2012; Hanna et al., Citation2012, Citation2014; Fettweis et al., Citation2013; Van Angelen et al., Citation2014). The retreat of Arctic sea ice is congruent with the period of ice sheet mass loss over Greenland, which has accelerated since the 1990s (Mote, Citation2007; Serreze et al., Citation2007; Comiso et al., Citation2008; Rignot et al., Citation2008; Fettweis et al., Citation2011; Hanna et al., Citation2013b; Ogi and Rigor, Citation2013). Both Arctic sea ice extent (SIE) and the Greenland ice cap experienced record lows in 2007 and 2012 (Mote, Citation2007; Nghiem et al., Citation2007, Citation2012; Ogi et al., Citation2008; Tedesco et al., Citation2008; Parkinson and Comiso, Citation2013; Hanna et al., Citation2014). Rapid climate change over the Arctic and Greenland have affected marine ecosystems, biological, biogeochemical processes and marine mammals (Rysgaard et al., Citation2011; Duarte et al., Citation2012; Glud et al., Citation2012; Parmentier et al., Citation2013; Barber et al., Citation2015; Bromaghin et al., Citation2015; Laidre et al., Citation2015).
The surface air temperature in Greenland, especially the temperature in west Greenland, is known to be influenced by the North Atlantic Oscillation (NAO) (Box, Citation2002; Hanna and Cappelen, Citation2003; Noël et al., Citation2014). During summer, the negative phase of a persistent NAO between positive pressure anomalies over Greenland and negative pressure anomalies over the North Atlantic Ocean is correlated with warm temperature anomalies. In particular, anomalous atmospheric circulation since 2007 attributed to the persistent negative summer NAO has favoured warmer summer temperatures over the ice sheet and enhanced surface ice melt (Fettweis et al., Citation2013; Hanna et al., Citation2015). On the contrary, Rajewicz and Marshall (Citation2014) identified that summer anticyclonic circulation anomalies over the entire Greenland ice sheet were the strongest on record in 2012 and mass loss from the Greenland ice sheet had increased dramatically. They also pointed out that the recent increase in the Greenland ice sheet melt is strongly associated with increased anticyclonic circulation over the entire Greenland since 2001, and the summer NAO may not be a causal mechanism for the anticyclonic circulation anomalies over Greenland and the Greenland ice sheet melt. Hanna et al. (Citation2016) recently found a significant clustering of summer high-pressure blocking over Greenland since 2007.
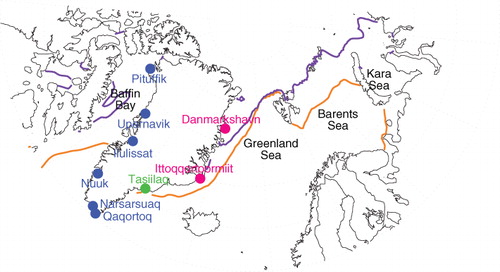
Greenland is surrounded by seas (). A large portion of these seas are either continuously or seasonally covered by sea ice, though under a changing climate sea ice concentrations (SICs) surrounding Greenland are decreasing (Barber et al., Citation2015) and the already high degree of seasonal variability in SIC is increasing. The SICs surrounding Greenland are greatly affected by surface air temperatures and large-scale atmospheric circulation. The dominant pattern associated with winter sea ice variability resembles the winter NAO (Wang et al., Citation1994; Mysak et al., Citation1996; Deser et al., Citation2000; Strong, Citation2012). The recent decreases in sea ice may be related to the increase in Greenland ice sheet melt and warming surface air temperatures. Rennermalm et al. (Citation2009) showed that summer ice sheet melt on the west coast of Greenland displays significant correlations with open water in the Davis Strait and warm air temperatures along the west coast of Greenland. They suggested that the open water enhances the Greenland ice sheet melt, because ocean temperatures are warmer and sea-ice melt, and the westerly winds allow advection of ocean heat onto the ice sheet enhancing ice sheet melt and warm surface temperatures. The variability of sea ice surrounding Greenland can be expected to influence the large thermal mass of the Greenland ice sheet and concomitantly we would expect sea ice to affect local surface temperatures as a function of open water and increased heat fluxes from the ocean to atmosphere and the effect that these fluxes can have at the local and regional scales.
Fig. 1 Location map of Greenland climate stations from the DMI and sea ice extent (SIE) from NSIDC. Orange and purple lines are 50 % sea ice concentration (SIC) based on the HadISST in winter and summer, respectively.
Using Greenland station temperatures (GrSTs) from coastal Greenland and SIE in the marginal seas surrounding Greenland (Baffin Bay, Greenland Sea and Kara-Barents Sea) we look at the relationship between these variables and the atmospheric circulation patterns that foster these relationships. Specifically, we ask the following questions: (1) What are the patterns of the atmospheric anomalies associated with the variability in GrSTs and SIEs during winter and summer? (2) Are the interannual variability and trends in GrSTs and SIEs correlated with each other? (3) How do atmospheric anomalies influence the GrSTs and surrounding SIEs?
This paper is organised as follows: The observational datasets of GrSTs, SIEs and atmospheric reanalysis datasets are described in Section 2. The relationship between winter GrSTs and SIEs through winter atmospheric anomalies are examined in Section 3. In Section 4, these relationships during summer are presented. Section 5 summarises our work and discusses the relationship between GrSTs and SIEs through atmospheric patterns during both winter and summer.
2. Datasets
Monthly surface air temperatures from coastal Greenland stations (GrSTs) were retrieved from the Danish Meteorological Institute (DMI) historical climate data-collection (Cappelen, Citation2011). The nine coastal stations used in this study are shown in : Pituffik from 1948 to 2013, Upernavik from 1948 to 2013, Ilulissat from 1948 to 2013, Nuuk from 1948 to 2013, Narsarsuaq from 1961 to 2013, Qaqortoq from 1948 to 2013, Danmarkshavn from 1949 to 2013, Ittoqqortoormiit from 1949 to 2013 and Tasiilaq from 1948 to 2013.
Monthly SIE data were obtained from the National Snow and Ice Data Center (NSIDC) (www.nsidc.org/data/smmr_ssmi_ancillary/area_extent.html#smmr_ssmi) archive and subsequently extracted for the three seas surrounding Greenland: Baffin Bay, Greenland Sea and Kara-Barents Seas () for the period from 1979 to 2013. Note that within this dataset SIE is defined as the boundary of 15 % SIC. The monthly contour of 50 % SIC in was retrieved from the Hadley Centre Sea Ice and Sea Surface Temperature data set (HadISST) (Rayner et al., Citation2003).
Atmospheric surface air temperature at 2 m (T2m), sea level pressure (SLP) and surface winds at 10 m came from the NCEP/NCAR reanalysis dataset from 1948 to 2013 (Kalnay et al., Citation1996). Here, ‘winter’ and ‘summer’ are defined as January–February–March (JFM) and June–July–August (JJA), respectively.
3. Winter
3.1. Winter surface air temperature
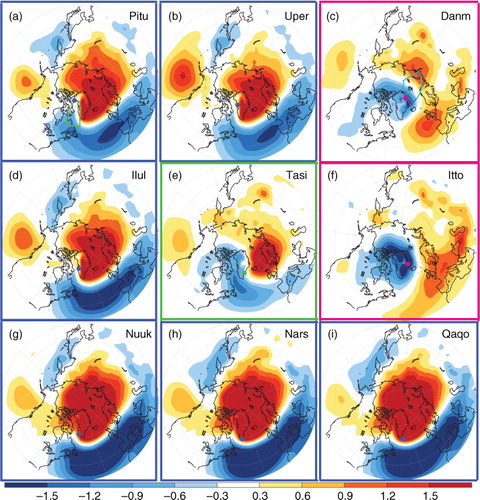
shows the patterns in winter T2m regressed on the time series of the winter nine station GrSTs datasets: (a) Pituffik, (b) Upernavik, (c) Danmarkshavn, (d) Ilulissat, (e) Tasiilaq, (f) Ittoqqortoormiit, (g) Nuuk, (h) Narsarsuaq and (i) Qaqortoq. The patterns of T2m regressed on temperatures from six coastal stations in west and south Greenland (blue stations and frames in and ) show strong positive anomalies over Baffin Bay and Davis Strait. The T2m regression patterns in relation to two coastal stations in the east coast of Greenland (pink stations and frames in and ) show strong positive anomalies over the Greenland Sea and Barents Sea. The T2m regression patterns in relation to the Tasiilaq station (green station and frame in and ) show positive anomalies in west, south and east Greenland.
Fig. 2 Horizontal maps of winter surface air temperature at the 2 m level (T2m, °C) regressed on standardised yearly indices of winter Greenland station temperatures (GrSTs): (a) Pituffik, (b) Upernavik, (c) Danmarkshavn, (d) Ilulissat, (e) Tasiilaq, (f) Ittoqqortoormiit, (g) Nuuk, (h) Narsarsuaq and (i) Qaqortoq. These Greenland stations show dotted colours that are the same colours in the stations in . T2m area over the west of Greenland (green box in a), east of Greenland (Purple box in c) and Barents Sea (blue box in c) are calculated by 55–75°N, 290–310°W, 70–80°N, 340–360°W, and 70–85°N, 0–70°E, respectively. Colour intervals are indicated on the scale bar (°C).
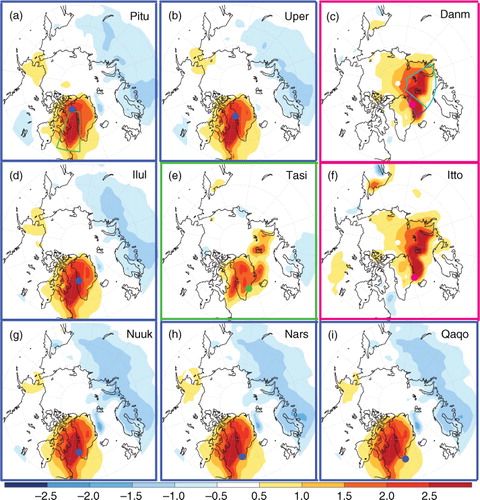
shows the correlation coefficients for air temperatures at the nine GrSTs across the entire time series. The six stations along the western and southern coast of Greenland (blue) are highly correlated with each other. Likewise, the Danmarkshavn and Ittoqqortoormiit on the east coast of Greenland (pink colour) are also correlated. However, the correlation coefficients between the six coastal stations in west and south Greenland and the two coastal stations in east Greenland are very low (black colours) and even negative. The correlation coefficients between the temperature in the Tasiilaq station (southeast – green) and the other stations are positive and statistically significant at the 99.9 % level. The results of this cross-correlation analysis are consistent with the T2m regression patterns shown in .
Table 1. Correlation coefficients matrix winter surface temperature on the station datasets based on the DMI
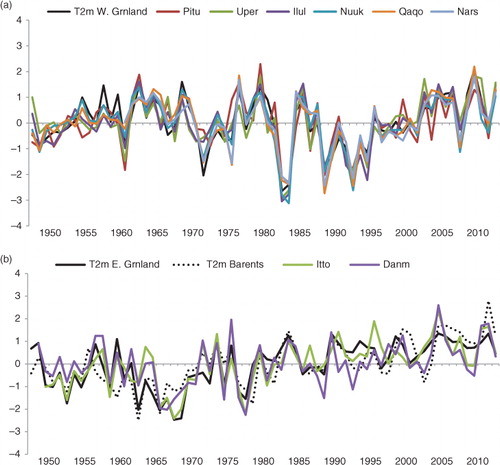
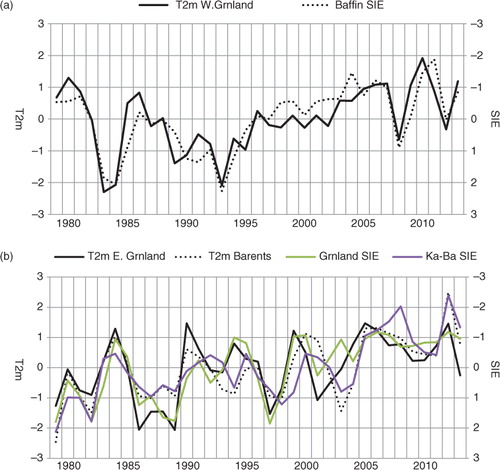
shows winter time series of (a) the GrSTs from six coastal stations in west and south Greenland together with the T2m temperatures over Baffin Bay and Davis Strait (green box area in a), and (b) the GrSTs from two coastal stations in the east coast of Greenland with the T2m over the Greenland Sea and Barents Sea (purple and blue box areas in c). On the west side of Greenland, the interannual variations of the west and south coasts of GrSTs are correlated with the variability of the T2m over Baffin Bay and the Davis Strait. On the east side of Greenland, the interannual variations of GrSTs show good correlation with the T2m over the Greenland Sea and Kara-Barents Seas. In addition, the GrSTs and T2m indices shown in b have a positive trend since the mid-1960s.
Fig. 3 (a) Standardised time series of winter T2m over Baffin Bay and Davis Strait (green box in a) and winter GrSTs from six stations on the west and south of Greenland (Pituffik, Upernavik, Ilulissat, Nuuk, Qaqortoq and Narsarsuaq). (b) Time series of winter T2m over the Greenland Sea and Barents Sea (purple and blue boxes in c) and winter GrSTs from two stations over the east of Greenland (Ittoqqortoormiit and Danmarkshavn).
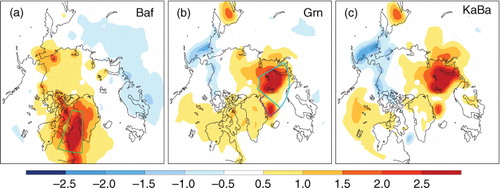
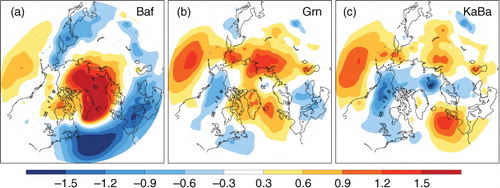
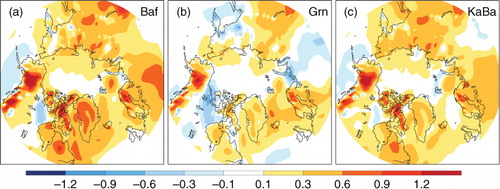
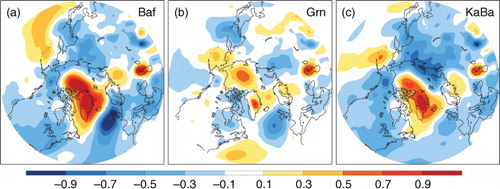
shows the winter T2m anomalies regressed upon inverted winter SIE time series over the (a) Baffin Bay, (b) Greenland Sea and (c) Kara-Barents Seas for the period of record 1979–2013. The T2m regressed onto the inverted Baffin Bay SIE (a) show strong positive anomalies over Baffin Bay and Davis Strait. The T2m regression anomalies associated with the SIEs in the Greenland Sea and Kara-Barents Seas show strong positive anomalies over the Greenland Sea and Barents Sea (b and c). The regression pattern related to the Baffin Bay SIE is similar to the regression patterns of GrSTs at the six coastal stations in west and south Greenland (, blue frames). In contrast, the regression patterns in relation to the SIEs in the Greenland Sea and Kara-Barents Seas are similar to regression patterns associated with the two coastal stations on the east coast of Greenland (, pink frames).
Fig. 4 As in but winter T2m regressed on an inverted standardised yearly index of winter SIE from 1979 to 2013: (a) Baffin Bay, (b) Greenland Sea and (c) Kara-Barents Seas. The green, purple and blue boxes in 4a and b are the same as in a and c.
a shows the time series of area-averaged T2m over Baffin Bay and Davis Strait (green box in a) together with the time series of normalised and inverted SIEs during winter over Baffin Bay from 1979 to 2013. The year-to-year variation in the Baffin Bay SIE is well correlated with the variation in the area-averaged T2m over Baffin Bay and Davis Strait. Likewise, the variations of SIEs in the Greenland Sea and Kara-Barents Seas (b) are correlated with the interannual variations of T2m over the east side of the Greenland Sea and Barents Sea. In addition, both the T2m and the SIEs display trends towards increasing temperatures and decreasing SIE.
Fig. 5 Standardised times series of winter T2m and (a) SIE in Baffin Bay and (b) SIEs in the Greenland Sea and Kara-Barents Seas from 1979 to 2013. Area-averaged T2m is shown in a (green box) and b (Purple and blue boxes). The SIE axis is reversed.
3.2. Winter SLP and surface wind fields
This section investigates winter atmospheric circulation patterns associated with the winter GrSTs and SIEs. shows winter SLP anomalies regressed on the winter GrSTs from the nine coastal stations. The winter SLP associated with the winter GrSTs from the six coastal stations in west and south Greenland shows significant positive anomalies over Greenland and the Arctic Ocean, and negative anomalies over the North Atlantic Ocean. In contrast, the winter SLP associated with the winter GrSTs from the two coastal stations (c) Danmarkshavn and (f) Ittoqqortoormiit in east Greenland shows negative anomalies over Greenland. The regression pattern associated with GrSTs in Tasiilaq (e) shows a combination of anomalies from west, south and east Greenland.
Fig. 6 As in but for winter mean sea level pressure (SLP, hPa) regressed on winter GrST indices.
shows the winter SLP patterns regressed on the winter SIEs in Baffin Bay, the Greenland Sea and Kara-Barents Seas. The regression pattern associated with the Baffin Bay SIE (a) shows positive anomalies over Greenland and the Arctic, and negative anomalies over the North Atlantic Ocean. The SLP anomalies regressed on the SIEs in the Greenland Sea and Kara-Barents Seas (b and c) are weak compared with the anomalies associated with the Baffin Bay SIE. It is known that the winter SIC anomalies represent a seesaw between the western (the Labrador sea) and eastern (the Nordic sea) parts of Greenland, and that the SIC variations are associated with atmospheric circulation over the North Atlantic that resemble the winter NAO (Deser et al., Citation2000; Yamamoto et al., Citation2006; Ukita et al., Citation2007). However, Deser et al. (Citation2000) noted that a local response of the atmospheric circulation may enhance the changing sea ice cover east of Greenland, and the change differs from those associated directly with the winter NAO. Our results in are consistent with Deser et al. (Citation2000), highlighting that SIE in Baffin Bay off the west coast of Greenland is associated with large-scale atmospheric circulation patterns while SIEs in the Greenland Sea and the Kara-Barents Seas off the east coast of Greenland are associated with a local response of the atmospheric circulation.
Fig. 7 As in but for winter SLP regressed on an inverted winter SIE indices.
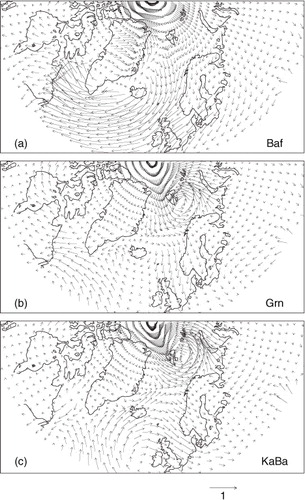
To assess these dynamical effects on the sea ice, shows the winter surface winds at 10 m regressed on the winter SIEs in Baffin Bay, the Greenland Sea and Kara-Barents Seas. The surface winds associated with the Baffin Bay SIE (a) flow as a northerly wind over the Greenland Sea toward an easterly wind over the North Atlantic Ocean. The northeasterly winds associated with the anticyclonic circulation may induce the reduction of cold northwesterly winds which is a limiting factor for the spread of sea ice. This thermodynamic effect on sea ice may contribute to negative anomalies in the Baffin Bay SIE. On the contrary, the surface winds associated with SIEs in the Greenland Sea and Kara-Barents Seas (b and c) have a cyclonic circulation in the Greenland Sea and Barents Sea. The results indicate that a northerly wind in the Greenland Sea and a westerly wind toward a northerly wind in the Barents Sea associated with the cyclonic circulation could induce negative SIE anomalies in the Greenland Sea and the Kara-Barents Seas. This dynamic forcing on sea ice may contribute to increasing open water in the Greenland Sea and Kara-Barents Seas. The surface waters in these seas are capable of absorbing solar heat, which will be released back to the atmosphere. As a result, the T2m temperature anomalies regressed on the SIEs in both the Greenland Sea and Kara-Barents Seas (b and c) are warmer than normal.
Fig. 8 As in but for winter surface winds at 10 m (m/s) regressed on an inverted winter SIE indices.
Within this study we also indicate that the regression pattern associated with the Baffin Bay SIE is quite similar to the patterns using the GrSTs from the west and south coasts of Greenland. The Baffin Bay SIE and the GrSTs are correlated with both the T2m over Baffin Bay and Davis Strait, and the large-scale atmospheric circulation between the Arctic Ocean and the North Atlantic Ocean. The results show that large-scale changes in T2m and SLP are associated with the winter NAO.
However, the regression anomalies associated with SIEs in the Greenland Sea and Kara-Barents Seas are not similar to the patterns associated with the Baffin Bay SIE. The cyclonic circulation in local scale could induce low sea ice in the Greenland Sea and Kara-Barents Seas (b and c). The effect of the loss of sea ice and the heat from the open ocean warming to the atmosphere may influence the GrSTs on the east side of Greenland. As a result, the T2m regressed on the GrSTs on the east side of Greenland (c and f) are similar to the T2m patterns of the SIEs in the Greenland Sea and Kara-Barents Seas (b and c).
4. Summer
4.1. Summer surface air temperature
In this section, we examine the variability of the summer GrSTs and the summer SIE associated with the summer atmosphere. shows the patterns in the summer T2m regressed on the time series of the summer GrSTs. The T2m patterns regressed on all GrSTs shows warm anomalies over mid-latitudes. The summer T2m patterns are quite different compared with the winter T2m regression patterns (). The summer regression patterns associated with the inverted summer SIEs in Baffin Bay, the Greenland Sea and Kara-Barents Seas () also show warm anomalies over mid-latitudes.
Fig. 9 As in but summer T2m regressed on summer GrST indices.
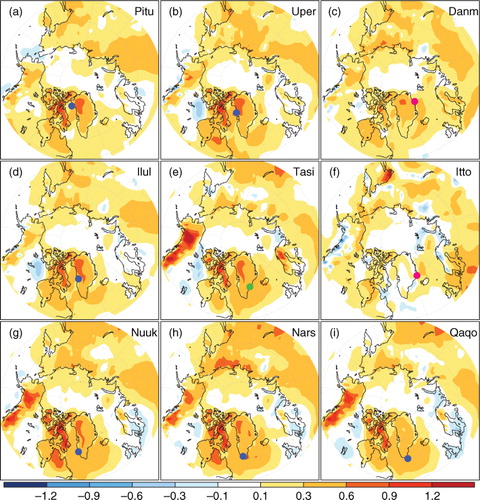
Fig. 10 As in but summer T2m regressed on an inverted summer SIE indices.
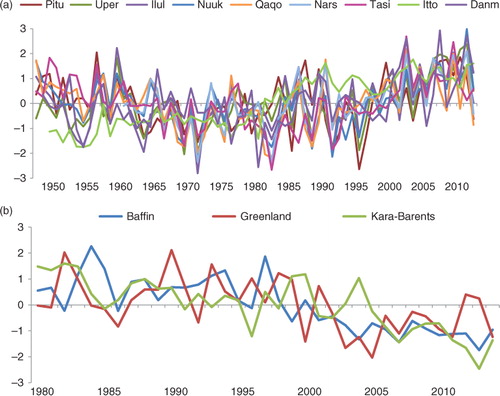
shows the summer time series of all nine GrSTs stations (a) and SIEs in Baffin Bay, the Greenland Sea and Kara-Barents Seas (b). The rapid fluctuations in the time series of GrSTs and SIEs show a robust coherence that have many cycles through the time series implying that the fast variability does not tend to correlate just by coincidence. Furthermore, the two times series of all GrSTs and SIEs have large trends; increasing temperatures and decreasing SIE. The coherence of interannual variations and trends in both the GrSTs and SIEs has a strong component in the T2m regression patterns ( and ).
Fig. 11 Standardised time series of (a) summer nine GrSTs surrounding Greenland and (b) summer three SIEs in Baffin Bay, the Greenland Sea and Kara-Barents Seas.
4.2. Summer sea level pressure
shows summer SLP patterns regressed on the summer GrSTs. The summer SLP regression patterns associated with the summer GrSTs are apparent as a seesaw pattern between mid- and high-latitudes, although the SLP anomalies associated with the GrSTs are weak for the stations located on the east coast of Greenland (c and f).
Fig. 12 As in but summer SLP regressed on summer GrST indices.
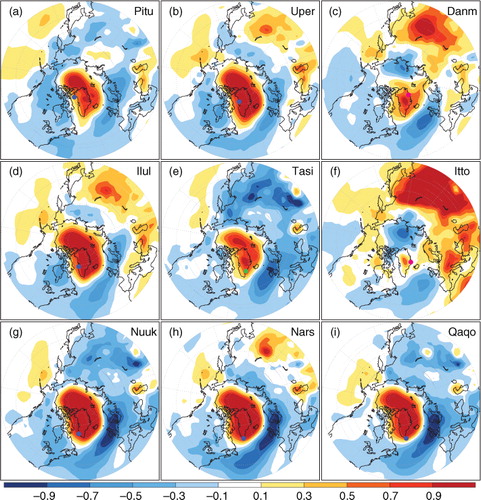
Although it is well known that the summer NAO is associated with the summer GrSTs (Box, Citation2002; Hanna and Cappelen, Citation2003; Noël et al., Citation2014), our result regarding the regression patterns disagree with the previous works on the summer GrSTs and summer NAO. The regression patterns have positive anomalies over the Arctic and negative anomalies over mid-latitudes. The summer seesaw pattern is smaller than the meridional scale compared with the winter seesaw pattern (). The summer atmospheric patterns are similar to the summer Arctic Oscillation (AO) pattern defined by Ogi et al. (Citation2004). The summer AO was using a separate empirical orthogonal function (EOF) analysis for each individual calendar month. In contrast, the conventional AO defined by Thompson and Wallace (Citation1998) was using a single EOF analysis for all calendar months. The summer AO has a smaller meridional scale than the conventional AO. The summer AO is more important as a factor contributing to summer atmospheric variability than the conventional AO.
The summer regression patterns associated with all SIEs in Baffin Bay, the Greenland Sea and Kara-Barents Seas () show positive anomalies over the Arctic and Greenland. The summer atmospheric pattern greatly influences the summer sea ice surrounding Greenland. Recent anticyclonic circulation over the Arctic is stronger and has contributed to the decreased Arctic SIE (Ogi and Wallace, Citation2012; Ogi and Rigor, Citation2013; Ogi et al., Citation2016). The anticyclonic circulation suggests a surface wind flow from the Beaufort and Chukchi Seas towards Fram Strait, which could favour enhanced sea ice export from the Arctic toward Fram Strait. In this study, we indicate that the anticyclonic circulation is associated with the decreased SIEs in Baffin Bay, the Greenland Sea and Kara-Barents Seas. Positive SLP anomalies across the Pole suggest a southerly wind flow in the west side of Greenland and a northerly wind flow in the east side of Greenland. These wind flows could move the Baffin Bay SIE from south toward the north and the SIEs in the Greenland Sea and Kara-Barents Seas from north toward the south. The anticyclonic circulation could induce the flow of SIEs in Baffin Bay, the Greenland Sea and Kara-Barents Seas.
Fig. 13 As in but for summer SLP regressed on an inverted summer SIE indices.
5. Summary and discussion
In this study, we have found that the winter interannual variations of GrSTs are regulated differently between west, south and east Greenland. The interannual variations of the SIEs during winter are also different between Baffin Bay and the Greenland Sea and Kara-Barents Seas. The winter GrSTs in west and south Greenland and the Baffin Bay SIE are associated with the interannual variations of winter T2m over Baffin Bay and Davis Strait. The GrSTs and SIE in the west side of Greenland are associated with the winter large-scale SLP pattern such as the winter NAO.
On the contrary, the winter GrSTs in the east coast of Greenland and the SIEs in the Greenland Sea and Kara-Barents Seas are correlated with the variability and trends of winter T2m over the Greenland Sea and Barents Sea. The atmospheric pattern associated with the decrease of SIEs in the Greenland Sea and Kara-Barents Seas are characterised by cyclonic circulation over the Greenland Sea and Barents Sea. The cyclonic circulation may induce negative SIE anomalies and increase open water in the Greenland Sea and the Kara-Barents Seas. The surface waters in these seas are capable of absorbing solar heat that can then be released back to the atmosphere and cause the GrSTs on the east coast of Greenland to experience warmer temperatures than normal. As a result, winter T2m temperature anomalies regressed on the winter GrSTs (c and f) are similar to winter SIEs patterns in both the Greenland Sea and Kara-Barents Seas (b and c).
During summer, the T2m associated with all GrSTs and SIEs have positive anomalies over mid-latitudes. The two times series of all GrSTs and SIEs fluctuate quickly and display large trends, indicating warming temperatures and decreasing SIE. Both the quick fluctuations and trends have a strong component in the T2m regression patterns. The SLP anomalies associated with all GrSTs and SIEs show a seesaw pattern between mid- and high-latitudes. The summer SLP anomaly is similar to the summer AO pattern.
Box (Citation2002) pointed out that the winter NAO exerts a significant control on the winter temperature anomalies in west and south Greenland. The result is consistent with our result that the winter negative NAO influences the warm temperatures associated with the winter GrSTs in west and south Greenland. We indicate in this study that the winter NAO does not influence the winter GrSTs in the east coast of Greenland. The GrSTs in the east coast of Greenland are correlated with the T2m over the Greenland Sea and Barents Seas. Strong (Citation2012) showed that the interannual variability in the extent of the winter marginal ice zone (MIZ) in the Atlantic sector, the Labrador Sea, Greenland Sea and Barents Sea is influenced by the winter NAO-like atmospheric patterns. However, the winter atmospheric circulation patterns did not account for the trends in the winter MIZ position and extension. Instead, the winter MIZ trends were related to Arctic warming and decreasing SICs. Our results indicate that winter surface wind anomalies associated with the winter SIEs in the Greenland Sea and Kara-Barents Seas are characterised by a cyclonic circulation in the Greenland Sea and Barents Sea. The cyclonic circulation is associated with warming temperatures and decreasing SIEs in the east side of Greenland.
Hanna et al. (Citation2013a) showed that the summer GrSTs in west and south Greenland are more strongly correlated with the atmospheric pressure anomalies over Greenland (i.e. Greenland blocking) than the summer NAO since the 1970s. Bezeau et al. (Citation2015) found that the strong summer anticyclonic circulation over the Canadian Arctic Archipelago and western Greenland is more frequent between 2007 and 2012 than from 1948 to 2006. Hanna et al. (Citation2016) showed that since 2007 there has been a significant increase in the occurrence of Greenland blocking during summer. Ogi and Wallace (Citation2012) and Ogi et al. (Citation2016) indicated that the summer surface winds over the Arctic from 2007 have been much more anticyclonic than in prior years. A recent summer persistent pattern shifted to an Arctic Dipole circulation with low pressure over Siberia and high pressure over Greenland (Overland et al., Citation2012). The change in the summer circulation has contributed to the record low in recent September Arctic SIE. Our results from this study indicate that the anticyclonic circulation over Greenland and the Arctic, such as the summer AO pattern, have contributed to the summer GrSTs not only in west and south Greenland but also the GrSTs in east Greenland. In addition, the atmospheric patterns associated with the summer SIEs in Baffin Bay, the Greenland Sea and Kara-Barents Seas are also characterised by the summer anticyclonic circulation. The summer anticyclonic anomalies over the Arctic and Greenland have been strong recently (Ogi and Wallace, Citation2012; Rajewicz and Marshall, Citation2014; Bezeau et al., Citation2015; Hanna et al., Citation2016). In the present study, the summer anticyclonic circulation has contributed to rapid fluctuations and trends in both summer GrSTs and SIEs surrounding Greenland.
6. Acknowledgements
Greenland station temperature datasets are provided by the Danish Meteorological Institute. This study is supported by the Canada Excellence Research Chairs program and the Canada Research Chairs program. It is a contribution from the Arctic Science Partnership and ArcticNet. We thank D. Babb and two anonymous reviewers for their comments and suggestions.
Related Research Data
References
- Barber D. G. , Hop H. , Mundy C. J. , Else B. , Dmitrenko I. A. , co-authors . Selected physical, biological and biogeochemical implication of a rapidly changing Arctic margin ice zone. Prog. Oceanogr. 2015; 139: 122–150.
- Bezeau P., Sharp M., Gascon G. Variability in summer anticyclonic circulation over the Canadian Arctic Archipelago and west Greenland in the late 20th/early 21st centuries and it effect on glacier mass balance. Int. J. Climatol. 2015; 35: 540–557. DOI: http://dx.doi.org/10.1002/joc.4000.
- Box J. E . Survey of Greenland instrumental temperature records: 1873–2001. Int. J. Climatol. 2002; 22: 1829–1847.
- Box J. E., Fettweis X., Stroeve J. C., Tedesco M., Hall D. K., co-authors. Greenland ice sheet albedo feedback: thermodynamics and atmospheric drivers. Cryosphere. 2012; 6: 821–839. DOI: http://dx.doi.org/10.5194/tc-6-821-2012.
- Bromaghin J. F. , McDonald T. L. , Stirling I. , Derocher A. E. , Richardson E. S. , co-authors . Polar bear population dynamics in the southern Beaufort Sea during a period of sea ice decline. Ecol. Appl. 2015; 25(3): 634–651.
- Cappelen J . DMI monthly climate data collection 1768–2013, Denmark, The Faroe Islands and Greenland. 2011; Technical Report 14–04, Danish Meteorological Institute, Copenhagen, Denmark.
- Comiso J. C., Parkinson C. L., Gersten R., Stock L. Accelerated decline in the Arctic sea ice cover. Geophys. Res. Lett. 2008; 35: L01703. DOI: http://dx.doi.org/10.1029/2007GL031972.
- Deser C. , Walsh J. E. , Timlin M. S . Arctic sea ice variability in the context of recent atmospheric circulation trends. J. Clim. 2000; 13: 617–633.
- Duarte C. M., Agustí S., Wassmann P., Arrieta J. M., Alcaraz M., co-authors. Tipping elements in the Arctic marine ecosystem. Ambio. 2012; 41: 44–55. DOI: http://dx.doi.org/10.1007/s13280-011-0224-7.
- Fettweis X., Hanna E., Lang C., Belleflamme A., Erpicum M., co-authors. Important role of the mid-tropospheric atmospheric circulation in the recent surface melt increase over the Greenland ice sheet. 2013; Cryosphere.7: 241–248. DOI: http://dx.doi.org/10.5194/tc-7-241-2013.
- Fettweis X., Tedesco M., Van Den Broeke M., Ettema J. Melting trends over the Greenland ice sheet (1958–2009) from spaceborne microwave data and regional climate models. Cryosphere. 2011; 5: 359–375. DOI: http://dx.doi.org/10.5194/tc-5-359-2011.
- Glud R. N., Rysgaard S., Turner G., McGinnis D. F., Leakey R. J. G. Biological- and physical-induced oxygen dynamics in melting sea ice of the Fram Strait. Limnol. Oceaonogr. 2012; 59(4): 1097–1111. DOI: http://dx.doi.org/10.4319/lo.2014.59.4.1097.
- Graversen R. G., Drijfhout S., Hazeleger W., Van De Wal R., Bintanja R., co-authors. Greenland's contribution to global sea-level rise by the end of the 21st century. Clim. Dyn. 2011; 37: 1427–1442. DOI: http://dx.doi.org/10.1007/s00382-010-0918-8.
- Hanna E., Cappelen J. Recent cooling in coastal southern Greenland and relation with the North Atlantic Oscillation. Geophys. Res. Lett. 2003; 30: 1132. DOI: http://dx.doi.org/10.1029/2002GL015797.
- Hanna E., Cropper T. E., Hall R. J., Cappelen J. Greenland Blocking Index 1851–2015: a regional climate change signal. Int. J. Climatol. 2016. DOI: http://dx.doi.org/10.1002/joc.4673.
- Hanna E., Cropper T. E., Jones P. D., Scaife A. A., Allan R. Recent seasonal asymmetric changes in the NAO (a marked summer decline and increased winter variability) and associated changes in the AO and Greenland Blocking Index. Int. J. Climatol. 2015; 35: 2540–2554. DOI: http://dx.doi.org/10.1002/joc.4157.
- Hanna E., Fettweis X., Mernild S. H., Cappelen J., Ribergaard M. H., co-authors. Atmospheric and oceanic climate forcing of the exceptional Greenland ice sheet surface melt in summer 2012. Int. J. Climatol. 2014; 34: 1022–1037. DOI: http://dx.doi.org/10.1002/joc.3743.
- Hanna E., Jones J. M., Cappelen J., Mernild S. H., Wood L., co-authors. The influence of North Atlantic atmospheric and oceanic forcing effects on 1900–2010 Greenland summer climate and ice melt/runoff. Int. J. Climatol. 2013a; 33: 862–880. DOI: http://dx.doi.org/10.1002/joc.3475.
- Hanna E., Mernild S. H., Cappelen J., Steffen K. Recent warming in Greenland in a long-term instrumental (1881–2012) climatic context: I. Evaluation of surface air temperature records. Environ. Res. Lett. 2012; 7 , 045404, DOI: http://dx.doi.org/10.1088/1748-9326/7/4/045404.
- Hanna E., Navarro F. J., Pattyn F., Domingues C., Fettweis X., co-authors. Ice-sheet mass balance and climate change. Nature. 2013b; 498: 51–59. DOI: http://dx.doi.org/10.1038/nature12238.
- Kalnay E. , Kanamitsu M. , Kistler R. , Collins W. , Deaven D. , co-authors . The NCEP/NCAR 40-year reanalysis project. Bull. Am. Meteorol. Soc. 1996; 77: 437–470.
- Laidre K. L., Stern H., Kovacs K. M., Lowry L., Moore S. E., co-authors. Arctic marine mammal population status, sea ice habitat loss, and conservation recommendations for the 21st century. Conserv. Biol. 2015; 29: 724–737. DOI: http://dx.doi.org/10.1111/cobi.12474.
- Mote T. L. Greenland surface melt trends 1973–2007: evidence of a large increase in 2007. Geophys. Res. Lett. 2007; 34: L22507. DOI: http://dx.doi.org/10.1029/2007GL031976.
- Mysak L. A., Ingram R. G., Wang J., Van Der Baaren A. The anomalous sea-ice extent in Hudson bay, Baffin bay and the Labrador Sea during three simultaneous NAO and ENSO episodes. Atmos. Ocean. 1996; 34(2): 313–343. DOI: http://dx.doi.org/10.1080/07055900.1996.9649567.
- Nghiem S. V., Hall D. K., Mote T. L., Tedesco M., Albert M. R., co-authors. The extreme melt across the Greenland ice sheet in 2012. Geophys. Res. Lett. 2012; 39: 20502. DOI: http://dx.doi.org/10.1029/2012GL053611.
- Nghiem S. V., Rigor I. G., Perovich D. K., Clemente-Colón P., Weatherly J. W., co-authors. Rapid reduction of Arctic perennial sea ice. Geophys. Res. Lett. 2007; 34: 19504. DOI: http://dx.doi.org/10.1029/2007GL031138.
- Noël B., Fettweis X., Van De Berg W. J., Van Den Broeke M. R., Erpicum M. Sensitivity of Greenland ice sheet surface mass balance to perturbations in sea surface temperature and sea ice cover: a study with the regional climate model MAR. Cryosphere. 2014; 8: 1871–1883. DOI: http://dx.doi.org/10.5194/tc-8-1871-2014.
- Ogi M., Rigor I. G. Trends in Arctic sea ice and the role of atmospheric circulation. Atmos. Sci. Lett. 2013; 14: 97–101. DOI: http://dx.doi.org/10.1002/asl2.423.
- Ogi M., Rigor I. G., McPhee M. G., Wallace J. M. Summer retreat of Arctic sea ice: role of summer winds. Geophys. Res. Lett. 2008; 35: L24701. DOI: http://dx.doi.org/10.1029/2008GL035672.
- Ogi M., Rysgaard S., Barber D. G. Importance of combined winter and summer Arctic Oscillation (AO) on September sea ice extent. Environ. Res. Lett. 2016; 11: 034019. DOI: http://dx.doi.org/10.1088/1748-9326/11/3/034019.
- Ogi M., Wallace J. M. Summer minimum Arctic sea ice extent and the associated summer atmospheric circulation. Geophys. Res. Lett. 2007; 34: L12705. DOI: http://dx.doi.org/10.1029/2007GL029897.
- Ogi M., Wallace J. M. The role of summer surface wind anomalies in the summer Arctic sea ice extent in 2010 and 2011. Geophys. Res. Lett. 2012; 39: L09704. DOI: http://dx.doi.org/10.1029/2012GL051330.
- Ogi M., Yamazaki K., Tachibana Y. The summertime annular mode in the Northern Hemisphere and its linkage to the winter mode. J. Geophys. Res. 2004; 109: D20114. DOI: http://dx.doi.org/10.1029/2004JD004514.
- Overland J. E., Francis J. A., Hanna E., Wang M. The recent shift in early summer arctic atmospheric circulation. Geophys. Res. Lett. 2012; 39: L19804. DOI: http://dx.doi.org/10.1029/2012GL053268.
- Overland J. E., Hanna E., Hanssen-Bauer I., Kim S.-J., Walsh J. E., co-authors. Surface Air Temperature. 2015. In Arctic Report Card: Update for 2015. Online at: http://www.arctic.noaa.gov/reportcard/air_temperature.html.
- Parkinson C. L., Comiso J. C. On the 2012 record low Arctic sea ice cover: combined impact of preconditioning and an August storm. Geophys. Res. Lett. 2013; 40: 1356–1361. DOI: http://dx.doi.org/10.1002/grl.50349.
- Parmentier F.-J. W., Christensen T. R., Sørensen L. L., Rysgaard S., McGuire A. D., co-authors. The impact of lower sea-ice extent on Arctic greenhouse-gas exchange. Nat. Clim. Change. 2013; 3: 195–202. DOI: http://dx.doi.org/10.1038/NCLIMATE1784.
- Rajewicz J., Marchall S. J. Variability and trends in anticyclonic circulation over the Greenland ice sheet, 1948–2013. Geophys. Res. Lett. 2014; 41: 2842–2850. DOI: http://dx.doi.org/10.1002/2014GL059255.
- Rayner N. A., Parker D. E., Horton E. B., Folland C. K., Alexander L. V., co-authors. Global analyses of sea surface temperature, sea ice, and night marine air temperature since the late nineteenth century. J. Geophys. Res. 2003; 108(D14): 4407. DOI: http://dx.doi.org/10.1029/2002JD002670.
- Rennermalm A. K., Smith L. C., Stroeve J. C., Chu V. W. Does sea ice influence Greenland ice sheet surface-melt?. Environ. Res. Lett. 2009; 4 024011, DOI: http://dx.doi.org/10.1088/1748-9326/4/2/024011.
- Rignot E., Box J. E., Burgess E., Hanna E. Mass balance of the Greenland ice Sheet from 1958 to 2007. Geophys. Res. Lett. 2008; 35: L20502. DOI: http://dx.doi.org/10.1029/2008GL035417.
- Rysgaard S., Bendtsen J., Delille B., Dieckmann G. S., Glud R. N., co-authors. Sea ice contribution to the air-sea CO2 exchange in the Arctic and southern oceans. Tellus B. 2011; 63: 823–830. DOI: http://dx.doi.org/10.1111/j.1600-0889.2011.00571.x.
- Screen J. A., Simmonds I. Increasing fall-winter energy loss from the Arctic Ocean and its role in Arctic temperature amplification. Geophys. Res. Lett. 2010; 37: L16707. DOI: http://dx.doi.org/10.1029/2010GL044136.
- Serreze M. C. , Barrett A. P. , Stroeve J. , Kindig D. N. , Holland M. M . The emergence of surface-based Arctic amplification. Cryosphere. 2009; 3: 11–19.
- Serreze M. C., Francis J. A. The Arctic amplification debate. Clim. Change. 2006; 76: 241–264. DOI: http://dx.doi.org/10.1007/s10584-005-9017-y.
- Serreze M. C. , Holland M. M. , Stroeve J . Perspectives on the Arctic's shrinking sea-ice cover. Science. 2007; 315: 1533.
- Strong C. Atmospheric influence on Arctic marginal ice zone position and width in the Atlantic sector, February–April 1979–2010. Clim. Dyn. 2012; 39: 3091–3102. DOI: http://dx.doi.org/10.1007s00382-012-1356-6.
- Tedesco M. , Serreze M. , Fettweis X . Diagnosing the extreme surface melt event over southwestern Greenland in 2007. Cryosphere. 2008; 2: 159–166.
- Thompson D. W. J. , Wallace J. M . The Arctic Oscillation signature in the wintertime geopotential height and temperature fields. Geophys. Res. Lett. 1998; 25: 1297–1300.
- Ukita J., Honda M., Nakamura H., Tachibana Y., Cavalieri D. J., co-authors. Northern Hemisphere sea ice variability: lag structure and its implications. Tellus A. 2007; 59: 261–272. DOI: http://dx.doi.org/10.1111/j.1600-0870.2006.00223.x.
- Van Angelen J. H., Van den Broeke M. R., Wouters B., Lenaerts J. T. M. Contemporary (1960–2012) evolution of the climate and surface mass balance of the Greenland ice sheet. Surv. Geophys. 2014; 33: 1155–1174. DOI: http://dx.doi.org/10.1007/s10712-013-9261-z.
- Walsh J. E. Intensified warming of the Arctic: causes and impacts on middle latitudes. Glob Planet Chang. 2014; 117: 52–63. DOI: http://dx.doi.org/10.1016/j.gloplacha.2014.03.003.
- Wang J., Mysak L. A., Ingram R. G. Interannual variability of sea-ice cover in Hudson bay, Baffin bay and the Labrador sea. Atmos. Ocean. 1994; 32(2): 421–447. DOI: http://dx.doi.org/10.1080/07055900.1994.9649505.
- Yamamoto K., Tachibana T., Honda M., Ukita J. Intra-seasonal relationship between the Northern Hemisphere sea ice variability and the North Atlantic Oscillation. Geophys. Res. Lett. 2006; 33: L14711. DOI: http://dx.doi.org/10.1029/2006GL026286.