
Abstract
It has been hypothesised that the Arctic amplification of temperature changes causes a decrease in the northward temperature gradient in the troposphere, thereby enhancing the oscillation of planetary waves leading to extreme weather in mid-latitudes. To test this hypothesis, we study the response of the atmosphere to Arctic amplification for a projected summer sea-ice-free period using an atmospheric model with prescribed surface boundary conditions from a state-of-the-art Earth system model. Besides a standard global warming simulation, we also conducted a sensitivity experiment with sea ice and sea surface temperature anomalies in the Arctic. We show that when global climate warms, enhancement of the northward heat transport provides the major contribution to decrease the northward temperature gradient in the polar troposphere in cold seasons, causing more oscillation of the planetary waves. However, while Arctic amplification significantly enhances near-surface air temperature in the polar region, it is not large enough to invoke an increased oscillation of the planetary waves.
To access the supplementary material to this article, please see Supplementary files under ‘Article Tools’.
1. Introduction
One of the most outstanding manifestations of climate change over the recent decades is the reduction of sea ice in the Arctic. Satellite observations have shown a rapid decline, particularly in September when the summer sea-ice cover is minimum (Johannessen et al., Citation2004; Kattsov et al., Citation2010; Stroeve et al., Citation2011; Comiso, Citation2012; Overland and Wang, Citation2013; Vihma, Citation2014). September sea-ice extent and area have decreased 8.8 and 10.4% per decade, respectively, since 1978 (Nansen Center Sea Ice Information System, Bergen, Norway, www.arctic-roos.org). There is a general consensus that under the current rate of CO2 increase, the Arctic Ocean will be ice-free during September in the latter half of the 21st century (Johannessen et al., Citation2004; Overland and Wang, Citation2010; Mahlstein and Knutti, Citation2012; Snape and Forster, Citation2014). Observational studies indicate that Arctic surface temperature has increased twice as fast as global average. This phenomenon commonly known as Arctic amplification is mainly associated with global warming in recent decades, primarily caused by the decline of sea ice (Screen et al., Citation2012). Recent studies have also revealed that the Atlantic Multidecadal Oscillation and Pacific Decadal Oscillation can modulate different atmospheric responses to sea-ice decline (Johannessen et al., Citation2016; Screen and Francis, Citation2016). One of the key issues in the current debate is to understand the impact of Arctic amplification on atmospheric circulation and occurrence of extreme weather over Eurasia, Greenland and North America (Budikova, Citation2009; Cohen et al., Citation2014; Vihma, Citation2014; Overland et al., Citation2015). Based on a 30-yr observational record, Francis and Vavrus (Citation2012, Citation2015) hypothesised that Arctic amplification is causing a decrease of northward temperature gradient between the lower latitude and the polar atmosphere, which favours weakening of upper-level, flow, and increased meandering of planetary-scale waves. Then the phase speed of such waves reduces due to their larger amplitudes, resulting in a slowdown of wave propagation and increasing probabilities of extreme weather. If the sea-ice cover continues to decrease as projected, an important question is whether the large-scale circulation patterns in the Northern Hemisphere will become increasingly influenced by Arctic amplification. Although some aspects of the Francis and Vavrus (Citation2012) hypothesis are supported, the impact of Arctic amplification on the decrease of northward temperature gradient and associated growth of the planetary wave oscillation remains controversial and requires further investigation (Honda et al., Citation2009: Screen et al., Citation2012; Barnes, Citation2013; Mori et al., Citation2014). The quantitative cause-and-effect linkage between Arctic change and mid-latitude weather cannot be resolved within the foreseeable future based on the limited observational record (Overland et al., Citation2015); therefore, numerical modelling is a way forward.
The goal of our modelling study is to determine the response of the polar and mid-latitude atmosphere to anthropogenic warming when a sea-ice-free state is projected to occur in the Arctic. The focus is on assessing the contribution of Arctic amplification and northward heat transport to changes of atmospheric variability to answer the debated question: Is the Arctic amplification forcing large enough to decrease the northward temperature gradient and to enhance the oscillation of planetary-scale waves and to impact regional atmospheric circulation including extreme weather in the future? In our study, we compare a projected sea-ice-free period in summer with the present condition in the Arctic, because interaction processes between the Arctic Ocean and atmosphere will be significantly enhanced during sea-ice-free conditions.
2. Methods: experimental design
To investigate the response of the atmosphere to projected changes of sea-ice concentration (SIC), sea-ice thickness (SIT) and sea-surface temperature (SST), we utilised an atmospheric general circulation model with the prescribed boundary conditions at the ocean surface. The atmospheric model (MGO-3, T63L25) was developed at Voeikov Main Geophysical Observatory. A short outline of parameterisation of physical processes used in the model, and its use in weather prediction is provided in the Supplementary File. Boundary conditions at the ocean surface were selected from the Coupled Model Intercomparison Project (CMIP5), which runs with the requirements that the coupled model should properly simulate the annual cycle of Arctic SIC, SIT and SST for the 1979–2012 period (Supplementary Figs. 1–3). In our study, time-varying monthly SIC, SIT and SST were selected from the Max Plank Institute for Meteorology Earth System Model (MPI ESM MR), which satisfies these requirements.
According to the MPI ESM MR climate simulations with forcing scenario RCP8.5, the Arctic SIC will persistently be absent in September 2070–2079, which was therefore designated as the sea-ice-free period. Three sets of ensemble simulations with the atmospheric model were conducted using different surface ocean boundary conditions: (1) Climate simulation for the control period (1980–1989) with prescribed time-varying distribution of SIC, SIT and SST and observed CO2 concentration in the atmosphere, (2) Climate simulation of the sea-ice-free period (2070–2079) with prescribed time-varying distribution of SIC, SIT and SST using forcing scenario RCP8.5, and (3) Climate simulation with prescribed time-varying SST in extra-polar oceans in the control period (1980–1989) and time-varying SIC, SIT and SST in the polar region for the sea-ice-free period (2070–2079). It is important to note that SIC/SIT/SST changes in the polar region are integrated parts of global climate warming. Therefore, the purpose of the third climate simulation is to quantify the response of the atmosphere to regional forcing that we consider as analogous to Arctic amplification forcing.
The ensemble of experiments started from a random initial state of the atmosphere and following initialisation of the atmosphere to the prescribed boundary condition. The difference between the sea-ice-free and control climates will be termed as climate change due to global forcing, or GLB simulation. Differences between simulation with SIC/SIT/SST anomalies in the polar region and simulation of control climate will be termed as climate change due to polar forcing, or POL simulation that represents the Arctic amplification. In order to detect and quantify the potential response of the atmospheric variability to different boundary conditions that may be masked by large internal variability in high latitudes, we conducted 30 experiments of 10-yr duration for all three sets of simulation, thus providing 300 samples for analysis of monthly and seasonal changes. Statistical significance of the atmospheric response was estimated using unpaired t-test with level of confidence 95% (α=0.05).
3. Arctic amplification and its impact on the polar atmosphere
Observational studies have indicated that annual near-surface air temperature poleward 60°N increased at twice the rate of the Northern Hemisphere warming during 1979–2008 (Bekryaev et al., Citation2010) and further increased Arctic amplification is evident in the most recent data analysed through 2014 (Johannessen et al., Citation2016). Arctic amplification is apparent throughout the year, but is manifested most strongly in autumn and winter. The spatial structure of Arctic amplification due to sea-ice loss is strongly determined by the specific structure of sea-ice loss pattern (Kumar et al., Citation2010; Screen and Simmonds, Citation2010). The questions to be answered are whether Arctic amplification will change with projected sea-ice loss during the 21st century and whether it depends on the strength of anthropogenic forcing scenario. We find that the seasonal and annual values of Arctic amplification do not show notable dependence on the projected sea-ice extent at least for the 21st century (Supplementary Fig. 4).
In the GLB simulations, the annual global warming for the sea-ice-free period with respect to the control run is +3.0 °C, moderately greater in winter (+3.2 °C) and less in summer (+2.7 °C). Annual warming over the Arctic Ocean and adjacent land (60–90°N) amounts to +6.6 °C with the largest warming in autumn (+7.0 °C) and winter (+10.7 °C) (a). This implies that the annual Arctic amplification, here defined as the ratio of the surface air temperature trend over the polar region (60–90°N) to global trend, is 2.2. In autumn, amplification is close to the annual value 2.3, and in winter, amplification is usually much stronger than the annual value 3.4 (Supplementary Fig. 2).
Fig. 1 Surface warming in polar region due to different climate forcings. Change of surface air temperature (°C) in autumn and winter for a sea-ice-free period relative to control climate computed with (a) global (GLB) and (b) polar forcing (POL). Stippled areas represent statistically significant changes with confidence level 95%.
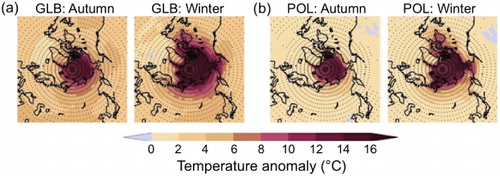
In the POL simulation with prescribed SIC/SIT/SST anomalies in the Arctic Ocean, annual warming over the polar region (60–90°N) is +4.5 °C, which is just 68% as large as the warming over the same region in the GLB simulation. Although the size and strength of prescribed SIC/SIT/SST anomalies are identical in both the GLB and POL simulations, the response of the surface air temperature in the polar region appears essentially weaker in the POL simulation. This is because the run with global forcing enhances northward heat transport of the global atmosphere, and it provides additional near-surface warming up to +2.1 °C (32%) over the polar region. The warming due to the SIC/SIT/SST anomalies depends on season and amounts to 50% in autumn and 75% in winter relative to the warming in case of global forcing (). Our finding is in qualitative agreement with a similar assessment that was conducted using two atmospheric models forced with the observed evolution of SIC and SST for the period 1979–2008 (Screen et al., Citation2012). The study accounts for roughly 70% of the simulated annual near-surface warming in the region northward 67°N, indicating that the proportion of POL to GBL forcing will be about the same in projected and present climates.
Evidence from observations indicates that total northward heat transport occurs in the whole troposphere throughout the year, and it is most pronounced in the cold season (Peixoto and Oort, Citation1992). The total heat transport comprises sensible and latent heat, and the latent heat is more than an order of magnitude less than sensible heat. For comparison purposes, we evaluate meridional heat transports in the control run (). Computation shows that in the mid-troposphere, the total northward heat transport across 60°N latitude amounts to about 4.2×10¹⁴ W during autumn and winter. In the lower troposphere, northward heat transport appears to be larger, and it amounts to 6.2×10¹⁴ W and 1.0×10¹⁵ W in autumn and winter, respectively. In the control period, about 90% of total heat is transported across 60°N by stationary eddies (c) and transient eddies (b), and the remainder by mean meridional circulation (d). Furthermore, heat transport by transient eddies exceeds transport by stationary eddies by a factor of two over the whole troposphere in autumn, while both meridional fluxes have about the similar strength in winter. In the GLB simulation (, left), the change of northward transport of sensible heat shows that its largest increase takes place in the mid-troposphere centred at 500 hPa in autumn and winter (a). In contrast, strong southward increase of heat transport was also originated in the lower troposphere from the Arctic Ocean causing a reduction of northward heat transport – such a finding has not been reported before. To get a better understanding of the physical mechanisms involved in enhancement of the zonally averaged meridional transport of sensible heat, we decomposed the change of its total transport into the contribution of three components (Peixoto and Oort, Citation1992): heat transport by transient eddies (b), large-scale stationary eddies (c) and mean meridional circulation (d). Further, we computed zonally averaged heat transport across 60°N latitude of 200 hPa deep-layer centred at 500 and at 850 hPa, which we consider as characteristic meridional heat fluxes in the mid and lower troposphere. In the following, the heat transport change within these limits implies its value relative to that in the control climate.
Fig. 2 Meridional heat transport by the atmosphere in control-run climate. Seasonal zonally averaged transport of sensible heat (°C·m·s−1) from 40 to 90°N computed in an atmospheric model with prescribed SIC, SIT and SST for the control period (1980–1989). Here the total heat transport (a) is decomposed into transport by transient eddies (b), large-scale stationary eddies (c) and mean meridional circulation (d). Northward transport is positive, and southward is negative. Stippled areas indicate that the absolute value of the transport is larger than its SD.
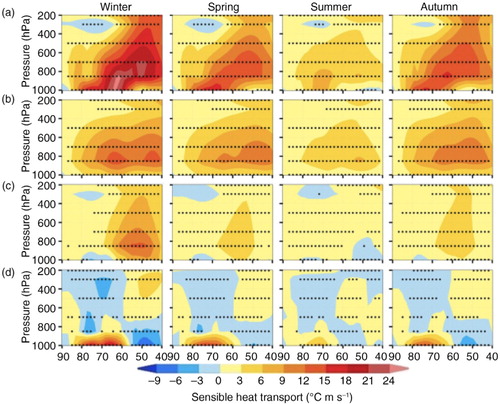
Fig. 3 Enhancement of northward heat transport. Change of zonally averaged meridional transport of sensible heat (°C·m·s−1) in autumn and winter from 40 to 90°N during the sea-ice-free period relative to control climate computed with global (GLB) and polar (POL) forcings. The total heat transport (a) is decomposed into transport by transient eddies (b), large-scale stationary eddies (c) and the mean meridional circulation (d). Northward transport is positive and southward is negative. Stippled areas represent statistically significant changes with confidence level 95%. Note that the colour scale is different than in .
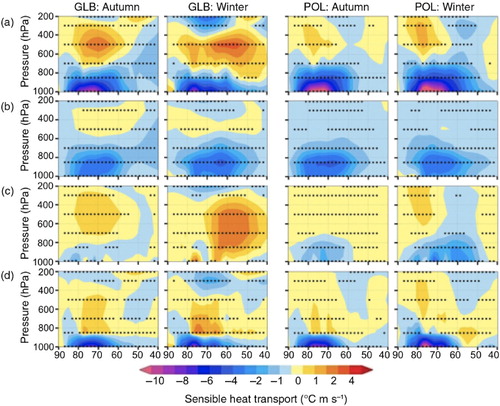
In the case of the GLB forcing, total northward heat transport across 60°N latitude in autumn increases by 0.4×10¹⁴ W (10%) in the mid-troposphere compared to the control climate (a). Two-thirds of the transport comes from stationary eddies and one-third from transient eddies. In winter, the total northward heat transport increases by about 0.9×10¹⁴ W (22%), and it is mainly due to the impact of stationary eddies (c). In contrast, total northward heat transport in the lower troposphere across 60°N latitude decreases by about 0.7×10¹⁴ W (12%) in autumn and by 0.6×10¹⁴ W (6%) in winter compared to the control climate. This is due to warming of the Arctic Ocean and enhancement of southward heat transport from the warmer Arctic Ocean to the continents. The main contribution to the decrease of northward heat transport is provided by transient eddies (b). In the POL simulation (, right), there is no increase of northward heat transport in the mid-troposphere. However, enhancement of the southward heat transport in the lower troposphere associated with transient eddies remains about the same strength in both the GLB and POL simulations, thereby indicating that the main driver changing the heat transport is Arctic amplification.
In the GLB simulation (a, left), large warming occurs from the surface boundary layer up to 500–600 hPa in autumn and winter. A significant increase of air temperature (T) also occurs in the whole troposphere throughout the year. However, the POL simulation (a, right) shows weaker and shallow warming over the polar region. Its vertical propagation is restricted to the lower troposphere, and this is due to no enhanced northward heat transport in the troposphere.
Fig. 4 Changes in the polar troposphere due to different climate forcings. Change of zonally averaged: (a) air temperature (°C) and (b) geopotential height (m) in autumn and winter from 40 to 90°N during the sea-ice-free period relative to control climate computed with global (GLB) and polar (POL) forcings. Stippled areas represent statistically significant changes with confidence level 95%.
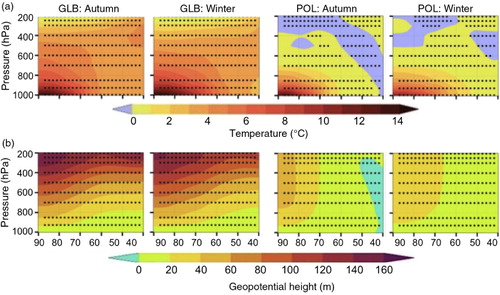
Several diagnostic studies have indicated that the Geopotential Height (GPH) has increased with height in the polar troposphere in recent decades (Overland and Wang, Citation2010; Francis and Vavrus, Citation2012) and that this has been attributed to Arctic amplification. Large GPH increase with height caused by the decrease of the northward temperature gradient in the troposphere is also produced in the GLB simulation (b, left) in high latitudes. But when only Arctic amplification forcing is considered in the POL simulation, the GPH increase is very small and nearly constant with height across the troposphere, in contrast with the GLB simulation. For example, changes of 500–1000 hPa thickness in the GLB (POL) simulation are 78±9 m (20±7 m) in autumn and 82±17 m (23±11 m) in winter. Our results are consistent with recent studies (Deser et al., Citation2015; Perlwitz et al., Citation2015) in which impact of observed and projected sea ice loss on temperature and GPH in the low and upper polar troposphere was also evaluated. However, our study shows more pronounced quantitative impact since evaluation was made for seasons with largest response during summer sea-ice-free period. Therefore, we conclude from and that the increase of GPH with height is associated mainly with enhancement of northward heat transport in the mid-troposphere, and that the main mechanism providing enhancement of this transport is global warming, not Arctic amplification. Arctic amplification provides only a minor contribution to the increase of GPH and decrease of air temperature gradient in the mid-troposphere. This is because the amplification is not strong enough, as its forcing is confined to a shallow layer of the lower troposphere.
We also compared changes of zonally averaged air temperature gradient at 850 and 300 hPa in the latitudinal zone 50–80°N from the GLB and POL simulations. It is apparent that the decrease of temperature gradient at 300 hPa is several times larger in GLB while its decrease at 850 hPa does not differ substantially in both simulations. Our results disagree with the earlier suggested hypothesis (Francis and Vavrus, Citation2012, Citation2015) claiming that the Arctic amplification plays the dominant role in the decrease of northward temperature gradient and the increase of GPH with height in the polar troposphere thereby impacting the polar jet stream.
4. Temperature variability in the Northern Hemisphere for an ice-free Arctic Ocean
Our atmospheric model can capture the large-scale patterns of observed T and GPH subseasonal variability in the Northern Hemisphere, although their strength appears to be underestimated compared with observations (Kiktev et al., Citation2011) – a problem that is common to many climate models and depends mainly on model resolution. However, we find it useful to examine how subseasonal variability of T and GPH will change for a sea-ice-free period and what impact it might have on atmospheric circulation. Subseasonal variability is determined as root mean square deviation of daily T and GPH from daily multiyear means. Monthly variability was computed from above mentioned three sets of experiments, and seasonal changes were defined from monthly distributions. We expect that the size of the ensemble experiments is large enough to detect robust response of the atmospheric circulation variability against background natural variability in high latitudes. For example, it was shown that an ensemble size of at least about 50 members is desirable to detect a significant thermo-dynamical response of atmospheric circulation to Arctic sea ice loss (Screen et al., Citation2014), and we used 300 samples in assessment of response.
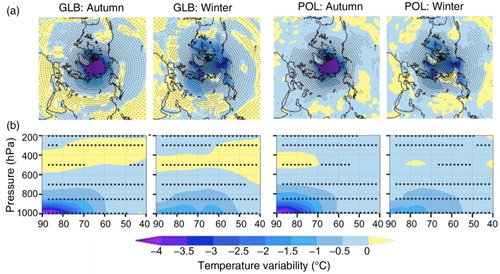
The GLB and POL simulations show a statistically significant decrease of T variability in the cold seasons in both the high- and mid-latitudes (a). The patterns are similar in both the simulations, and its magnitude is largest over the Arctic Ocean. Vertical propagation of T variability is very similar to the extent of the warming in low troposphere in the case of the POL simulation (a and b). This phenomenon is strongly associated with the influence of ocean. When the ice-free area expands, the Arctic Ocean begins to play a role of a large polar thermostat. Due to the ocean's enormous heat capacity and strong heat exchange with the atmosphere in cold seasons, air masses in the lower troposphere are well mixed and become thermally more homogeneous in space and time. The area of reduced T variability further expands to continents due to advection. The most pronounced decrease of near-surface air temperature variability occurs over area 60–90°N in autumn (−46%) and in winter (−24%) compared to that in control run when most of the Arctic Ocean is exposed to strong heat interaction with the lower troposphere. A larger decrease of T variability occurs in autumn because a larger area of open ocean is exposed to the atmosphere, and this is in qualitative agreement with similar results obtained from observations and recent simulation (Screen, Citation2014; Blackport and Kushner, Citation2016). In the GLB simulation, a statistically significant increase of T variability is also observed in the mid-troposphere throughout the year, which apparently is associated with the enhancement of northward heat transport by large-scale eddies, as indicated before. Furthermore, some increase in variability of T can also be generated in the lower troposphere due to natural subseasonal and interannual variability of sea-ice extent in the Arctic Ocean and adjacent seas. Thus, there are two manifestations of temperature changes in the lower troposphere over the Arctic Ocean and adjacent continents in cold seasons: (1) warming amplification, and (2) variability decrease, which does not depend on Arctic amplification, but strongly depends on the area of open water in the Arctic Ocean and the season.
Fig. 5 Change of air temperature in the polar atmosphere. Change of subseasonal variability of: (a) near-surface air temperature (°C) and (b) seasonally averaged air temperature from 40 to 90°N. Both plots represent the sea-ice-free period relative to control climate in autumn and winter, computed with GLB and POL forcing. Stippled areas represent statistically significant changes with confidence level 95%.
5. Planetary-scale wave changes for an ice-free Arctic Ocean
To detect and quantify the response of atmospheric circulation patterns including planetary-scale waves to global and polar forcing, we examined the spatial distribution of GPH variability change in the troposphere on the assumption that it generally represents statistics about position and evolution of large-scale oscillation of quasi-stationary eddies and planetary-scale waves, including statistics of cyclone tracks. When regional GPH variability increases in the troposphere, the oscillation of planetary waves and the occurrence of moving cyclones will increase. However, when GPH variability decreases, quasi-stationary circulation patterns reinforce and this might promote initiation of anomalous weather regimes in winter.
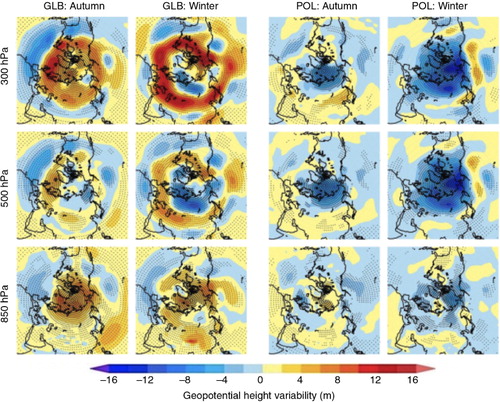
In the GLB simulation, large GPH variability develops in the 200–400 hPa (where the largest decrease of temperature gradient occurs) around the pole mainly in high and mid-latitudes in autumn (). In winter, a well-shaped belt of high variability propagates downward to 500 hPa where its strength gradually decays with appropriate decrease of temperature gradient change (). On the other hand, an extensive pattern with lower GPH variability develops over Eurasia, the western part of Arctic Ocean and Greenland in winter, and its strength is most pronounced at 500 hPa. This implies that depending on the position and intensity of particular circulation patterns, a decrease of GPH variability will favour reinforcement of anticyclonic pattern, such as in Northern Eurasia, or decay of cyclonic activity. Lastly, a pervasive pattern of increased GPH variability also forms at 850 hPa over the polar region and partly mid-latitudes. Such an increase appears to be supported with the enhancement of northward heat transport by large-scale stationary eddies and mean meridional circulation in the lower troposphere (). It also appears that in case of GLB simulation enhancement of northward heat transport produces larger influence on GPH variability than decrease of temperature variability in the lower troposphere.
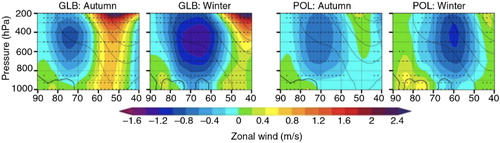
In the GLB simulation, the zonally averaged zonal wind decreases in the latitudinal belt of 60–80°N throughout the troposphere with a maximum in the mid-troposphere (). The zonal wind decrease is statistically significant and is qualitatively consistent with some recent observational and simulation studies using atmospheric and coupled models (Francis and Vavrus, Citation2012; Deser et al., Citation2015; Blackport and Kushner, Citation2016). As noted when considering GPH change, the response of zonal wind also turns out to be more pronounced in our study than in Deser et al. (Citation2015) and Blackport and Kushner (Citation2016). The larger decrease of zonal wind occurs in winter and expands further northward in the upper troposphere thereby indicating that the polar vortex might become weaker.
Fig. 6 Zonal-wind evolution. Change of zonally averaged zonal wind (m·s−1) in autumn and winter during the sea-ice-free period relative to control climate computed with global and polar forcings. Contours indicate the zonal wind (contour interval of 5 m·s−1, zero contour thickened) distributions from the control run. Stippled areas indicate statistically significant changes with confidence level 95%.
In the POL simulation, the response of GPH variability to SIC/SST anomaly forcing appears to be entirely different (). Oscillation of well-marked planetary waves does not develop in the troposphere, and GPH variability decreases over the whole polar region (60–90°N) and northern Eurasia in winter. It is important to note that the SIC/SST anomaly in the Arctic Ocean and associated decrease of temperature variability in the lower troposphere meaningfully contribute to low GPH variability in the upper and mid-troposphere, which in turn might favour amplification of the polar vortex.
Fig. 7 Oscillation of planetary waves and climate forcing. Change of subseasonal GPH variability (m) at three levels of the troposphere in autumn and winter during the sea-ice-free period relative to control climate computed with global (GLB) and polar (POL) forcing. Stippled areas represent statistically significant changes with confidence level 95%.
Statistically significant weakening of zonal wind is also observed in the POL simulation but to a lesser extent than in the GLB simulation. This implies that such a decrease of zonal wind is presumably associated with a decrease of northward temperature gradient in the troposphere due to sea ice reduction, but it is not adequate to initiate planetary wave oscillation.
To further quantify regional/height changes of GPH variability and compare them with reference variability in the control period, we introduce a GPH variability index (GVI). The index was computed at 300, 500 and 850 hPa surfaces in polar region (60–90°N) and mid-latitudes (40–60°N) for domains with a statistically significant increase (GVI+) and decrease (GVI−) of GPH variability (Supplementary Figs. 6 and 7). GVI+ and GVI− describe the integrated enhancement or decay of GPH variability (in percent) in circulation patterns relative to reference variability in polar region (60–90°N) and mid-latitudes (40–60°N). Seasonal assessment of GVI in the climate simulations using the GLB and POL forcings indicates the following:
In the global warming, enhancement of variability occurred in the upper and lower polar troposphere (60–90°N), and GVI+ amounts to 9% at 850 hPa surface in autumn. In part this was because internal GPH variability was about half as much of variability in the upper troposphere in cold seasons. It also appears that the decrease of temperature variability did not have a marked impact on GPH variability in the lower troposphere. On the other hand, the major contribution to negative value of GVI− in the mid-troposphere was made by the large-scale pattern of decreased variability extending across Northern Eurasia to Greenland.
In the GLB warming, prominent growth of variability (up to 7%) occurred throughout the troposphere in winter, due to enhancement of the planetary wave oscillation in the mid-latitudes (40–60°N).
In case of the polar anomaly forcing, GPH variability reduced primarily in the polar and mid-latitude troposphere, and its largest decrease (up to 10%) took place in the polar troposphere during winter.
Analysis of observation and model simulations has revealed that northward temperature gradient decreases and jet flow weakens in the polar troposphere due to global climate warming. These interdependent phenomena are regarded as robust features of the climate system. An increase of planetary wave oscillation that is attributed to Arctic amplification (Francis and Vavrus, Citation2012; Francis and Vavrus, Citation2015) has not been confirmed from analysis of observation (Barnes, Citation2013; Screen and Simmonds, Citation2013) or in our analysis of model simulations of projected climate. However, we found that GPH variability associated with planetary wave oscillation increases in the background of weakening of zonal flow during the sea-ice-free summer. Enhancement of northward heat transport in the troposphere was shown to be the main factor responsible for decrease of northward temperature gradient and weakening of the jet stream in autumn and winter. Arctic amplification provides only minor contribution to the evolution of zonal flow and planetary wave oscillation. In the meantime, the mechanisms responsible for the increase of wave oscillation under weakening of zonal flow remain unclear at present, and this is a challenge for further study.
6. Conclusions
In conclusion, our study did not detect an impact of the inherent Arctic amplification on planetary wave oscillation in the troposphere of the mid-latitudes during the cold seasons. Rather, the oscillation of planetary waves developed and became a well-organised belt in upper and mid-troposphere mainly by the influence of global warming which was the major driver for enhancement of the northward heat transport, decrease of meridional temperature gradient and subsequent increase of planetary wave oscillation in the upper troposphere. However, because meridional temperature gradient growth decreased from upper troposphere downward, the oscillation belt did not propagate below 500 hPa, and it appeared as disintegrated patterns of less strength. In other words, we also did not reveal any organised oscillation of planetary waves in the lower troposphere in autumn and winter due to Arctic amplification.
Within this framework, it is worth mentioning an early study (Newson, Citation1973) in which response of the atmosphere to prescribed sea-ice-free anomaly was considered in the Arctic Ocean. The open water was maintained at freezing temperature during a persistent winter. Atmospheric simulation with such strong boundary forcing revealed that, apart from a significant increase of near-surface temperature over the Arctic Ocean, extensive cooling areas developed stretching across the whole Eurasia and North America. These looked like extreme weather patterns occurring occasionally in the mid-latitudes. However, we believe that experimental design and associated boundary forcing from the Arctic Ocean appear to be far from reality.
In our study, we have quantified the relative contribution of Arctic amplification and northward heat transport in the troposphere to changes of the zonally averaged meridional temperature gradient and oscillation of planetary-scale waves in a projected summer sea-ice- free climate. It has been shown that northward heat transport is the major factor in decreasing the northward temperature gradient in the polar atmosphere and increasing the planetary-scale wave oscillation in the troposphere of the mid-latitudes. Arctic amplification does not show any essential impact on planetary-scale oscillation in the mid and upper troposphere, although it does cause a decrease of northward heat transport in the lower troposphere. These results confound the interpretation of the short observational record that has suggested a causal link between recent Arctic melting and extreme weather in the mid-latitudes.
Supplementary Material
Download PDF (1.6 MB)7. Acknowledgements
This work has been supported by the joint Russian–Norwegian projects NORRUS-CLIMARC (225032) and RFBR (12-05-93092 Norv_a). The research is also funded by project RFBR (15-06- 08163 a). We acknowledge the World Climate Research Programme's Working Group on Coupled Modelling, which is responsible for CMIP, and we thank the climate modelling groups for producing and making available their model output. For CMIP the U.S. Department of Energy's Program for Climate Model Diagnosis and Intercomparison provides coordinating support and led development of software infrastructure in partnership with the Global Organization for Earth System Science Portals. We also thank Dr. Martin Miles for editing the article.
Notes
To access the supplementary material to this article, please see Supplementary files under ‘Article Tools’.
Related Research Data
References
- Barnes E. A. Revisiting the evidence linking Arctic amplification to extreme weather in midlatitudes. Geophys. Res. Lett. 2013; 40: 4734–4739. DOI: http://dx.doi.org/10.1002/grl.50880.
- Bekryaev R. V. , Polyakov I. V. , Alexeev V. A . Role of polar amplification in long-term surface air temperature variation and modern arctic warming. J. Clim. 2010; 23: 3888–3906.
- Blackport R. , Kushner P. J . The transient and equilibrium climate response to rapid summertime sea ice loss in CCSM4. J. Clim. 2016; 29: 401–417.
- Budikova D . Role of Arctic sea ice in global atmospheric circulation: a review. Global Planet, Change. 2009; 68: 149–163.
- Cohen J. , Screen J. A. , Furtado J. C. , Barlow M. , Whittleston D. , co-authors . Recent Arctic amplification and extreme mid-latitude weather. Nat. Geosci. 2014; 7: 627–637.
- Comiso J. C . Large decadal decline of the Arctic multiyear ice cover. J. Clim. 2012; 25: 1176–1193.
- Deser C. , Tomas R. A. , Sun L . The role of ocean–atmosphere coupling in the zonal-mean atmospheric response to Arctic sea ice loss. J. Clim. 2015; 28: 2168–2186.
- Francis J. A. , Vavrus S. J . Evidence linking Arctic amplification to extreme weather in mid-latitudes. Geophys. Res. Lett. 2012; 39: L06801.
- Francis J. A. , Vavrus S. J . Evidence for a wavier jet stream in response to rapid Arctic warming. Environ. Res. Lett. 2015; 10: 014005.
- Honda M. , Inue J. , Yamane S . Influence of low Arctic sea-ice minima on anomalously cold Eurasian winters. Geophys. Res. Lett. 2009; 36: L08707.
- Johannessen O. M. , Bengtsson L. , Miles M. W. , Kuzmina S. , Semenov V. A. , co-authors . Arctic climate change: observed and modeled temperature and sea-ice variability. Tellus A. 2004; 56: 328–341.
- Johannessen O. M. , Kuzmina S. , Bobylev L. P. , Miles M. W . Surface air temperature variability and trends in the Arctic: new amplification assessment and regionalization. Tellus A. 2016; 68: 28234.
- Kattsov V. M. , Ryabinin V. E. , Overland J. E. , Serreze M. C. , Visbeck M. , co-authors . Arctic sea-ice change: a grand challenge of climate science. J. Glaciol. 2010; 56: 1115–1121.
- Kiktev D. B., Tolstyh M. A., Zaripov R. B., Zaichenko M. Y., Muravyev A. V., co-authors. Joint test of seasonal prediction technology using global atmospheric models of Russian Hydrometcenter and MGO. Digest on Testing of New Technologies of Hydrometeorological Forecasts. 2011; 38: 4–13. (In Russian, Online at: http://elibrary.ru/item.asp?id=17258831; http://method.meteorf.ru/publ/sb/sb38/kiktev.pdf).
- Kumar A. , Perlwitz J. , Eischeid J. , Quan X. , Xu T. , co-authors . Contribution of sea ice loss to Arctic amplification. Geophys. Res. Lett. 2010; 37 L211701.
- Mahlstein I. , Knutti R . September Arctic sea ice predicted to disappear near 2 °C global warming above present. J. Geophys. Res. 2012; 117: D06104.
- Mori M. , Watanabe M. , Shiogama H. , Inoue J. , Kimoto M . Robust Arctic sea-ice influence on the frequent Eurasian cold winters in past decades. Nat. Geosci. 2014; 7: 869–873.
- Nansen Center Sea Ice Information System, Bergen, Norway. Online at: http://www.arctic-roos.org.
- Newson R. L . Response of a general circulation model of the atmosphere to removal of the Arctic ice-cap. Nature. 1973; 241: 39–40.
- Overland J. E. , Francis J. , Hall R. , Hanna E. , Ki S.-J. , co-authors . The melting Arctic and mid-latitude weather patterns: are they connected?. J. Clim. 2015; 28: 7917–7932.
- Overland J. E. , Wang M . Large-scale atmospheric circulation changes are associated with the recent loss of Arctic sea ice. Tellus A. 2010; 62: 1–9.
- Overland J. E., Wang M. When will the summer Arctic be nearly sea ice free?. Geophys. Res. Lett. 2013; 40: 2097–2101. DOI: http://dx.doi.org/10.1002/grl.50316.
- Peixoto J. P. , Oort A. H . Physics of Climate. 1992; American Institute of Physics: New York.
- Perlwitz J. , Hoerling M. , Dole R . Arctic tropospheric warming: causes and linkages to lower latitudes. J. Clim. 2015; 28: 2154–2167.
- Screen J. A . Arctic amplification decreases temperature variance in northern mid- to high-latitudes. Nat. Clim. Change. 2014; 4: 577–582.
- Screen J. A. , Deser C. , Simmonds I . Local and remote controls on observed Arctic warming. Geophys. Res. Lett. 2012; 39: L10709.
- Screen J. A. , Deser C. , Simmonds I. , Tomas R . Atmospheric impacts of Arctic sea-ice loss, 1979–2009: separating forced change from atmospheric internal variability. Clim. Dyn. 2014; 43: 333–344.
- Screen J. A., Francis J. A. Contribution of sea-ice loss to Arctic amplification is regulated by Pacific Ocean decadal variability. Nat. Clim. Change. 2016; 6: 856–860. DOI: http://dx.doi.org/10.1038/nclimate3011.
- Screen J. A. , Simmonds I . Increasing fall–winter energy loss from the Arctic Ocean and its role in Arctic amplification. Geophys. Res. Lett. 2010; 37: L16707.
- Screen J. A. , Simmonds I . Exploring links between Arctic amplification and mid-latitude weather. Geophys. Res. Lett. 2013; 40: 959–964.
- Snape T. J. , Forster P. M . Decline of Arctic sea ice: evaluation and weighting of CMIP5 projection. J. Geophys. Res. 2014; 119: 546–554.
- Stroeve J. , Holland M. , Kay J. , Maslanik J. , Barrett A . The Arctic's rapidly shrinking sea ice cover: a research synthesis. Clim. Change. 2011; 110: 1005–1027.
- Vihma T . Effects of arctic sea ice decline on weather and climate: a review. Surv. Geophys. 2014; 35: 1175–1214.