ABSTRACT
Enhancement of number concentrations of particles with sizes less than 25 nm diameter has been frequently observed in the boundary layer over the central Arctic Ocean during summer. The sectional aerosol dynamics model for Marine Aerosol Formation (MAFOR) was applied to evaluate the capability of different nucleation mechanisms to reproduce nucleation events observed during three expeditions (1996, 2001 and 2008) onboard the Swedish icebreaker Oden. Model calculations suggest that a source rate of a condensable organic vapour (OV) of about 2×105 cm−3 s−1 is required to reproduce observed growth of nucleation mode particles. Nucleation rates predicted by the newly proposed combined sulphuric acid nucleation mechanism, which best described new particle formation in the Arctic, ranged from 0.04 to 0.1 cm−3 s−1. This mechanism additively combines ion-mediated nucleation and cluster activation, and treats condensation of OV without correction of the Kelvin effect. In several events, the simultaneous number enhancement of particles in the 20–50 nm size range remained unexplained by the nucleation mechanisms. This lends support to alternative theories such as the fragmentation of marine gels (≈200–500 nm diameter in size) by physical or chemical processes.
1. Introduction
New particle formation, that is, nucleation of (typically low-volatile) atmospheric gases followed by growth of the nucleated particles to detectable sizes (>3 nm diameter), has been observed worldwide in the atmospheric boundary layer over continents and oceans (Kulmala et al., Citation2004a; O'Dowd and de Leeuw, Citation2007; Kulmala and Kerminen, Citation2008). While there are frequent observations of nucleation events in the continental boundary layer (Kulmala et al., Citation2004a), particles with sizes less than 25 nm diameter are rarely observed over remote oceans of temperate and tropic climates (Katoshevski et al., Citation1999; Heintzenberg et al., Citation2004). In contrast to the warmer oceans, new particle formation events in the marine boundary layer (MBL) of the central Arctic Ocean are relatively common during summer (Wiedensohler et al., Citation1996; Leck and Bigg, Citation1999; Vaattovaara et al., Citation2009; Leck and Bigg, Citation2010).
It is generally accepted that secondary production of new atmospheric particles occurs via two – probably decoupled – processes: (1) the nucleation of stable atmospheric clusters (<3 nm diameter); and (2) the growth or activation of these clusters into observable aerosol particles (Kulmala et al., Citation2000, Citation2004c). The second process is likely driven by condensation of vapours but may also be affected by self-coagulation of the freshly formed clusters (Anttila et al., Citation2004), electrostatic forces in the presence of ions (Yu and Turco, Citation2001; Laakso et al., Citation2003) and/or heterogeneous reaction on the cluster surface (Zhang and Wexler, Citation2002). While there currently exists no single nucleation mechanism which is capable of explaining atmospheric new particle formation in all locations (Kulmala, Citation2003), recently developed parameterisations based on power-law dependence of the nucleation rate on the concentration of sulphuric acid (H2SO4) and/or the concentration of low-volatile organic compounds (Kulmala et al., Citation2006; Paasonen et al., Citation2010) are able to reproduce the magnitude of observed atmospheric nucleation rates in the atmospheric boundary layer. Over continental regions, reliable nucleation routes have been established: homogeneous binary H2SO4−H2O nucleation occurs in industrial plumes (Kerminen and Wexler, Citation1996), ternary H2SO4−H2O-ammonia (NH3) nucleation can explain new particle formation in the polluted boundary layer (Merikanto et al., Citation2007), ion-induced (or ion-mediated) nucleation is suggested to be important in the upper troposphere/lower stratosphere (Kulmala et al., Citation2010) and homogeneous nucleation of iodine compounds occurs in coastal environments (Saiz-Lopez et al., Citation2006). However, much less is known about the nucleation mechanisms that are operative in the MBL over remote oceans (Pirjola et al., Citation2000).
It is known that H2SO4 has an extremely low vapour pressure under atmospheric conditions and is typically considered to play a key role in nucleation (Kulmala et al., Citation2004a). Several observations (Shaw, Citation1989; Ferek et al., Citation1995; Weber et al., Citation1995, Citation1998; Clarke et al., Citation1998) have linked nucleation events in the MBL to sulphuric acid formed in the oxidation of dimethyl sulphide (DMS) which is product of phytoplankton primary productivity (Leck et al., Citation1990; Leck and Persson, Citation1996) in the upper ocean surface. However, only under certain circumstances, e.g. in highly humid air at the edges of evaporating clouds over the biologically productive part of the equatorial ocean, measured H2SO4 concentrations were sufficient to explain observed nucleation events on the basis of classical binary H2SO4−H2O nucleation (Clarke et al., Citation1999). Observations in the MBL suggest that a yet unknown, likely organic, vapour is responsible for the subsequent growth of nucleated particles (e.g. Weber et al., Citation1998; O'Dowd et al., Citation1999; Pirjola et al., Citation2002). Phytoplankton in the oceans are known to produce a large number of different volatile organic compounds (Shaw et al., Citation2003), like isoprene (Meskhidze and Nenes, Citation2006), monoterpenes (Yassaa et al., Citation2008), amines (Gibb et al., Citation1999; Facchini et al., Citation2008; Müller et al., Citation2009) and chlorobenzenes (Colomb et al., Citation2008), all of which are reactive in the atmosphere and potentially involved in the subsequent growth of nucleated clusters.
Finally, there is a continuous competition between particle growth, mainly by condensation of vapours, and scavenging of clusters by larger pre-existing particles (Kulmala et al., Citation2000; Anttila et al., Citation2004). Unless the freshly formed clusters grow sufficiently fast, they will be lost through diffusive coagulation to larger pre-existing particles (Kerminen et al., Citation2001). Hence reduced availability of H2SO4 and/or organic vapours (OV) will limit or suppress formation of new aerosol particles.
Although nucleation followed by growth continues to be the generally accepted understanding of the formation of particles below 25 nm diameter in continental and coastal regions, a direct demonstration that this is also the prevailing mechanism leading to new particles in the MBL of the central Arctic Ocean basin has yet to be given. Leck and Bigg (Citation1999) reported on nucleation events that did not follow the typical banana-shaped growth curve (Kulmala and Kerminen, Citation2008). Instead they observed enhanced levels of 3–5 nm diameter particles and simultaneous increases in particle number occurring in distinct size bands <50 nm in diameter. About 45% of the observed number concentration enhancements of <25 nm sized particles during an expedition to the central Arctic Ocean in the summer of 1996 (AOE-96; Leck et al., Citation2001) were associated with rapid dissipation of intermittent fogs. More recently the work by Leck and Bigg (Citation1999) was confirmed by Heintzenberg et al. (Citation2006) who also reported a strong indication of fog-related aerosol production over the pack ice particularly in the smaller Aitken mode size range (25–50 nm in diameter). Furthermore, doubt was thrown on the role of sulphuric acid in the formation of nucleation mode particles in the Arctic. Leck and Bigg (Citation1999) found that during sudden enhancement episodes, no particles smaller than 50 nm showed a detectable presence of sulphuric acid.
The existence of a primary biological source of airborne particles with a diameter between 3 and 25 nm is one of the major conclusions from previous expeditions to the central Arctic Oceans (Leck and Bigg, Citation2010). The chemical nature and morphology of particles <10 nm in diameter is hard to detect with available instrumentation. Therefore it could not be excluded that the very small particles originate from nucleation of gas phase oxidation products. Over the central Arctic Ocean, when organic material was found to be present in film droplets associated with bubble bursting, an amino acid (L-methionine) of biological origin could be responsible for observed periods of new particle formation (Leck and Bigg, Citation1999). L-methionine has an important role in the production of dimethyl-sulfoniopropionate (DMSP), an osmo-, cryo- and light-protecting agent in marine algae (Karsten et al., Citation1992). Laboratory experiments showed that L-methionine can form freshly nucleated particles (Leck and Bigg, Citation1999). However, a verification of this particle formation route in the Arctic is still missing.
In this study we explore the possibility to reproduce new particle formation events observed during three expeditions to the central Arctic Ocean during the biologically most active summer melt season in the years of 1996 (AOE-96: Leck et al., Citation2001), 2001 (AOE-2001: Leck et al., Citation2004; Tjernström et al., Citation2004) and 2008 (ASCOS-2008; Paatero et al., Citation2009). We use the size-resolved multicomponent aerosol dynamics box model (Karl et al., Citation2011), Marine Aerosol Formation model (MAFOR), to simulate the time series of nucleation mode particle number concentrations (particles with diameter <25 nm) measured at different locations over the central Arctic basin marginal ice zone (MIZ) and pack ice area North of 80°N. Recent parameterisation of ion-mediated, heterogeneous nucleation approaches and a new parameterisation of nucleation involving organics are among the nucleation schemes applied.
2. Background to the selected new particle formation events
2.1. Location of the observations
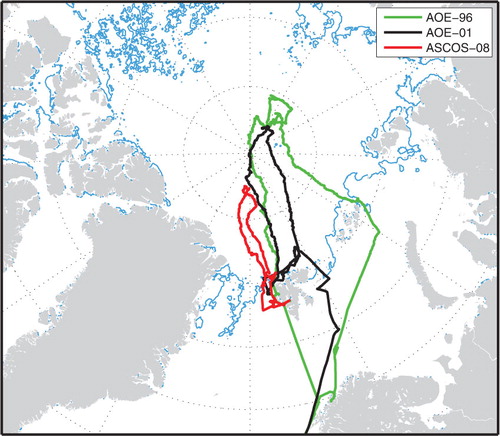
Included in the study are four observed episodes of new particle production that took place during the Arctic Ocean Expedition in 1996 (AOE-96); 25 July, day of year (DOY) 207 (81.1°N, 68.2°E), 27 July, DOY 209 (83.5°N, 66.0°E), 20 August, DOY 233 (87.1°N, 145.1°E) and 22 August, DOY 235 (87.1°N, 144.5°E), one particle formation episode from AOE-2001, 13 August (DOY 225; 88.4°N; 1.7°E), and one from ASCOS-2008, 3 August (DOY 216; 78–79°N, 9–5°E). The cruise routes of the icebreaker Oden for the three Arctic Ocean Expeditions are shown in .
Fig. 1. Map of the central Arctic Ocean, showing the route of the icebreaker Oden during the Arctic Ocean Expedition 1996 (AOE-96; Leck et al., 2001) as green line, the route for the Arctic Ocean Expedition 2001 (AOE-2001; Leck et al., 2004; Tjernström et al., 2004) as black line and the route of the Arctic Ocean Expedition ASCOS in 2008 (Paatero et al., 2009) as red line. The major part of the observations during AOE-96 were performed during the first leg of the expedition which lasted from middle July to the end of August from 75°N to 87°N in the Barents Sea as well as in the pack ice of the Nansen and Amundsen basins. On the second leg, Oden reached the North Pole on 10 September (DOY 254) and Spitsbergen (Svalbard), at latitude 78°N on 21 September (DOY 265). AOE-2001 lasted from 5 July (DOY 186) to 26 August (DOY 238), 2001. Most of the observations were obtained during the 2 August (DOY 214) to 23 August (DOY 235) when the ship was moored to, and drifted with, an ice floe from latitude 88.9°N to 88.2°N. ASCOS-2008 lasted from 2 August (DOY 215) and returned to the same location on 9 September (DOY 253), 2008. After departure of the Oden from Longyearbyen, Spitsbergen, the first two stations were located in the open water on 3 August (DOY 215) and in the MIZ starting 4 August (DOY 216) of the Greenland Sea. Thereafter, the ship headed North through the pack ice area. The most intensive measurement period commenced during 12 August (DOY 225) when the ship was moored to an ice floe at 87°N and drifted for 21 d (1 September, DOY 245). The light-blue line illustrates the location of the ice edge zone in the summer of 2008.
2.2. Instrumental techniques
An identical PM10-inlet was utilised in all expeditions upstream of all aerosol measurements. The inlet with the impactor was located 23 m above the sea surface, 3 m above the roof of the laboratory container on Odens’ 4th deck. Direct contamination from the ship was excluded by using a pollution controller. Provided that the wind was within ±70° of the direction of the bow and stronger than 2 m s−1, no pollution reached the sample inlets. Differential mobility analysers (DMAs) were deployed in all experiments to measure the number size distributions of dry submicrometre particles. The 1996 set up for the aerosol measurements yielded a number size distribution from 3 to 600 nm diameter 27 intervals every 10 min. Leck et al. (Citation2001) and Heintzenberg et al. (Citation2006) reported further details. The counters used in the sizing and counting were calibrated against an electrometer and the TSI-3025 in the standard way (Stolzenburg, Citation1988; Stolzenburg and McMurry, Citation1991). The TSI-3010 measuring total particle concentration was not calibrated. Instead, factory calibrations were used to interpret the data.
In 2001 and 2008, the differential mobility particle sizing system described in Birmili et al. (Citation1999) was used for the measurement of dry number size distributions of submicrometre aerosol particles. It consists of two DMA-based spectrometers with overlapping size ranges working in parallel similar to the 1996 set up. However, a TSI-3025 condensation particle counter (CPC) was used for the particle range between 3 and 20 nm and a TSI-3020 CPC for the range 10–900 nm. The total diameter range was scanned in 12 min in 41 size steps. The transfer functions of both DMAs and the size-dependent counting efficiencies of both CPCs had been calibrated before the experiment.
2.3. Main characteristics of the nucleation events
summarises the main characteristics of the observed nucleation events over the central Arctic Ocean discussed in this study. New particle formation events were recorded at different latitudes North of 78°N in open water, in the MIZ with partly ice-covered water as well as in the pack ice area. During the nucleationevents high concentrations of nucleation mode particles were generated ranging from several hundreds to about 1000 particles cm−3 – in an atmosphere that is characterised by very low total aerosol number concentrations, typically around 50 cm−3 (Covert et al., Citation1996) and occasionally even less than 10 cm−3 (Bigg et al., Citation1996; Covert et al., Citation1996; Bigg et al., Citation2001; Mauritsen et al., Citation2011). As already notified in the Introduction enhanced levels of 3–5 nm particles with simultaneous increases in particle number occurred in distinct size ranges <50 nm diameter showing relatively high concentrations (up to 500 cm−3) for a few hours, were a common feature of all events. Arctic events usually continued for 5–12 h with reduced subsequent growth, before particles were scavenged by fog or precipitation.
Table 1. Main characteristics of the central Arctic Ocean nucleation events included in this study
With the exception of case DOY 207 (AOE-96) all the studied events took place in the afternoon or evening (). It is noted that the sun was continuously above horizon during all events. Modelled OH concentrations had a maximum at midday of about 7–17×105 cm−3 and at night were still in the range of 1–4×105 cm−3. The initial growth stage (from 3 to >10 nm diameter) of the high Arctic new particle formation episodes is relatively short, between 1.5 and 3 h. Aitken mode (D p 25–80 nm; see Covert et al., Citation1996 for definitions) and accumulation mode (D p 80–1000 nm) number concentrations were calculated an hour before and an hour after the beginning of a new particle formation event. Aitken mode number concentrations did not show a clear tendency to either decrease or increase after the start of an event. In case DOY 216 (ASCOS-2008) a dramatic increase of Aitken mode and accumulation mode particle numbers was evident (N Aitken(after)/N Aitken(before) = 4.53).
Five of the six events studied (DOY 207, DOY 233 and DOY 235 in AOE-96, DOY 225 in AOE-2001 and DOY 216 in ASCOS-2008) started in fog or after the disappearance of intermittent shallow fogs that persisted for a few hours between sunny intervals. Wind speed during all observed episodes of nucleation was low, of the order of 5 m s−1 or less.
3. Description of model simulations
3.1. Model description
In this study of nucleation in the Arctic MBL we apply the sectional multicomponent aerosol box model MAFOR which couples aerosol dynamics with photochemistry. A detailed description of MAFOR is given by Karl et al. (Citation2011). A detailed gas and aqueous phase chemistry scheme is included based on the Module Efficient Calculating the Chemistry of the Atmosphere by Sander et al. (Citation2005). The treatment of DMS gas phase chemistry is based on the EL CID scheme (EL CID, Citation2003; Karl et al., Citation2007). In this study an updated model version, v1.2, was used which includes tropospheric non-methane hydrocarbon chemistry of C2–C4 alkanes, propene and isoprene adopted from von Kuhlmann et al. (Citation2003). The model takes explicitly into account the effect that various production and loss processes of vapours have on condensation/evaporation and on nucleation. The model describes aerosol formation via different nucleation processes (which can be selected by the user), growth by condensation of H2SO4, methanesulphonic acid (MSA) and an OV (represented by succinic acid), and particle loss via coagulation, dry deposition and wet scavenging.
The composition of particles in any size bin can change with time due to multicomponent condensation and/or due to coagulation of particles. Included particulate composition classes are: non-sea-salt sulphate (nss-SO4 2− ), ammonium (NH4 +), nitrate (NO3 −), methane sulphonate (MSA p ), organic carbon (OC p ), sea salt and the bulk of unidentified compounds, named X. The model aerosol for an event simulation is initialised by measured or estimated mass concentrations of particulate constituents. Mass concentrations of the respective lognormal nucleation, Aitken, accumulation and coarse mode are distributed over the discrete size sections of the model. Finally the initial model number size distribution is fitted to the observed size distribution by variation of the geometric-mean mass diameter and the geometric SD (bandwidth of the lognormal mode).
The growth of particles through multicomponent condensation of H2SO4, MSA and an OV is implemented according to the continuum/transition regime theory corrected by a transitional correction factor (Fuchs and Sutugin, Citation1970). For clusters of 1–2 nm diameter size the Kelvin barrier is huge and it is expected that clusters initially grow by condensation of non-volatile or extremely low volatile compounds. The Kelvin effect drops sharply as the particle size increases due to its exponential dependence on diameter and condensation of more volatile compounds becomes feasible. Succinic acid is used in this study to represent the OV. Succinic acid has been found in Aitken, accumulation and coarse mode of the Arctic aerosol during the AOE-96 with total concentrations ranging from 0.2 to 15 ng m−3 (Aitken mode concentrations are given in ). The physicochemical properties of succinic acid were used when simulating the condensation of OV. In our model, the Kelvin effect is considered for the condensation/evaporation of H2SO4, MSA and OV. Relevant molecular properties of the three condensing vapours are summarised in .
Table 2. Relevant molecular properties of the condensing vapours at 280 K with respect to condensation/evaporation: molecular weight (MW), saturation vapour pressure (), density of the liquid (ρ
L
) and surface tension (Σ)
3.2. Nucleation of sulphuric acid (H2SO4) and OVs
The model offers the possibility to choose between several different nucleation mechanisms. The currently implemented nucleation options are: (1) binary homogeneous nucleation of H2SO4−H2O according to the parameterisation of Vehkamäki et al. (Citation2002); (2) ternary homogeneous nucleation of H2SO4−H2O − NH3 according to the parameterisation of Merikanto et al. (Citation2007); (3) ion-mediated nucleation of H2SO4−H2O based on a quasi-stationary parameterisation by Yu and Turco (Citation2001) (details of the parameterisation are given by Karl et al., Citation2011); (4) cluster activation involving heterogeneous nucleation based on a simple power law parameterisation (nucleation rate J nucl=A[H2SO4], with the empirical A factor being 2.4×10⁻⁷ s−1); (5) kinetic (barrier less) nucleation (nucleation rate J nucl=K[H2SO4]2, with the empirical nucleation coefficient K being 3.2×10⁻¹⁴ cm3 s−1) and (6) combined H2SO4 nucleation. The combined H2SO4 nucleation mechanism is a combination of nucleation through ion-mediated nucleation and cluster activation to provide an upper estimate to the nucleation rate that can be obtained under tropospheric conditions involving charged and neutral H2SO4 and water molecules. Throughout the remainder of this paper the combined (or total) H2SO4 nucleation mechanism is abbreviated by TSA. In addition, we introduced three new nucleation mechanisms in this study, which are based on the kinetic nucleation of H2SO4 and an OV, through the formation of stable organic-sulphuric acid clusters (see below).
The classical nucleation theories, i.e. homogeneous binary nucleation of H2SO4−H2O, and ternary nucleation of H2SO4−H2O − NH3, were not considered in the present simulation of Arctic nucleation events. Classical theories fail to predict the occurrence of nucleation over the central Arctic Ocean (J nucl=0 cm−3 s−1) as shown by Karl et al. (Citation2011) when modelling the advection of an air parcel from the DMS source region at the marginal ice edge over the Arctic pack ice. This finding is in line with an earlier model study by Pirjola et al. (Citation2000) who concluded that under typical MBL conditions, homogeneous binary H2SO4−H2O nucleation will not occur and ternary H2SO4−H2O − NH3 nucleation will only infrequently produce detectable particles.
Atmospheric nucleation mechanisms involving organic compounds in addition to H2SO4 are of specific interest in marine environments (Facchini et al., Citation2008; Modini et al., Citation2009; Sorooshian et al., Citation2009). Laboratory experiments have revealed that new particle formation in the binary H2SO4−H2O system is considerably enhanced in the presence of sub-ppb levels of aromatic acids (Zhang et al., Citation2004). The molecular complexes and the clusters of H2SO4 with other compounds like water, ammonia and organics are formed via hydrogen bonds of intermediate strength. A recent theoretical study based on ab initio and density functional quantum chemical calculations revealed that strong hydrogen-bonding interactions between organic acid and sulphuric acid provide a driving force for the formation of organic acid-sulphuric acid complexes (Zhao et al., Citation2009). Sulphuric acid-amine clusters seem to be promising candidates of stable nucleation clusters. Ab initio calculations by Kurtén et al. (Citation2008) on neutral and charged dimer sulphuric acid-amine clusters demonstrate that amines significantly enhanced neutral and especially ion-induced sulphuric acid–water nucleation. Kurtén et al. (Citation2008) concluded that amines are much more efficient in the formation of stable clusters with neutral and ionic sulphuric acid–water clusters than ammonia.
Paasonen et al. (Citation2010) evaluated different empirical parameterisations for the nucleation of organic-sulphuric acid clusters at four continental field sites in central and Northern Europe [i.e. Hyytiälä, Melpitz (Germany), San Pietro Capofiume (Italy) and Hohenpeissenberg (Germany)]. While the original activation and kinetic theories suggest that the nucleation rate is proportional to H2SO4 concentration alone (Kulmala et al., Citation2006), Paasonen et al. (Citation2010) proposed analogous mechanisms in which OVs participate in the initial growth of the nucleated particles, assuming that they are involved in the nucleation process itself. From their proposed organic-sulphuric acid nucleation mechanism, we include three in the present work: (1) activation of not identified clusters by both H2SO4 and organics (referred to as OS1), similar to cluster activation by sulphuric acid alone:1 as well as (2) homogenous heteromolecular nucleation between H2SO4 and OV molecules combined with homogenous homomolecular nucleation of H2SO4 according to kinetic nucleation theory (OS2):
2 and (3) homogeneous nucleation of the OV in combination with the nucleation routes of OS2 according to kinetic nucleation theory (OS3):
3
Based on the median values given by Paasonen et al. (Citation2010) for the whole set of field measurements ( in Paasonen et al., Citation2010), the pre-factors A S (activation), k SA and k S (collision rates) were set to 0.7×10⁻⁷, 3.4×10⁻¹⁴ and 1.0×10⁻¹⁴ cm3 s−1, respectively. In eqs. (1)–(3), C g,CA is the gas phase concentration of the nucleating OV, short CA. In contrast to the study of Paasonen et al. (Citation2010), it was not tried to separate the nucleation pre-factor for the respective nucleation terms, since the available particle measurements from the Arctic Ocean do not allow for a more detailed approach. For practical reasons the same initial gas phase concentration C g,CA of 6.0×106 cm−3 was used in the nucleation parameterisations OS1, OS2 and OS3 for the simulation of all event cases. Since nucleation and growth are thought to be decoupled processes the nucleating OV (CA) was chosen to be different from the condensing OV. Possible candidates for the nucleating OV are aromatic acids, terpenoid dicarboxylic acids and amines.
3.3. Description of event simulations
We applied the aerosol model in a non-Lagrangian way assuming that the measured nucleation mode particles have been formed and growing at the respective measurement locations of the events. MAFOR runs were constrained with DMS concentrations, temperature and relative humidity recorded at the measurement locations. All simulations were initialised with the measured number concentration size distribution and the chemical aerosol composition given by Lohmann and Leck (Citation2005) for the respective AOE-96 stations. Measurements of gas phase compounds from AOE-2001 (www.fysik.lu.se/eriksw/aoe2001/aoe2001.htm) and ASCOS-2008 (www.ascos.se) were also used for the initialisation of events. gives a summary of the average gas phase concentration of relevant trace gases and meteorological parameters for the studied nucleation event cases. The range of modelled H2SO4 concentrations is also indicated.
Table 3. Average observed gas-phase concentrations, background particle numbers (N tot) and meteorological variables during the nucleation event cases. In addition, the range of modelled H2SO4 concentration is given
A constant concentration of condensing OV was prescribed in the model simulations. For each event case, preliminary runs were performed with varying OV concentrations. From these model runs an upper limit for the OV concentration was derived according to the following procedure. In repeated runs, using the combined nucleation option, the prescribed OV concentration was stepwise increased from 5×10⁷ to 80×107 cm−3. The modelled number size distribution was plotted against the observed size distribution for specific points in time (e.g. 2, 4, 6 and 8 h after the onset of the event) and the agreement between modelled and observed diameters of Aitken mode and accumulation mode particles was checked in all runs. The first OV concentration for which modelled diameters matched the observed particle diameters at the upper end of the Aitken or accumulation mode was defined as the upper limit OV concentration and was used in the event simulations that are presented in Section 4.
We mentioned in Section 3.1 that the Kelvin barrier for clusters of 1–2 nm diameter size is huge and will effectively inhibit condensation of OVs to these small clusters. The initial stable clusters may grow by cluster activation, heterogeneous reactions on the cluster surface or self-coagulation. If water-soluble organic compounds condense, they may lower the surface tension of the initial clusters and thus facilitate the condensation of other, more volatile, vapours. After these initial growth steps, multicomponent condensation of organic and inorganic vapours may follow. In the applied model, the initial growth processes of the cluster are not resolved explicitly, because the freshly nucleated clusters are treated in the same manner as other particles of the aerosol size distribution. To test the sensitivity of OV condensation to the Kelvin barrier in the early stages of cluster growth, additional model simulations were performed in which no correction for the Kelvin effect was made (‘NK’). It is noted that the ‘NK’ runs represent an extreme case since in reality the above mentioned initial growth processes will only partly weaken the Kelvin barrier and probably only occur for short times.
4. Results
The intention of the MAFOR simulations were: (1) to investigate whether observed formation of new particles in the high Arctic could be adequately simulated with any of the nucleation mechanisms listed below; and (2) to identify the eventual need for other processes to explain the observed temporal evolution of nucleation mode particles. Model runs were carried out for all nucleation events using the following different nucleation schemes: (i) ion-mediated nucleation (IMN); (ii) kinetic nucleation of H2SO4 (KSA); (iii) kinetic nucleation of H2SO4 without correction of the Kelvin effect during condensation of OV (KSA-NK); (iv) cluster activation by H2SO4 (CSA); (v) combined nucleation mechanism taking the Kelvin effect fully into account (TSA-RF); (vi) combined nucleation mechanism but not correcting for the Kelvin-effect (TSA-NK); (vii) OS1; (viii) OS2; (ix) OS3 and (x) OS3 without correction of the Kelvin effect (OS3-NK). In all simulations a prescribed constant (upper limit) OV concentration is used. The model simulation that uses TSA and considers the Kelvin effect during condensation of the OV, referred to as TSA-RF, was chosen as reference configuration. Resulting average nucleation rates obtained in these runs are reported in .
Table 4. Comparison of modelled nucleation rates (cm−3 s−1) obtained from different nucleation schemes for the six nucleation events during AOE-96/AOE-2001/ASCOS-2008. A predefined OV concentration is used in all simulations. Presented nucleation rates are average values for the first 7 h of the simulation
Among the nucleation mechanisms which involve H2SO4 as key nucleating agent, CSA was most effective in producing new particles. The nucleation rate computed for CSA was about 1–2 orders of magnitude higher than for kinetic scheme KSA and for the ion-mediated scheme IMN. The contribution from IMN was only 0.6–1.4% of the combined (total) H2SO4 nucleation in the studied events (). Organic-sulphuric acid nucleation OS3 resulted in average nucleation rate that were by a factor 2–10 higher than nucleation rates obtained from simulations using TSA. Highest average nucleation rates in all event cases (≈0.4 cm−3 s−1) were obtained when using the organic-sulphuric acid nucleation mechanism OS1. OS1 nucleation rates were almost twice as high as the nucleation rates that were achieved using the OS3 mechanism. Despite producing the highest nucleation rates we decided against using the OS1 nucleation mechanism in the detailed analysis of the events, mainly because Paasonen et al. (Citation2010) found that cluster activation by H2SO4 and OVs did not reliably describe the nucleation processes observed at four continental remote field sites.
Table 5. Model results for important characteristics of the studied nucleation event cases
Concentrations of the condensable OV required for the growth of freshly formed particles to the observed particle sizes of the accumulation mode (D p 80–1000 nm; Covert et al., Citation1996) ranged from 0.6×10⁸ to 7.0×108 cm−3. Modelled growth rates of nucleation mode particles during the first hour of the formation events were in rough agreement with the observed growth rates. Four of the nucleation options described above were selected for a detailed analysis of the event cases and comparison with observed nucleation mode particles: (1) KSA-NK, which represents quadratic dependence of the nucleation rate on H2SO4; (2) the reference model configuration, TSA-RF, which represents linear dependence of the nucleation rate on H2SO4; (3) TSA-NK, which is the latter but without correction of the Kelvin effect and (4) OS3-NK, which is more efficient in producing new particles than the nucleation mechanisms based on H2SO4 alone. The maximum number concentration of nucleation mode particles (3–25 nm diameter size) that formed during the nucleation events is an adequate and unambiguous measure for the agreement between model simulations and observations. Modelled maximum number concentrations of nucleated particles obtained in the event simulations from the four different nucleation options were compared with observed maximum number concentrations of nucleation mode particles during the respective event (reported in ).
Table 6. Comparison of modelled and observed nucleation mode particle number concentrations. Ratio of modelled maximum nucleated particle number concentrations to observed maximum particle number concentrations (3–25 nm diameter size) during the nucleation events (M/O). Model simulations with nucleation option KSA-NK, TSA-RF (reference run), TSA-NK and OS3-NK
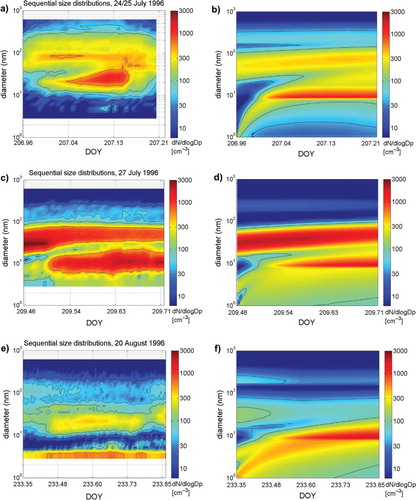
Best overall agreement between modelled and observed nucleation was found for the nucleation option TSA-NK, which is capable of predicting observed maximum nucleation mode numbers during the events within a factor of 2–3. KSA-NK compared well with observations of DOY 233 but usually underestimated observed maximum numbers of nucleation mode particles. Observed simultaneous increase in particle number in distinct size ranges <50 nm diameter on DOY 233 was not captured by any of the nucleation schemes. The nucleation events DOY 209 and DOY 235 are best reproduced with OS3-NK. However, the use of OS3-NK leads to an overprediction of observed maximum numbers in the other events by a factor of 3–6. shows the observed evolution of the aerosol size distributions during the events DOY 207, DOY 209, DOY 233, and compared to modelled aerosol size distributions obtained from simulations using TSA-NK. In Sections 4.1–4.6 model simulations with TSA-NK are used for comparison of aerosol size distribution changes during the events, while results from model simulations using the other three nucleation options are only presented when relevant.
Fig. 2. Sequential number size distribution (dN/d log D p in particles cm−3) during events: (a) observation DOY 207; (b) modelled event DOY 207 using TSA-NK and OV concentration of 7.0×108 cm−3; (c) observation DOY 209; (d) modelled event DOY 209 using TSA-NK and OV concentration of 4.0×108 cm−3; (e) observation DOY 233; (f) modelled event DOY 233 using TSA-NK and OV concentration of 1.5×108 cm−3. All plots have the same time and diameter scale.
4.1. Case DOY 207, AOE-96
During AOE-96, a new particle formation event was observed over open sea on DOY 207 (24–25 July 1996) short after end of a fog period. At DOY 206.969 (23:16 UTC), particles with diameter between 10 and 50 nm appeared (see a) and number concentrations of these particles increased to about 200 cm−3 within the following 4 h until they were scavenged by rain showers. Initially particles were confined to 10–30 nm, while later also larger particles with up to 50 nm diameter appeared. The newly appearing particles formed a new Aitken mode, which had not been present in the initial aerosol size distribution. The appearance of 10–30 nm particles of the new Aitken mode was, however, not preceded with nucleated particles of <10 nm diameter sizes.
Model simulations using different nucleation schemes and a fixed OV concentration of 7.0×108 cm−3 (ca. 26 pptv) were at first hand performed. In subsequent model simulations the concentration of the condensable OV was varied. However, further increasing the OV concentration did not increase number concentrations of <10 nm diameter particles but merely shifted accumulation mode particles to larger diameters. This implies that OV preferentially condensed to pre-existing accumulation mode particles. Modelled number size distributions using the combined nucleation scheme (TSA-RF) are shown in for the beginning (black line), after 2:20 h (green line), after 5:00 h (blue line) and after 7:10 h (red line). Observed number concentrations of particles with diameters in the range of 10–30 nm increased 2 h after the beginning of the event (green and blue squares in ) and this was not captured by the model simulation with TSA-RF.
Fig. 3. Number size distributions during event case DOY 207 (AOE-96). Modelled (lines) and observed (squares) size distributions (dN/d log D p) at event onset (black), 2:20 h (green), 5 h (blue), 7:10 h (red). Model simulation with TSA-RF (solid line) and TSA-NK (dotted line, partly overlapping with TSA-RF) using a prescribed OV concentration of 7.0×108 cm−3.
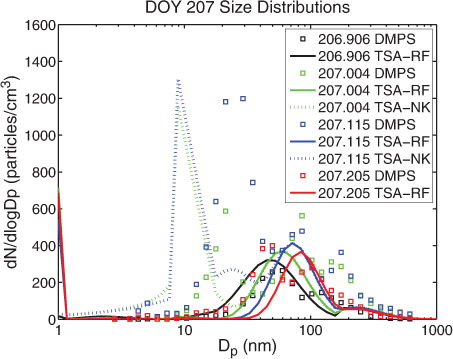
A large effect on the modelled particle size distribution was gained when the condensation of the OV to small particles was not corrected for the Kelvin effect: it was possible for nucleated particles to grow and form a new nucleation mode in a size range of 8–20 nm diameter, centred at 10 nm (simulation TSA-NK; blue- and green-dotted lines in ). The modelled nucleation mode reached similar peak number concentrations as the observed new mode and also modelled sequential size distribution showed a large similarity with the observed sequence of size distributions (see b).
4.2. Case DOY 209, AOE-96
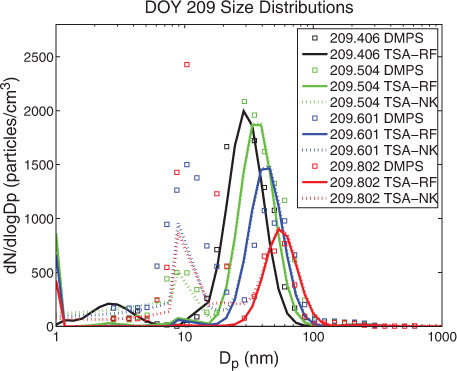
The event on DOY 209, occurred during a sunny day, free from local cloud but thin haze was present within the lowest 200 m (AOE-96; 27 July 1996; c). The event showed enhanced particle number concentrations (100–200 cm−3) in the 50–100 nm diameter size range, which dominated the aerosol size distribution before the onset of the nucleation at about 09:00 UTC (DOY 209.375). A particle burst of freshly generated 5–20 nm particles occurred 3 h after the first appearance of nucleated >3 nm particles and lasted for several hours. After noon the pre-existing 50–100 nm diameter sized particles were scavenged and their number concentrations were largely reduced. Simultaneously, particles in the 5–50 nm diameter range appeared in high numbers. Moderate growth of the particles in the 5–50 nm and the 70–200 nm aerosol modes was observed.
shows the large difference between the modelled aerosol number size distribution obtained from the simulations using either TSA-RF or TSA-NK. Neglecting the Kelvin barrier (TSA-NK) allowed for a drastically enhanced growth of freshly nucleated particles (<3 nm) by unhindered condensation of the OV. This resulted in the formation of enhanced number concentrations of 10–50 nm sized particles 3 h after the onset of the event. The agreement between the temporal evolution of modelled size distributions from the simulation when the Kelvin effect was not accounted for (TSA-NK, d) and the observed size distributions (c) underlines the relevance of this surprising finding.
Fig. 4. Number size distributions during event case DOY 209 (AOE-96). Modelled (lines) and observed (squares) size distributions (dN/d log D p) at event onset (black), 2:20 h (green), 4:40 h (blue) and 9:30 h (red) after onset. Model simulation with TSA-RF (solid line) and TSA-NK (dotted line, partly overlapping with TSA-RF) using a prescribed OV concentration of 4.0×108 cm−3.
An additional model test was done to investigate the possibility that the condensable OV is produced in the photo-oxidation of the relatively short-lived precursor isoprene. Isoprene reacts with hydroxyl radicals (OH) at a temperature-dependent rate constant of k(ISOP + OH) = 2.54×10⁻¹¹ exp(410/T) (corresponding to 1.14×10⁻¹⁰ cm3 s−1 at 273 K), and it was assumed that in this reaction OV is formed with a stoichiometric molar yield of 40% (corresponding to a mass-based yield of 23%). The simulation was done with configuration TSA-NK, using a start concentration of 30 pptv OV and 200 pptv isoprene. Modelled OH concentration decreased from about 5×105 cm−3 at midday to about 2×105 cm−3 in the evening (). Constant emissions of isoprene (2×109 cm−2 s−1) were induced to assure that isoprene concentrations remained between 100 and 200 pptv throughout the simulation.
Fig. 5. Modelled concentrations of isoprene (solid line), OH (dashed line), the condensable OV (dotted line) in a test simulation of DOY 209. Modelled aerosol mass concentration of organics (diameter range 10–100 nm) is shown on the left y-axis (dotted line with circles). Also the source rate of OV (cm−3 s−1) is plotted (dash-dotted line).
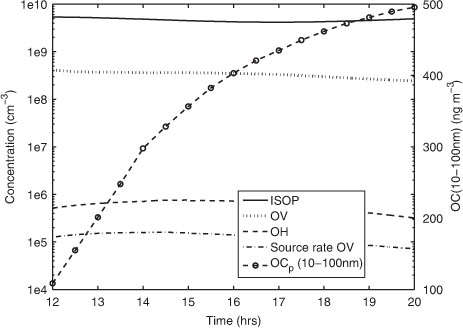
The aerosol mass concentration of organics (OC p ) in the size range of 10–100 nm diameter increased from about 120 to 500 ng m−3 during the 8 h simulation. The source rate of OV had to be in the range of 8×10⁴ to 2×105 cm−3 s−1 in order to reproduce the observed particle growth on DOY 209. This source rate estimate involves very high concentrations of isoprene (commonly observed isoprene concentrations are below 30 pptv over the central Arctic Ocean; J. Paatero, unpublished data), and a very high OV formation yield in the isoprene oxidation (commonly a mass-based yield of 2% is applied). It is thus likely that: (1) the precursor is a faster reacting compound, such as for example the sesquiterpene β-caryophyllene which has an estimated lifetime of 2 min in the reaction with O3 (at 7×1011 cm−3 O3; Atkinson and Arey, Citation2003); or (2) the condensable vapours were less volatile (than succinic acid).
4.3. Case DOY 233, AOE-96
Low particle number concentrations (<150 cm−3) were observed during DOY 233 (AOE-96; 20 August 1996, e). Intermittent shallow fogs persisted a few hours between sunny intervals before and after the event. After an intermittent fog spell, at about 08:45 UTC (DOY 233.365), new particles in sizes <5 nm diameter appeared, increased in numbers, and persisted through the following 10 h. Maximum number concentrations of the small particles were not higher than 100 cm−3. At about 10:45 UTC new particles appeared in the 20–50 nm diameter range, lagging the below 5 nm particles in time by 2 h. Their evolution seems not to be connected to the freshly formed <5 nm particles.
While the model simulation using TSA-RF predicted that <5 nm particles were rapidly lost during the event, the model simulation using TSA-NK which did not consider the Kelvin-effect (Kelvin effect set to unity) predicted that <5 nm particles grow by condensation of the OV into a size range of 8–20 nm diameter within 6 h (blue-dotted line in ). Modelled growth rate in the beginning of the event (DOY 233.35–233.48) obtained in the TSA-NK simulation (1.5 nm h−1) is in agreement with the observed growth rate (0.9 nmh−1).
Fig. 6. Number size distributions during event case DOY 233 (AOE-96). Modelled (lines) and observed (squares) size distributions (dN/d log D p) at event onset (black), 2:30 h (green), 6:00 h (blue) and 10:50 h (red) after onset. Model simulation with TSA-RF (solid line) and TSA-NK (blue- and green-dotted lines, partly overlapping with TSA-RF) using a prescribed OV concentration of 1.5×108 cm−3.
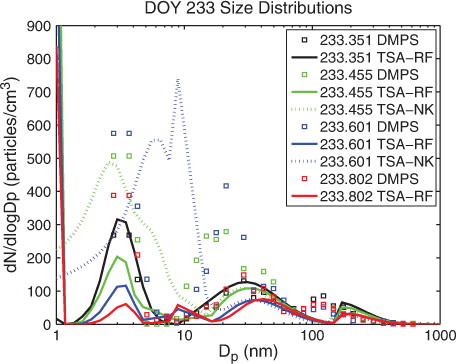
The second observed peak of new particles appeared at larger sizes, between 20 and 50 nm, and formed a broad particle mode. TSA-NK failed to reproduce the peak at 20–50 nm. Modelled growth of the nucleated particles stopped at 20 nm in the simulation (comparison of e and f).
4.4. Case DOY 235, AOE-96
Similar to the previous nucleation event an intermittent shallow fog persisted a few hours with low pre-existing particle number concentrations (max. 30–50 cm−3) on DOY 235 (AOE-96; 22 August 1996). After the fog dissipated sudden evolutions of new particles in three clearly separated size bands (<5, 7–18 and 21–50 nm diameter) occurred at around 10:35 UTC (DOY 235.441). During this nucleation event enhancement of small particles in sizes <5 nm diameter and in sizes of 7–18 nm diameter appeared almost simultaneously, the occurrence of larger particles (21–50 nm diameter) lagged by 1 h. Maximum number of concentrations (up to 300 cm−3) of the smallest particles (<5 nm) occurred with a time lag of approximately 1 h after the largest particles reached their peak number concentrations. However, the particles in the size range 7–18 nm disappeared after 5 h while the smaller (<5 nm diameter) and larger particles (21–50 nm diameter) persisted for another 6 h, until Brownian capture by fog droplets caused them to disappear at the time of the onset of the second fog. The earlier disappearance of the particles in the 7–18 nm diameter size band was not connected to the evolution of the fog.
Model simulations were performed with a predefined OV concentration of 0.6×108 cm−3 (ca. 2 pptv). The resulting number size distributions using the combined nucleation scheme (TSA-RF and TSA-NK) are shown in a. In addition results from simulations with OS3 and OS3-NK are compared to the observed size distributions in b. The observed peak of newly formed 7–18 nm particles was not reproduced by the model independent of the applied nucleation mechanism.
Fig. 7. Number size distributions during event case DOY 235 (AOE-96). Modelled (lines) and observed (squares) size distributions (dN/d log D p) at event onset (black), 3:40 h (green), 8:30 h (blue) and 13:20 h (red) after onset. Two model simulations using prescribed OV concentration of 0.6×108 cm−3 were performed: (a) with TSA-RF (solid line) and TSA-NK (dotted line) and (b) with OS3 (solid line) and OS3-NK (dotted line).
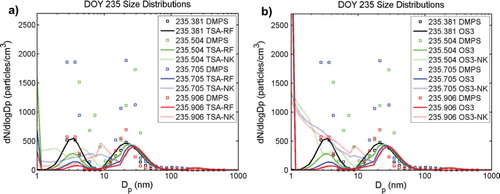
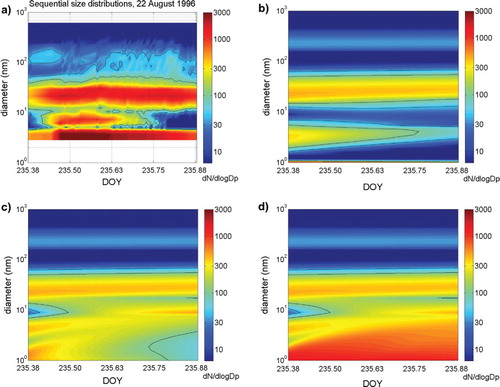
Not correcting for the Kelvin effect in the condensation of the OV strongly affected the modelled size distribution below 20 nm, facilitating the growth of nucleated particles into sizes between 10 and 20 nm diameter. Nucleated clusters grew fast into sizes of 3–6 nm diameter (c), which was not the case in the reference simulation (b). During the first hour of the event the modelled growth rate was ≈0.5 nm h−1 in the TSA-NK simulation. Modelled particle numbers in the 5–20 nm diameter range continued to increase until the end of the TSA-NK simulation (a and 8c). Appearance of this new peak in the model size distribution lags the observed 7–18 nm diameter size band by several hours. This can be seen immediately when comparing time sequences of the modelled (c) with the observed (a) number size distributions. The observed 7–18 nm particle peak disappears after about 4 h indicating that the source of these particles vanished. Using organic-sulphuric acid nucleation OS3-NK increased the nucleation rate of fresh clusters in the model by a factor of four but did not accelerate the appearance of particles in the size range 5–21 nm diameter (d compared to c). OS3-NK is the only new particle formation route which enables enhancement of detectable <5 nm particles during the course of the event (dotted lines in b). The modelled enhancement of <5 nm particles with organic-sulphuric acid nucleation OS3-NK (d) resembles the observed enhancement of the small particles during DOY 235 (a).
Fig. 8. Sequential number size distribution (dN/d log D p) during event case DOY 235 (AOE-96): (a) observed; (b) modelled with TSA-RF; (c) modelled with TSA-NK and (d) modelled with OS3-NK. OV concentration of 0.6×108 cm−3 is used in all model simulations. All plots have the same time and diameter scale.
4.5. Case DOY 225, AOE-2001
In the AOE-2001 expedition, a new particle formation event was recorded on DOY 225–226 (13–14 August 2001) during the ice-drift period (2–21 August 2001) where the icebreaker Oden was moored to a relatively flat ice floe (1.5×3 km) at about 89°N, 1°W. From midnight to ca. 04:00 UTC a shallow fog was observed followed by a lift at ca. 16:00 UTC. A burst of new nanometre-sized particles appeared at 16:20 UTC (DOY 225.681) and was followed by rapid growth into 6–15 nm diameter sizes within 1.5–2 h (a). In the further evolution of the event, observed particle growth slowed down indicative for the limited abundance of condensing vapours in the high Arctic. After 8 h (at about 23:30 UTC) the event ceased and the nucleation mode completely disappeared. The newly formed nucleation mode particles were probably scavenged to the larger pre-existing particles of the Aitken mode (20–40 nm diameter range) or were deposited to the surface.
Fig. 9. Sequential number size distributions (dN/d log D p in particles per cubic centimetre) during event DOY 225 (AOE-2001) and DOY 216 (ASCOS-2008): (a) observation DOY 225; (b) modelled event DOY 225 using TSA-NK and a prescribed OV concentration of 3.0×108 cm−3; (c) observation DOY 216 and (d) modelled event DOY 216 using TSA-NK and a prescribed OV concentration of 2.0×108 cm−3. Note that the plots of the observation (c) and of the model simulation (d) have different time ranges but same diameter scale.
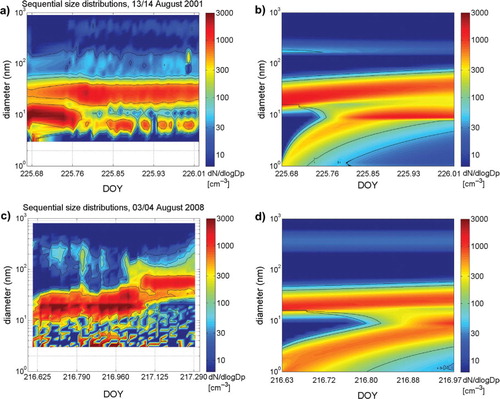
The modelled evolution of the aerosol size distribution using TSA-NK is in rough qualitative agreement with the measured one (b vs. a). The model simulation with TSA-NK shows growth of nucleated particles about 2 h after the time of the event onset but numbers of the nucleation mode (<15 nm) were smaller than observed. A constant OV concentration of 3.0×108 cm−3 (ca. 11 pptv) was prescribed, resulting in an initial modelled growth rate of 3.2 nm h−1, in agreement with the observed growth rate.
4.6. Case DOY 216, ASCOS-2008
During the ASCOS-2008 expedition, a new particle formation event occurred on DOY 216–217 (3–4 August 2008). Aerosol measurements were carried out at the MIZ of Greenland Sea, about 78–79°N and 9–5°E, to the West from the Spitsbergen (Svalbard). The sequential size distribution on DOY 216 (c) shows enhanced particle number concentrations (100–200 cm−3) in the 10–40 nm diameter size range beginning at about 15:00 UTC (DOY 216.625) related to intermittent clearings of fogs. Total particle number concentration increased from below 100 up to 1500 cm−3 during the event. After 18:00 UTC the local wind direction gradually turned from South-Westerly to North-Westerly. The event continued until 01:00 UTC on DOY 217. At the end of the event, particles were in the range of 40–150 nm diameter and thus the largest of these Aitken mode sized particles were potential cloud condensation nuclei.
The resulting number size distributions using the nucleation scheme TSA-NK show good agreement with observed particle size distributions of the nucleation mode range (<10 nm diameter) and of the upper end of the Aitken mode (25–40 nm diameter). Continuous enhancement of modelled number concentrations of nucleation mode particles is evident (d) and, given their sporadic occurrence, observed appearance of nucleated particles was reasonably well reproduced and the modelled maximum number concentrations of nucleation mode particles was in agreement with observations (). Observed high number concentrations of particles in the size range of 10–50 nm (centred at 20 nm) which were continuously present during the event were, however, underestimated by the model.
5. Discussion
Model simulations presented in this study can only represent new particle formation occurring in situ in the MBL through the process of nucleation followed by growth. Other in situ production routes such as the primary emission of particles and the fragmentation of larger particles (Leck and Bigg, Citation2010) are not considered by the model. In Section 5.1, we briefly summarise conclusions from the simulated cases above and discuss the relevance of other processes such as primary particle production and atmospheric transport and mixing of particles for the observed number concentration enhancements. The effect of uncertainties with respect to the simulation of nucleation and condensation on the modelled aerosol size distribution and nucleation mode particle numbers is explored in Section 5.2 in order to assess the reliability of model-based conclusions on new particle formation in the arctic MBL. Section 5.3 provides an overview of possible other processes, that in principle could have contributed to observed enhancement of small particles during the event cases.
5.1. Summary of cases
In the following, we briefly summarise for which cases the comparison between model-predicted and observed new particle formation is supportive of nucleation followed by growth and for which cases it is more likely that new particle formation was caused by other processes:
DOY 207 (AOE-96). Observed enhancement of the number concentrations of 10–30 nm particles in case DOY 207 is in line with a nucleation process forming high numbers of <3 nm particles and subsequent rapid growth of these small particles by condensation of a semi-volatile OV which was unaffected by the Kelvin effect. However, since nucleation and growth of particles below 10 nm has not been observed, it is also possible that nucleation had taken place in higher layers of the MBL and the particles then subsided to the observation location. There exists observational evidence that the sudden appearance of particles in the 10–30 nm diameter size range is a result of vertical mixing that brought new particles originating from upper layers of the MBL to the measurement location at the surface. Sodar records on DOY 207 showed consistent downward air motions from levels of 300 m height and possibly from >550 m (the upper limit of the sodar measurement) between about DOY 207.1 and DOY 207.2 (Bigg et al., Citation2001) associated with the passage of a cold front.
DOY 209 (AOE-96). This new particle formation event was very likely a result of nucleation of DMS-derived H2SO4 followed by subsequent growth involving OVs. Observed enhancement of the number concentrations of 5–50 nm particles in case DOY 209 is in line with a nucleation process forming high numbers of <3 nm particles and subsequent rapid growth of these small particles by condensation of a semi-volatile OV which was unaffected by the Kelvin effect.
DOY 233 (AOE-96). Nucleation event DOY 233 was associated with the near-simultaneous enhancement of <5 nm sized particles and larger (20–50 nm diameter size) particles. Model simulations show that number concentrations of <10 nm particles during DOY 233 can be reproduced using the kinetic or the activation nucleation mechanism, whereas observed enhancement of 20–50 nm particles is unexplained. The most likely explanation for the enhancement of particle numbers in the 20–50 nm size range is the in situ production of particles from biological oceanic origin.
DOY 235 (AOE-96). The continued production of particles within distinct size bands (<5, 7–18 and 21–50 nm diameter) over several hours in case DOY 235 strongly indicates in situ formation of the new particles. The observed distinct size bands (7–18 and 21–50 nm diameter) would be in qualitative agreement with vertical down-mixing of particles, assuming that layers (at <250 m height inside the MBL) containing newly formed particles are somewhat separated vertically from those containing particles that have grown to larger sizes. However, it is improbable that sudden mixing caused particles from the different layers to appear at the observation level at the same time, and that the downward air motion continued for more than 8 h during the event. Based on the meteorological conditions (wind speed and direction, UV, etc.) on DOY 235 no obvious explanation exists for the earlier disappearance of particles in the 7–18 nm diameter size band by about 6 h. Due to the likely local origin of the particles, the most feasible explanation is that either the source material (primary particles or precursor vapours) vanished or the formation processes stopped. By analysing the correlation matrix of the time sequences of observed particle number concentrations with their diameters, Leck and Bigg (Citation2010) recently demonstrated for the case DOY 235, that the formation event is more in line with their postulated fragmentation mechanism than with secondary production of new particles. In our present model study, it is shown that number concentrations of <10 nm particles during DOY 235 can be reproduced in a model simulation using the new organic-sulphuric acid nucleation mechanism, whereas the observed simultaneous enhancement of 21–50 nm diameter particles is unexplained. The most likely explanation for the enhancement of particle numbers in the 21–50 nm size range is a source of primary particles of oceanic origin.
DOY 225 (AOE-2001). Although number concentrations of <15 nm particles were underestimated by the model, comparison between model and observations supports that new particle formation in the event on DOY 225 was caused by nucleation followed by growth, not limited by the Kelvin effect.
DOY 216 (AOE-2008). Model calculation shows that even after 10 h of continued growth, the nucleation mode particles do not reach the sizes of the observed peak at about 20 nm. This is a sign that other mechanisms contributed to the enhancement of 10–50 nm particles. Secondary produced and/or primary emitted organic particles from biologically active surface waters of the greater region, probably over coastal waters of Greenland, might have been advected to the ship's location causing the observed number concentration enhancement of 10–50 nm particles (Vaattovaara et al., Citation2009). On the other hand, observed particles <10 nm can be explained by in situ particle formation by nucleation.
5.2. Model uncertainties
Nucleation and condensation parameterisations in the model are subject to large uncertainties. By testing multiple nucleation mechanisms we have covered a wide range of possible nucleation rate values. In this section, we will explore model uncertainties associated with the nucleation and condensation process in the model and their effect on simulated aerosol size distributions and number concentrations of ultrafine (<100 nm diameter) particles. Uncertainty tests were based on the mechanism TSA-NK which showed best overall agreement with observations. To assess the uncertainty range of model-predicted number concentrations, the parameterisations for nucleation and condensation (of OV) were varied within their uncertainty ranges (upper and lower boundary). Uncertainty tests were performed for three of the events: DOY 225 (AOE-2001), DOY 233 (AOE-96) and DOY 216 (ASCOS-2008), including one case (DOY 225) where secondary production was sufficient and two cases (DOY 233 and DOY 216) where other processes were required to explain the observed aerosol size distribution below 100 nm. It was tested how uncertainties of the nucleation and condensation representation in the model propagate into computed number concentrations for three different size ranges: 3–20, 21–50 and 51–100 nm. The tests included:
Increase of nucleation pre-factor A (see Section 3.2) by factor 5 (NUCL-max).
Decrease of nucleation pre-factor A by factor 100 (NUCL-min).
Setting the saturation vapour of OV to zero (
(OV) = 0 Pa) in order to obtain maximum condensation (COND-max).
Using the lowest OV concentration (i.e. 5.0×107 cm−3) from the preliminary tests (Section 3.3) as a lower boundary for condensation (COND-min).
summarises the results from the uncertainty tests. Variation of the nucleation rate strongly affects total number concentrations of 3–20 nm but had only a minor affect on >20 nm particle numbers. Variation of the condensation flux of OV (COND-max and COND-min) had a large effect on number concentrations in the size range of 51–100 nm because increased (decreased) condensation of OV can shift the particle size distribution towards larger (smaller) diameters. It is important to note that number concentrations in the size range of 21–50 nm were almost invariant to changes of nucleation and condensation parameterisations. This circumstance enables us to draw reliable conclusions from the model uncertainty test.
Table 7. Results of the model uncertainty test for the events DOY 225 (AOE-2001), DOY 233 (AOE-96) and DOY 216 (ASCOS-2008). Relative deviation (in%) of modelled compared to observed total number concentrations in the size ranges 3–20, 21–50 and 51–100 nm in the middle of each event (respectively, at DOY 225.845, DOY 233.575 and DOY 216.790)
For event DOY 225, the uncertainty tests confirmed the agreement of model and observation; within the given uncertainty range observed formation of new particles is in line with secondary production of particles by nucleation and growth. For the event cases DOY 233 and DOY 216, observed number concentrations of particles in the size range of 21–50 nm diameter are apparently underestimated by 50–70%, independent of the chosen configurations. This strongly indicates that other processes were responsible for the enhancement of Aitken mode sized particles during these events, as outlined in Section 5.1. On the other hand, the model is able to predict particle numbers in the 3–20 nm size range which are comparable to observed numbers. Due to uncertain parameterisations of nucleation and condensation in the model, number concentrations computed by TSA-NK for the 3–20 nm range have an uncertainty of factor 2–3.
The IMN scheme was found to be an insignificant contribution to the overall nucleation and rather inefficient compared to the applied empirical power-law dependencies that involve neutral sulphuric acid clusters (such as kinetic nucleation or activation). According to Yu (Citation2010) the steady-state nucleation rate from IMN is controlled by five key parameters: H2SO4 vapour concentration, temperature (T), relative humidity (RH), ionisation rate (Q) and the surface area of pre-existing particles (S
pre). The simplified IMN scheme used here does not take into account the dependency of the steady-state rate on T, RH and S
pre. We used the look-up table program provided by Yu (Citation2010) to derive a more accurate estimate of the IMN rate. A set of parameters typical for the arctic conditions of the event cases (T=268 K, RH=94%, =6×105 cm−3, Q=2.2 ion pairs cm−3 s−1 and S
pre=1.0 µm2 cm−3) was used as input. Resulting steady-state nucleation rate was 11.2×10⁻⁴ cm−3 s−1 and thus at the upper limit of average nucleation rates calculated by the IMN parameterisation (2–10×10−4 cm−3 s−1; ). Increasing sulphuric acid concentration to 8×105 cm−3 resulted a value which was higher by a factor of 7. Even when considering this higher value, nucleation rate from IMN is <10% of the nucleation rate calculated from CSA.
Simulating condensation of the OV by either fully taking into account the Kelvin effect (TSA-RF) or not correcting for the Kelvin effect (TSA-NK) had a large effect on number concentrations in the 3–20 nm size range in the uncertainty test (). Due to current limitations on the knowledge about molecular compositions of the small cluster it is not possible to accurately model the Kelvin effect. In all the nucleation events growth of the freshly nucleated particles to detectable sizes only occurred when the Kelvin effect was completely neglected. This implies that the OV involved in the growth of small particles during the events is less volatile and/or more surface active (having a lower surface tension) than succinic acid.
5.3. Other processes
In the following we list a number of possible other processes that may have contributed to observed number concentration enhancements during the event cases. We also discuss their general relevance for the observed new particle formation North of 80°N over the central Arctic Ocean in summer. These other processes are either in situ production processes not implemented in the model, such as primary emission of biological particles from the ocean, or cannot be handled by a 0-D box model, such as the vertical down-mixing of particles produced within higher vertical layers of the MBL:
Vertical down-mixing of particles generated aloft. Wiedensohler et al. (Citation1996) presented statistical evidence to suggest that ultrafine, less than 25 nm diameter, and Aitken particle observed in the MBL over the Arctic pack ice area probably came from higher altitudes. Hence it was speculated that the free troposphere was a possible origin of ultrafine particles in the Arctic. Subsequently, Leck and Bigg (Citation1999) used the boundary layer structure and the vertical distribution of particles during nucleation events, which showed that if the ultrafine and Aitken particles did come from above, it was from a level <250 m above the surface (inside the MBL) and not from the free troposphere. Aitken and ultrafine mode particles during three Arctic icebreaker expeditions (in the summers of 1991, 1996 and 2001) have been shown to be produced by in situ fine-particle sources over the high Arctic pack ice and possibly have their origin in the surface film of the open water between ice floes (Heintzenberg et al., Citation2006).
Horizontal advection of particles generated in a biologically active source region. Organic matter has been shown to contribute significantly to particle mass in marine aerosol (Hoffman and Duce, Citation1976; Middlebrook et al., Citation1998; Cavalli et al., Citation2004). Biologically active marine areas have been recognised as source regions for nucleation mode particles and secondary produced organic particles (Vaattovaara et al., Citation2006; O'Dowd and de Leeuw, 2007; Modini et al., Citation2009).
Emission of primary particles from the ocean surface. The existence of a primary biological source of airborne particles with diameter between 3 and 25 nm is one of the major conclusions from previous expeditions to the central Arctic Oceans (Leck and Bigg, Citation2010). The flux of particles from open leads in the pack ice was shown by Nilsson et al. (Citation1991) to be an order of magnitude smaller than that from the open sea, and open leads occupied only 5–20% of the area. More recent estimates of the open lead particle fluxes by Held et al. (Citation2010) confirmed the relative low flux estimates by Nilsson et al. (Citation1991) and concluded that the direct emission of aerosol particles from the open lead can only explain 5–10% of the observed particle number variation in the mixing layer close to the surface. Although the particle flux from the surface water of the open leads in the pack ice region is much smaller than over open sea, it will be operative over a very large area, and hence could constitute a significant source of new particles. Leck et al. (Citation2002) proposed that ‘film drops’ generated from the disruption of the bubble membrane during bubble bursting processes and jet drops are responsible for the injection of particles peaking in size at 100–1000 nm diameter, consisting of aggregated solids, virus-like components, bacteria and diatom fragments, into the arctic atmosphere. A polymeric material with colloid inclusions, consistent with properties of exopolymer secretions (EPS) or marine gels from microalgae and bacteria, was first strongly suggested (Leck and Bigg, Citation2005a) and very recently confirmed (Orellana et al., Citation2011) in both air samples and samples of the oceanic surface microlayer. Marine gels contain polysaccharide chains which are shown to break down into smaller units upon contact with acids, hydrolysis by bacterial ectoenzymes and ultraviolet light (Orellana and Verdugo, Citation2003; Chin et al., Citation2004). The role of the organic film on the sea surface in injecting organic material into the atmosphere when bubbles burst has been recognised earlier (e.g. Blanchard, Citation1964). Based on the identification of EPS on airborne particles, Leck and Bigg (Citation2005a) and later Bigg and Leck (Citation2008) speculated that bubble walls could be mainly composed of EPS gel and hence the bubble-bursting generated film drops would be more resistant to breaking and allow for sea-to-air transfer of particulate aggregates. It is, however, less obvious how smaller (<50 nm) particles could be directly transferred from the ocean surface to air.
Fragmentation of larger particles. The breakdown of EPS or marine gel (Leck and Bigg, Citation2005b, Citation2010) during its transfer from the surface water microlayer to the air might be responsible for the observed co-production of 20–50 nm sized particles (biological fragments) and <18 nm particles (polysaccharide units) during the ice-camp nucleation events DOY 233 and DOY 235 (AOE-96). Fragmentation mechanisms of marine gels proposed by Leck and Bigg (Citation2010) encompass the possibility of Rayleigh explosion of evaporating droplets, and the physical or chemical alteration through acidification, ultraviolet light and bacterial enzymes.
Fog-related source of nucleation and Aitken mode particles. Leck and Bigg (Citation1999) observed that most vigorous episodes of nucleation over the central Arctic Ocean were associated with rapid dissipation of intermittent fogs. Using two different statistical approaches, Heintzenberg et al. (Citation2006) found strong indication for fog-related aerosol source processes to be operative over the central Arctic Ocean. Several events included in the present study occurred in fog or short after its dissolution (DOY 207, DOY 233 and DOY 235 in AOE-96, DOY 225 in AOE-2001 and DOY 216 in ASCOS-2008). The hypothesis of Leck and Bigg (Citation1999) offers an explanation for the co-production of nucleation and Aitken mode particles after rapid evaporation of fog or cloud; it roughly involves the following processes: (1) emission of larger particles (film drop size) from the open leads (as discussed before) and under prevalent humid conditions these are activated to form fog and haze droplets; (2) sudden reduction of RH causes shrinkage of droplets and release of L-methionine vapour which may be involved in the nucleation of new nanometre-sized particles; and (3) mechanical disruption of aggregates within the droplets, causing the formation of particles with sizes up to 50 nm diameter. When the aggregates are marine gels, several processes might be responsible for their fragmentation, as discussed before.
6. Conclusions
Nucleation episodes in the central Arctic basin in summer have been observed at different latitudes North of 78°N in the MBL over open water, partly ice-covered water and pack ice. The arctic summer MBL is characterised by in general very low total aerosol number concentrations, around 50 particles cubic cm−3 or less (Bigg et al., Citation1996; Covert et al., Citation1996; Bigg et al., Citation2001; Mauritsen et al., Citation2011). However, episodes of enhanced concentrations of nucleation mode particles occur, ranging from several hundreds to about 1000 particles cm−3. A common feature to all episodes was the enhancement of <5 nm particles which was accompanied by the increase of particle numbers in distinct size bands below 50 nm diameter. Episodes lasted usually for 5–12 h with reduced subsequent particle growth, before the particles were scavenged by fog or precipitation.
Altogether six episodes, referred to as events of new particle formation, were studied using the multicomponent sectional aerosol dynamic model MAFOR in terms of a two-stage secondary production, involving the nucleation of stable clusters followed by growth into detectable sizes. Several nucleation theories were tested, sulphuric acid being the key agent in most of the applied nucleation parameterisations. However, modelled gas phase concentrations of sulphuric acid in all nucleation events were below 6.0×105 cm−3 resulting in very low predicted nucleation rates (<0.1 cm−3 s−1) even for the more efficient nucleation schemes that have been developed in the recent years (Kulmala et al., Citation2006; Kuang et al., Citation2008).
In all events the agreement between modelled and observed nucleation mode was improved when no correction was made for the Kelvin effect. In several of the studied events the temporal evolution of nucleation mode aerosol could be qualitatively ( and ) and quantitatively (see ) reproduced by the model using the nucleation option TSA-NK, assuming that the Kelvin effect for the condensation to nanometre-sized particles is unity. The combined H2SO4 nucleation mechanism TSA-NK describes nucleation as an additive combination of IMN and cluster activation, involving both charged and neutral H2SO4 molecules. Due to the small contribution of IMN in this study, TSA-NK essentially predicted nucleation rates that were proportional to [H2SO4]. In two events (DOY 209 and DOY 235; AOE-96) the new organic-sulphuric acid nucleation option OS3-NK gave better agreement with the observations than TSA-NK, but it predicted too high numbers in the other events.
We recommend the nucleation option TSA-NK for use in 3-D atmospheric modelling of the Arctic region during summer because of the good agreement with observations. Although OS3-NK is an interesting option, too little is known about the ambient concentration of the nucleating OV, CA and its precursors. Laboratory nucleation experiments using different organic candidate molecules (e.g. aromatic acids, terpenoid dicarboxylic acids, amines and amino acids) and sulphuric acid are needed to further evaluate the organic-sulphuric acid nucleation parameterisation.
Our model results indicate the presence of 4–30 pptv condensable OV in the gas phase in order to explain particle growth to observed numbers of 5–10 nm diameter particles. We note that OV concentrations required to reproduce observed growth would be lower when succinic acid was replaced by a less volatile organic compound. It is commonly thought that the condensable OV is produced in the photo-oxidation of a precursor vapour, emitted from oceanic phytoplankton or stressed coastal biota. Testing this assumption for event case DOY 209 using isoprene as OV-precursor, revealed that an OV source rate of 2×105 cm−3 s−1 would be required in order to reproduce observed particle growth in this event.
MAFOR proofed to be a well-performing tool to identify relevant aerosol dynamic processes in the MBL over the central Arctic Ocean with specific interest to new particle formation. However, the clear discrepancies in the temporal evolution between the modelled and observed number size distribution with respect to Aitken mode particles are indicative for missing processes, such as the fragmentation of larger particles (Leck and Bigg, Citation2010), a process not yet fully understood. In a future version of MAFOR the implementation of Nano-Köhler theory (Kulmala et al., Citation2004b) to investigate growth and activation of nanometre-size particles, and of a primary marine particle source, e.g. a combined organic–inorganic sea spray function which extends to sizes below 100 nm diameter, will greatly improve the capabilities of the model. Hopefully, a better understanding of the simultaneous production of particles in distinct size bands below 50 nm diameter – representative for the summer high Arctic – will result.
7. Acknowledgements
This work was funded by the Swedish Research Council, the International Institute of Meteorology and the Knut and Alice Wallenberg Foundation. The Swedish Polar Research Secretariat provided access to the icebreaker Oden and logistical support. Pasi Aalto, Birgit Wehner, Douglas Orsini and Jost Heintzenberg are much appreciated for providing the size-resolved particle number observations. Ian Brooks is thanked for creating the map of the expedition cruise routes. We are grateful to Oden's Captain Anders Backman and Mattias Peterson and their crew. We thank Petri Vaattovaara, Erik Swietlicki and Esther Coz for discussion.
Related Research Data
References
- Anttila T. H, Kulmala M, Kerminen V.-H, Laaksonen A, O'Dowd C. D. Modelling the formation of organic particles in the atmosphere. Atmos. Chem. Phys. 2004; 4: 1071–1083.
- Atkinson R, Arey J. Gas-phase tropospheric chemistry of biogenic volatile organic compounds: a review. Atmos. Environ. 2003; 27(27): S197–S219.
- Bigg, E. K and Leck, C. 2008. The composition of fragments of bubbles bursting at the ocean surface. J. Geophys. Res. 113(D1): 1209. 10.3402/tellusb.v64i0.17158.
- Bigg E. K, Leck C, Nilsson E. D. Sudden changes in arctic atmospheric aerosol concentrations during summer and autumn. Tellus. 1996; 48B: 254–271.
- Bigg E. K, Leck C, Nilsson E. D. Sudden changes in aerosol and gas concentrations in the central Arctic marine boundary layer causes and consequences. J. Geophys. Res. 2001; 106(D23): 32167–32185.
- Bilde M, Svenningsson B, Mønster J, Rosenørn T. Even-odd alternation of evaporation rates and vapor pressures of C3–C9 dicarboxylic acid aerosols. Environ. Sci. Technol. 2003; 37: 1371–1378.
- Birmili W, Stratmann F, Wiedensohler A. Design of a DMA-based size spectrometer for a large particle size range and stable operation. J. Aerosol. Sci. 1999; 30(4): 549–553.
- Blanchard D. C. Sea-to-air transport of surface active material. Science. 1964; 146: 396–397.
- Cavalli, F, Facchini, M. C, Decesari, S, Mircea, M, Emblico, L. and co-authors. 2004. Advances in characterization of size-resolved organic matter in marine aerosol over the North Atlantic. J. Geophys. Res. 109: D24215. 10.3402/tellusb.v64i0.17158.
- Chin W.-C, Orellana M. V, Quesada I, Verdugo P. Secretion in unicellular marine phytoplankton: demonstration of regulated exocytosis in Phaeocystis globosa. J. Plant Cell Physiol. 2004; 45: 535–542.
- Clarke, A. D, Davis, D, Kapustin, V. N, Eisele, F, Chen, G. and co-authors. 1998. Particle nucleation in the tropical boundary layer and its coupling to marine sulfur sources. Science. 282: 89–91.
- Clarke A. D, Kapustin V. N, Eisele F. L, Weber R. J, McMurry P. H. Particle production near marine clouds: sulfuric acid and predictions from classical binary nucleation. Geophys. Res. Lett. 1999; 26: 2425–2428.
- Colomb, A, Yassaa, N, Williams, J, Peeken, I and Lochte, K. 2008. Screening volatile organic compounds (VOCs) emissions from five marine phytoplankton species by head space gas chromatography/mass spectrometry (HS-GC/MS). J. Environ. Monit. 10(3): 325–330. 10.3402/tellusb.v64i0.17158.
- Covert D. S, Wiedensohler A, Aalto P, Heintzenberg J, McMurry P. H, Leck C. Aerosol number distribution from 3 to 500 nm diameter in the arctic marine boundary layer during summer and autumn. Tellus. 1996; 48B: 197–212.
- EL CID. 2003. Evaluation of the climatic impact of dimethyl sulphide. Final Report of the EC 5FP Project: Evaluation of the Climate Impact of Dimethyl Sulphide (EL CID). Project coordinator Prof. Barnes, I., Contract Number: EVK2-CT-1999-00033.
- Facchini, M. C, Decesari, S, Rinaldi, M, Carbone, C, Finessi, E. and co-authors. 2008. Important source of marine secondary organic aerosol from biogenic amines. Environ. Sci. Technol. 42: 9116–9121.
- Ferek, R. J, Hobbs, P. V, Radke, L. F, Herring, J. A, Sturges, W. T. and co-authors. 1995. Dimethyl sulfide in the arctic atmosphere. J. Geophys. Res. 100(D12): 26093–26104.
- Fuchs N. A, Sutugin A. G. Highly Dispersed Aerosols. Ann Arbor Science: Ann Arbor MI, 1970
- Gibb S. W, Mantoura C, Liss P. Ocean-atmosphere exchange and atmospheric speciation of ammonia and methylamines in the region of the NW Arabian Sea. Glob. Biogeochem. Cycles. 1999; 13(1): 161–178.
- Heintzenberg J, Birmili W, Wiedensohler A, Nowak A, Tuch T. Structure, variability and persistence of the submicrometre marine aerosol. Tellus. 2004; 56B: 357–367.
- Heintzenberg, J, Leck, C, Birmili, W, Wehner, B, Tjernström, M. and co-authors. 2006. Aerosol number-size distributions during clear and fog periods in the summer high Arctic 1991, 1996 and 2001. Tellus. 58B: 341–359.
- Held A, Brooks I. M, Leck C, Tjernström M. On the potential contribution of open lead particle emissions to the central Arctic aerosol concentration. Atmos. Chem. Phys. Discuss. 2010; 10: 24961–24992.
- Hoffman E. J, Duce R. A. Factors influencing organic-carbon content of marine aerosols laboratory study. J. Geophys. Res. Oc. Atmos. 1976; 81: 3667–3670.
- Hyvärinen, A.-P, Lihavainen, H, Gaman, A, Vairila, L, Ojala, H. and co-authors. 2006. Surface tensions and densities of oxalic, malonic, succinic, maleic, malic, and cis-pinonic acids. J. Chem. Eng. Data. 51: 255–260.
- Karl, M, Gross, A, Leck, C and Pirjola, L. 2007. Intercomparison of dimethylsulfide oxidation mechanisms for the marine boundary layer: gaseous and particulate sulfur constituents. J. Geophys. Res. 112: D15304. 10.3402/tellusb.v64i0.17158.
- Karl, M, Gross, A, Pirjola, L and Leck, C. 2011. A new flexible multicomponent model for the study of aerosol dynamics in the marine boundary layer. Tellus. B, 63(5), 1001–1025.
- Karsten U, Kirst G, Wiencke C. Dimethylsulphoniopropionate (DMSP) accumulation in green macroalgae from polar to temperate regions: interactive effects of light versus salinity and light versus temperature. Pol. Biol. 1992; 12: 603–607.
- Katoshevski D, Nenes A, Seinfeld J. H. A study of processes that govern the maintenance of aerosols in the marine boundary layer. J. Aerosol. Sci. 1999; 30: 6503–6532.
- Kerminen V.-M, Wexler A. S. The occurrence of sulphuric acid-water nucleation in plumes: urban environment. Tellus. 1996; 48B: 65–82.
- Kerminen V.-M, Pirjola L, Kulmala M. How significant does coagulation scavenging limit atmospheric particle production. J. Geophys. Res. 2001; 106: 24119–24126.
- Kreidenweis S. M, Seinfeld J. H. Nucleation of sulfuric acid-water and methanesulfonic acid-water solution particles: implications for the atmospheric chemistry of organosulfur species. Atmos. Environ. 1988; 22(2): 283–296.
- Kuang, C, McMurry, P. H, McCormick, A. V and Eisele, F. L. 2008. Dependence of nucleation rates on sulfuric acid vapor concentration in diverse atmospheric locations. J. Geophys. Res. 113: D10208. 10.3402/tellusb.v64i0.17158.
- von Kuhlmann, R, Lawrence, M. G, Crutzen, P. J and Rasch, P. J. 2003. A model for studies of tropospheric ozone and nonmethane hydrocarbons: model description and ozone results. J. Geophys. Res. 108: 4294. 10.3402/tellusb.v64i0.17158.
- Kulmala M. How particles nucleate and grow. Science. 2003; 302: 1000–1001.
- Kulmala M, Kerminen V.-M. On the growth of atmospheric nanoparticles. Atmos. Res. 2008; 90: 132–150.
- Kulmala M, Laaksonen A. Binary nucleation of water-sulfuric acid system: comparison of classical theories with different H2SO4 saturation vapor pressures. J. Chem. Phys. 1990; 93: 696–701.
- Kulmala M, Pirjola L, Mäkelä J. M. Stable sulphate clusters as a source of new atmospheric particles. 2000; 404: 66–69.
- Kulmala, M, Vehkamäki, H, Petäjä, T, Dal Maso, M, Lauri, A. and co-authors. 2004a. Formation and growth rates of ultrafine atmospheric particles: a review of observations. Nature. 35: 143–176.
- Kulmala, M, Kerminen, V.-M, Anttila, T, Laaksonen, A and O'Dowd, D. 2004b. Organic aerosol formation via sulphate cluster activation. J. Aerosol. Sci. 109: D04205. DOI: 10.1029/2003JD003961.
- Kulmala, M, Laakso, L, Lehtinen, K. E. J, Riipinen, I, Dal Maso, M. and co-authors. 2004c. Initial steps of aerosol growth. J. Geophys. Res. 4: 2553–2560.
- Kulmala M, Lehtinen K. E. J, Laaksonen A. Cluster activation theory as an explanation of the linear dependence between formation rate of 3 nm particles and sulphuric acid concentration. Atmos. Chem. Phys. 2006; 6: 787–793.
- Kulmala, M, Riipinen, I, Nieminen, T, Hulkkonen, M, Sogacheva, L. and co-authors. 2010. Atmospheric data over a solar cycle: no connection between galactic cosmic rays and new particle formation. Atmos. Chem. Phys. 10: 1885–1898.
- Kurtén T, Loukonen V, Vehkamäki H, Kulmala M. Amines are likely to enhance neutral and ion-induced sulphuric acid-water nucleation in the atmosphere more effectively than ammonia. 2008; 8: 4095–4103.
- Laakso, L, Kulmala, M and Lehtinen, K. E. J. 2003. Effect of condensation rate enhancement factor on 3-nm (diameter) particle formation in binary ion-induced and homogeneous nucleation. Atmos. Chem. Phys. 108(D18): 4574. 10.3402/tellusb.v64i0.17158.
- Leck C, Bigg E. K. Aerosol production over remote marine areas – a new route. Atmos. Chem. Phys. 1999; 26: 3577–3580.
- Leck C, Bigg E. K. Biogenic particles in the surface microlayer and overlaying atmosphere in the central Arctic Ocean during summer. J. Geophys. Res. 2005a; 57B: 305–316.
- Leck, C and Bigg, E. K. 2005b. Evolution of the marine aerosol – a new perspective. 32: L19803. 10.3402/tellusb.v64i0.17158.
- Leck C, Bigg E. K. New particle formation of marine biological origin. J. Geophys. Res. 2010; 44(7): 570–577.
- Leck C, Persson C. The central Arctic as a source of DMS: seasonal variability in relation to biological activity. Tellus. 1996; 48B: 156–177.
- Leck C, Larsson U, Bågander L. E, Johansson S, Hajdu S. DMS in the Baltic Sea annual variability in relation to biological activity. Geophys. Res. Lett. 1990; 95: 3353–3363.
- Leck C, Nilsson E. D, Bigg E. K, Bäcklin L. Atmospheric program on the Arctic Ocean Expedition 1996 (AOE-96): an overview of scientific goals, experimental approach, and instruments. Aerosol. Sci. Tech. 2001; 106(D23): 32051–32067.
- Leck, C, Norman, M, Bigg, E. K and Hillamo, R. 2002. Chemical composition and sources of the high Arctic aerosol relevant for cloud formation. Tellus. 107(D12): 4135. 10.3402/tellusb.v64i0.17158.
- Leck C, Tjernström M, Matrai P, Swietlicki E, Bigg E. K. Can marine micro-organisms influence melting of the Arctic pack ice?. J. Geophys. Res. 2004; 85: 25–36.
- Lohmann U, Leck C. Importance of submicron surface-active organic aerosols for pristine Arctic clouds. J. Geophys. Res. 2005; 57B: 261–268.
- Mauritsen, T, Sedlar, J, Tjernström, M, Leck, C, Martin, M. and co-authors. 2011. An Arctic CCN-limited cloud-aerosol regime. J. Geophys. Res. 11: 165–173.
- Merikanto, J, Napari, I, Vehkamäki, H, Anttila, T and Kulmala, M. 2007. New parameterization of sulfuric acid-ammonia-water ternary nucleation rates at tropospheric conditions. EOS. 112: D15207. 10.3402/tellusb.v64i0.17158.
- Meskhidze, N and Nenes, A. 2006. Phytoplankton and cloudiness in the Southern Ocean. Tellus. 317: 1419. 10.3402/tellusb.v64i0.17158.
- Modini, R. L, Ristovski, Z. D, Johnson, G. R, He, C, Surawski, N. and co-authors. 2009. New particle formation and growth at a remote, sub-tropical coastal location. Atmos. Chem. Phys. 9: 7607–7621.
- Middlebrook A. M, Murphy D. M, Thomson D. Observation of organic material in individual marine particles at Cape Grim during the First Aerosol Characterization Experiment (ACE 1). J. Geophys. Res. 1998; 103: 16457–16483.
- Müller, C, Iinuma, Y, Karstensen, J, van Pinxteren, D, Lehmann, S. and co-authors. 2009. Seasonal variation of aliphatic amines in marine sub-micrometer particles at the Cape Verde Islands. Science. 9: 9587–9597.
- Nilsson, E. D, Rannik, U, Swietlicki, E, Leck, C, Aalto, P. P. and co-authors. 1991. Turbulent aerosol number fluxes during the Arctic Ocean Expedition 1996, part II: a wind driven source of sub micrometer aerosol particles from the sea. Atmos. Chem. Phys. 106(D23): 32139–32154.
- O'Dowd, C. D and de Leeuw, G. 2007. Marine aerosol production: a review of the current knowledge. J. Geophys. Res. 365: 1753–1774. 10.3402/tellusb.v64i0.17158.
- O'Dowd, C. D, McFiggans, G, Creasey, D. J, Pirjola, L, Hoell, C. and co-authors. 1999. On the photochemical production of new particles in the coastal boundary layer. Atmos. Chem. Phys. 26(12): 1707–1710.
- Orellana M. V, Verdugo P. Ultraviolet radiation blocks the organic carbon exchange between the dissolved phase and the gel phase in the ocean. J. Geophys. Res. 2003; 48(4): 1618–1623.
- Orellana, M. V, Matrai, P, Leck, C, Rauschenberg, C. D, Lee, A. M. and co-authors. 2011. Marine microgels as a source of cloud condensation nuclei in the high Arctic. Phil. Trans. R. Soc. A. 108(33): 13612–13617.
- Paasonen, P, Nieminen, T, Asmi, E, Manninen, H. E, Petäjä, T. and co-authors. 2010. On the roles of sulphuric acid and low-volatility organic vapours in the initial steps of atmospheric new particle formation. Geophys. Res. Lett. 10: 11223–11242.
- Paatero, J, Vaattovaara, P, Vestenius, M, Meinander, O, Makkonen, U. and co-authors. 2009. Finnish contribution to the Arctic Summer Cloud Ocean Study (ASCOS) expedition, Arctic Ocean 2008. Limnol. Oceanogr. 45(1–2): 119–146.
- Pirjola L, Laaksonen A, Aalto P, Kulmala M. Sulphate aerosol formation in the Arctic boundary layer. Proc. Natl. Acad. Sci. 1998; 103: 8309–8322.
- Pirjola L, O'Dowd C. D, Brooks I. M, Kulmala M. Can new particle formation occur in the clean marine boundary layer?. Atmos. Chem. Phys. 2000; 105(D21): 26531–26546.
- Pirjola, L, O'Dowd, C. D and Kulmala, M. 2002. A model prediction of the yield of cloud condensation nuclei from coastal nucleation events. Geophysica. 107(D19): 8098. 10.3402/tellusb.v64i0.17158.
- Saiz-Lopez, A, Plane, J. M. C, McFiggans, G, Williams, P. J, Ball, S. M. and co-authors. 2006. Modelling molecular iodine emissions in a coastal environment: the link to new particle formation. J. Geophys. Res. 6: 883–895.
- Sander R, Kerkweg A, Jöckel P, Lelieveld J. Technical note: the new comprehensive atmospheric chemistry module MECCA. J. Geophys. Res. 2005; 5: 445–450.
- Shaw G. E. Production of condensation nuclei in clean air by nucleation of H2SO4. J. Geophys. Res. 1989; 23: 2841–2846.
- Shaw S. L, Chisholm S. W, Prinn R. G. Isoprene production by Prochlorococcus, a marine cyanobacterium, and other phytoplankton. Atmos. Chem. Phys. 2003; 80: 227–245.
- Sorooshian, A, Padró, L. T, Nenes, A, Feingold, G, McComiskey, A. and co-authors. 2009. On the link between ocean biota emissions, aerosol, and maritime clouds: airborne, ground, and satellite measurements off the coast of California. Atmos. Chem. Phys. 23(4): 1–15.
- Stolzenburg M. R. An Ultrafine Aerosol Size Distribution Measuring System. PhD Thesis Mechanical Engineering Department, University of Minnesota, Minneapolis, MN, 1988
- Stolzenburg M. R, McMurry P. H. An ultrafine aerosol condensation nucleus counter. Mar. Chem. 1991; 14: 48–65.
- Tjernström, M, Leck, C, Persson, O. G, Jensen, M. L, Oncley, S. P. and co-authors. 2004. The summertime Arctic atmosphere: meteorological measurements during the Arctic Ocean Expedition 2001 (AOE-2001). Glob. Biogeochem. Cycles. 85: 1305–1321.
- Vaattovaara, P, Huttunen, P. E, Yoon, Y. J, Joutsensaari, J, Lehtinen, K. E. J. and co-authors. 2006. The composition of nucleation and Aitken modes particles during coastal nucleation events: evidence for marine secondary organic contribution. 6: 4601–4616.
- Vaattovaara, P, Ristovski, Z. D, Graus, M, Müller, M, Asmi, E. and co-authors. 2009. Ultrafine particle observation on the open water Arctic Ocean close to ice edge: secondary organic contribution. In: Proceedings of the Finnish Center of Excellence and Graduate School in “Physics, Chemistry, Biology and Meteorology of Atmospheric Composition and Climate Change”, Annual Workshop, 27–29 April 2009, Report Series in Aerosol Science. 102: 433–438.
- Vehkamäki, H, Kulmala, M, Napari, I, Lehtinen, K. E. J, Timmreck, C. and co-authors. 2002. An improved parameterization for sulphuric acid-water nucleation rates for tropospheric and stratospheric conditions. Bull. Amer. Met. Soc. 107(D22): 4622. 10.3402/tellusb.v64i0.17158.
- Weber R. J, McMurry P. H, Eisele F. L, Tanner D. J. Measurement of expected nucleation precursor species and 3–500 nm diameter particles at Mauna Loa Observatory, Hawaii. Atmos. Chem. Phys. 1995; 52(12): 2242–2257.
- Weber, R. J, McMurry, P. H, Mauldin, L, Tanner, D. J, Eisele, F. L. and co-authors. 1998. A study of new particle formation and growth involving biogenic trace gas species measured during ACE 1. 103(D13): 16385–16396.
- Wiedensohler A, Covert D. A, Swietlicky E. S, Aalto P, Heintzenberg J. Occurrence of an ultrafine particle mode less than 20 nm in diameter in the marine boundary layer during the Arctic summer. J. Geophys. Res. 1996; 48B: 213–222.
- Wyslouzil B. E, Seinfeld J. H, Flagan R. C, Okuyama K. Binary nucleation in acid-water systems. Part 1: methanesulfonic acid-water. J. Atmos. Sci. 1991; 94(10): 6827–6841.
- Yassaa, N, Peeken, I, Zöllner, E, Bluhm, K, Arnold, S. and co-authors. 2008. Evidence for marine production of monoterpenes. J. Geophys. Res. 5: 391–401. 10.3402/tellusb.v64i0.17158.
- Yu, F. 2010. Ion-mediated nucleation in the atmosphere: key controlling parameters, implications, and look-up table. Tellus. 115: D03206. 10.3402/tellusb.v64i0.17158.
- Yu F, Turco R. P. From molecular clusters to nanoparticles: role of ambient ionization in tropospheric aerosol formation. J. Chem. Phys. 2001; 106(D5): 4797–4814.
- Zhang, K. M and Wexler, A. S. 2002. A hypothesis for growth of fresh atmospheric nuclei. Environ. Chem. 107(D21): 4577. 10.3402/tellusb.v64i0.17158.
- Zhang, R, Suh, I, Zhao, J, Zhang, D, Fortner, E. C. and co-authors. 2004. Atmospheric new particle formation enhanced by organic acids. J. Geophys. Res. 304: 1487–1490.
- Zhao J, Khalizov A, Zhang R, McGraw R. Hydrogen-bonding interaction in molecular complexes and clusters of aerosol nucleation precursors. 2009; 113: 680–689.