ABSTRACT
Atmospheric 210Pb, 210Po and their activity ratio (210Po/210Pb) have been studied for two years (January 2007–April 2009) from an urban site (Kanpur: 26.5°N and 80.3°E) in the Indo-Gangetic Plain. The average activities of 210Pb and 210Po centre on 1.8 mBq m−3 (range: 0.5–4.8 mBq m−3 for n=99) and 0.094 mBq m−3 (n=21, range: 0.002–0.28 mBq m−3), respectively. The temporal variability in the activity of 210Pb is significantly pronounced, with relatively high levels during October–November and December–February; a trend similar to that observed for the carbonaceous species. The high aerosol abundance coinciding with the biomass burning emissions (agricultural-waste burning) during October–November and stagnant boundary layer in the wintertime (December–February) is the dominant factor for the observed temporal trend. The preliminary data suggest that biomass burning emissions also contribute to the atmospheric 210Po activity, as evident from the large variability in the 210Po/210Pb activity ratio (range: 0.02–0.23) at this urban site. These results have implications to the model-based activity levels of 210Pb and 210Po from in-situ decay of the parent nuclide (222Rn) for given latitude.
†Now at: Department of Earth and Planetary Science, Graduate School of Science, University of Tokyo, Tokyo, Japan.
1. Introduction
The environmental radionuclides (e.g. 7Be, 137Cs, 210Pb, 210Po and 222Rn) of natural and anthropogenic origin serve as a robust tool for studying various atmospheric processes. Among their several applications, most relevant is the ability to serve as tracers of continental air masses, long-range transport of aerosols (Sarin et al., Citation1999; Hammer et al., Citation2007), stratosphere–troposphere exchange rates (Kritz et al., Citation1991; Liu et al., Citation2004) and to assess the residence time of atmospheric aerosols (Marley et al., Citation2000; Baskaran and Shaw, Citation2001; Papastefanou, Citation2006; Lozano et al., Citation2011). The 210Pb (t1/2=22.3 yr) is a naturally occurring radionuclide injected into atmosphere from the decay of 222Rn (t1/2=3.8 d) emanated from the Earth's surface. The 210Po (t1/2=138 d) is also formed in the atmosphere from the decay of 210Pb via short-lived 210Bi (t1/2=5 d). But unlike 210Pb, atmospheric 210Po is also contributed from other sources such as volcanic eruption (Nho et al., Citation1997), coal combustion (Kim et al., Citation2005), as a volatile species from coastal waters and sea-spray aerosols (Kim et al., Citation2000) and biomass burning emissions (LeCloarec et al., Citation1995; Nho et al., Citation1996).
In general, residence time of atmospheric aerosols varies from few days to weeks. In this context, 210Pb − 210Po and 210Pb − 210Bi pairs serve as a potential tool due to their particle-reactive nature and similar removal processes from the atmosphere (Marley et al., Citation2000). The 210Pb − 210Po pair utilises the radioactive disequilibrium among these two nuclides for the estimation of residence time of atmospheric aerosols (Rangarajan and Eapen, Citation1990; Marley et al., Citation2000; Baskaran and Shaw, Citation2001; Baskaran, Citation2011; Lozano et al., Citation2011). However, the concept of residence time is strictly applicable only in case of their in-situ production in the atmosphere from decay of the parent nuclide (222Rn). Their direct injection into atmosphere from other sources (such as volcanic eruption and coal combustion) violates the basic assumption of constant production rate in the atmosphere.
Despite their extensive usefulness, data on 210Pb and 210Po in atmospheric aerosols is rather sparse from urban sites (Rangarajan, Citation1992; Rastogi and Sarin, Citation2008). In this study, we report on the atmospheric 210Pb, 210Po and their activity ratio measured from an urban site (Kanpur, 26.5°N, 80.3°N, ~145 m above sea level) in Northern India. The main objective is to assess the temporal variability and factors influencing the activities of 210Pb and 210Po and 210Po/210Pb ratio in ambient aerosols. This study also represents the first data-set on 210Pb and 210Po from an urban location influenced by the widespread biomass burning emissions (agricultural-waste burning) in the Indo-Gangetic Plain (IGP).
2. Methodology
2.1. Aerosol sampling and site description
The PM10 (particulate matter with aerodynamic diameter ≤ 10 µm) samples were collected for a period of one year (January 2007–February 2008) from an urban site (Kanpur: 26.5°N, 80.3°E, ~142 m asl; ) located at the centre of the IGP (Northern India). All samples (n=57) were collected using a high-volume sampler (flow rate: 1.0±0.1 m3 min−1) on pre-combusted tissuquartz filters (PALLFLEXTM, 2500 QAT-UP; size: 20.0×25.0 cm2) for about 8–10 hrs. A second set of PM10 samples (n=42) were collected from the same site during October 2008–April 2009.
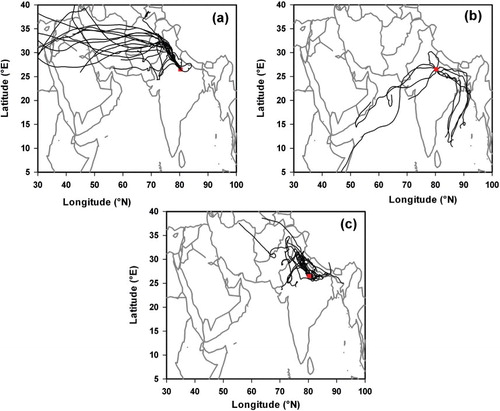
Fig. 1. Air mass back-trajectories (n=50) arriving at the sampling site (Kanpur, shown in red-square) originating from (a) long-range transport from Desert regions (40%), (b) maritime air masses (22%) and (c) localised winds from Northern India (38%).
The mass concentration of PM10 (µg m−3) and its chemical composition at the sampling site (Kanpur) is influenced by the regional emission sources (biomass burning, industrial units and fossil-fuel combustion) and long-range transport of mineral dust (Ram et al., Citation2010). The emission from biomass burning (agricultural-waste and use of wood-fuel for domestic heating) is dominant during October–November and in the wintertime (December–February); representing an important source of carbonaceous aerosols along the entire stretch of the IGP. Mineral aerosols from the Desert regions in western India and from the Middle East contribute significantly to the aerosol loading during the summer months (April–June). The details on the temporal variability in chemical composition of aerosols have been reported in an earlier publication (Ram et al., Citation2010).
2.2. Analysis of 210Pb in aerosols
A quarter portion of the sample filter (area = 105 cm2) was cut into small strips and sealed in a plastic vial (height = 40 mm and diameter = 20 mm). The vial was placed inside a low-background High-Purity Germanium well detector (HPGe, Canberra Model GCW2523) coupled to a Digital Spectrum Analyser (Canberra Model DSA 100). The energy scale (0.4 keV per channel) was calibrated with 1173 and 1332 keV γ-peaks from a standard (60Co) source. The activities of 210Pb in samples were assayed by using 46.5 keV photo-peak (γ-yield: 4.05%). Depending on the 210Pb activities in aerosols, counting time varied from about 9000 to 360 000 sec. In general, samples were counted to accumulate a minimum of 1000 counts under 46.5 keV energy region (with a spread of 2 keV envelope). The absolute counting efficiency of HPGe well detector at 46.5 keV was ascertained based on the known activity of 210Pb from a standard solution of 238U, deposited onto quarter portion of a blank filter and sealed in a plastic vial (similar to the sample vial); thereby matching the sample matrix and geometry. The 210Pb activity in 238U standard solution was quantitatively assayed by alpha-spectrometry (via 210Po in presence of a 209Po spike). An empirical factor of 11.05±0.16 was used (normalised for self-absorption and geometry) based on the observed count rate at 46.5 keV and absolute 210Pb activity in the standard source. The measured activities of 210Pb in samples were decay corrected to the sampling date. The overall error, arising due to the counting statistics and decay correction is within ±10% (for total counts exceeding 1000). A number of repeat measurements (n=12) show a good agreement for 210Pb activities in the range of 0.71±0.06 to 3.7±0.18 mBq m−3. In order to check on the contribution of 210Pb supported by 226Ra associated with the regional soils, γ-peaks in the energy regions of 295, 352 and 609 keV were assessed in all aerosol samples. The count rate in these energy regions was not statistically different compared to the blank run with the filters. Along with samples, blank filters (quarter of the filter packed into a plastic vial with same geometry) were also analysed for 210Pb. The average 210Pb activity in blank filters was ~0.006 cpm (counts per minute) compared to that recorded in aerosol samples (Av = 0.6 cpm), and the contribution from blank filters to 210Pb in samples was insignificant (~1%).
2.3. Analysis of 210Po in aerosols
For the determination of 210Po activity, a quarter of the sample filter was acid digested (with HF-HCl in presence of 209Po spike) in a Teflon beaker. The clear solution was taken to near dryness followed by the addition of 2 ml of 6N HCl acid and further diluted to ~0.6N HCl with Milli-Q water (Resistivity = 18.2 MΩ-cm). To this final solution (~80 ml), ~500–600 mg of ascorbic acid was added to avoid interference from ferric ions (Fe3 + ) before auto-plating Po isotopes (210Po and 209Po) onto Ag disc. The activities of 210Po (Eα=5.33 MeV) and 209Po (Eα=4.9 MeV) were assayed on silicon-surface-barrier detectors (ORTEC Model 4001C) coupled to a multichannel analyser (Canberra Series 35 Plus) (Sarin et al., Citation1999). The correction for decay of 210Po from the time of plating to mid-counting; decay of 210Po and its ingrowth from 210Pb between the time of collection to time of their separation (plating date) were suitably incorporated for obtaining 210Po activity in the aerosol samples. Blank filters were also analysed for 210Po activity and was subtracted from the sample. The average 210Po activity in blank filters was 0.15±0.004 dpm (disintegrations per minute) compared to that in aerosol samples (Av: ~15.0 dpm). The 210Pb activity in few of the aerosol samples (n=30) was also measured by alpha-spectrometry. The 210Pb activity measured by alpha spectrometry exhibit a close agreement with that assessed by gamma spectrometry (slope = 0.98, R 2=0.66, n=30).
2.4. Back-trajectory analysis
The seven-day back-trajectory analysis was performed (at 500 m above ground level during October–February and 1000 m during March–June) to trace air masses arriving at Kanpur (). The air mass trajectories were computed from the final run data archive of Global Data Assimilation System (GDAS) model using National Oceanic and Atmospheric Administration (NOAA) Air Resource Laboratory Hybrid Single-Particle Lagrangian Integrated Trajectory (HYSPLIT) model (http://www.arl.noaa.gov/HYSPLIT) (Draxler and Rolph, Citation2003; Rolph, Citation2010). The back trajectories are computed for each one week during the entire sampling period, and a total of 50 back trajectories are computed during 2007–2009. The back trajectories are presented in and are grouped into three categories, namely long-range transport from the Desert areas (n=20, 40% of the total air masses; a), maritime (n=11, equivalent to 22%; b) and localised over the North India (n=19, 38% of the total; c). The long-range transport of air masses from Desert areas occurs during the late February–April and occasionally in January; whereas maritime air masses are characteristic of April–June. In contrast, the localised air masses are confined during October–November and in the wintertime. It is important to state that the aerosol sampling was not considered to be of relevance during the period of southwest monsoon (July–September).
3. Results and discussion
3.1. Temporal variability of 210Pb in ambient aerosols at Kanpur
The 210Pb activity in PM10 varied from 0.50±0.02 to 4.8±0.17 mBq m−3 (, Av: 1.8±1.1 mBq m−3; n=99). The average 210Pb activity at the sampling site (this study) is compared with other locations and summarised in . The 210Pb activity in ambient aerosols at Kanpur is relatively high compared to the reported data in the literature (typically in the range of 1.0–2.0 mBq m−3) (McNeary and Baskaran, Citation2003; Hammer et al., Citation2007; Rastogi and Sarin, Citation2008; May et al., Citation2009). The 210Pb activity, averaged for each month during the entire sampling period, is presented in . The 210Pb activity is significantly high during October–January and relatively low during March–June. The maximum activity of 210Pb, 4.8±0.17 mBq m−3 was observed in the samples collected during October–November.
Fig. 2. Temporal variability of 210Pb activity and carbonaceous species (EC, OC) in aerosols from Kanpur during the sampling period. The vertical dashed-line separates the seasons whereas the vertical bar indicates a break in the sampling.
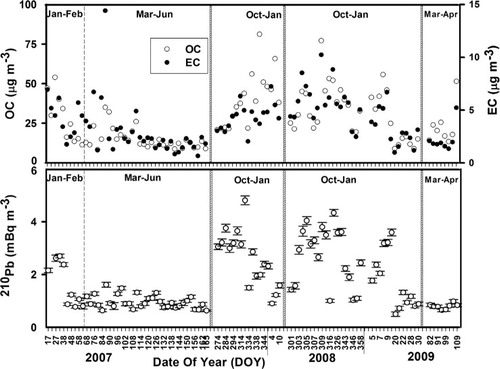
Fig. 3. Average 210Pb activity in urban aerosols during the sampling period. The vertical dash-lines indicate breaks in the aerosol sampling.
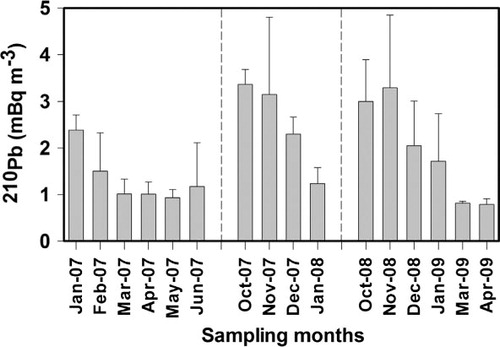
Table 1. 210Pb, 210Po and 210Po/210Pb activity ratios from an urban site (this study) are compared with the literature data. The values in the parenthesis represent average values.
The average 210Pb activity at Kanpur exhibits a strong seasonal variability, nearly 2–3 times higher activity in October–November and December–February compared to that in April–June ( and ). The seasonal variability in the 210Pb activity can be explained in terms of 226Ra content of regional soils, changes in the wind regimes and meteorological parameters (temperature, wind speed and boundary layer height). A remarkable similarity in the temporal variability for the abundance pattern of organic carbon (OC) and elemental carbon (EC) and 210Pb activity provides strong evidence that biomass burning emissions and boundary layer dynamics in the IGP are the dominant factors for the observed data (). It has been proposed that the uptake of radioactive species (including 226Ra, 238U, 210Po and 210Pb) by food crops and plants (Vasconcellos et al., Citation1987; Manigandan, Citation2009; Rego, Citation2011) and direct injection of 210Pb and 210Po from biomass burning emissions could contribute significantly to the atmosphere. We suggest that large-scale post-harvest biomass burning emissions could serve as an additional source of 210Pb and 210Po, during October–February, over the urban atmosphere in the Gangetic Plain (see further discussion in Section 3.3).
The 226Ra content of the regional soils also merits some discussion because of the emanation of the daughter nuclide 222Rn (t1/2=3.8 d) which subsequently decays to 210Pb. Studies on soil samples from different lithological units have suggested that the distribution of radionuclides depends on rock formation, their chemical properties and sample origin (Malakhov et al., Citation1966; Rao et al., Citation1996; Levin et al., Citation2002; Ramola et al., Citation2008; Baskaran, Citation2011). Rani and Singh (Citation2005) had reported that 226Ra concentration varied from 42.1 to 79.6 Bq kg−1 (Av: 57.3 Bq kg−1) in soil samples collected from nearby areas in Himachal Pradesh. A soil sample collected from a nearby location from Kanpur and analysed for 226Ra concentration shows significantly high level (182.6 Bq kg−1) compared to that in soils from other parts of Northern India. Another study conducted from Hamirpur (31.7°N, 76.5°E) and Rajasthan (26.7°N, 73.5°E) suggests lower 226Ra concentration in soils; the average 226Ra concentration in soils from Hamirpur is reported to be 44.2 Bq kg−1 and it ranges from 30 to 70 Bq kg−1 in Rajasthan (Singh et al., Citation2003). The entire stretch of the IGP is dominated by the intense agricultural activity and the use of fertilizers (urea: NH2CONH2; Ca3(PO4)2 and ZnSO4/PO4) are very common. These fertilizers can concentrate 238U and its daughter nuclides in the phosphate fraction. For example, phosphate rock samples and production of phosphate fertilizers, in Florida and Brazil, have reported high concentrations of 226Ra, 228Ra and 210Pb radionuclides (Menzel, Citation1968; Fukuma et al., Citation2000). The indoor measurements of 222Rn indicate higher concentrations (76 − 146 Bq m−3) in some parts of Northern India (Singh et al., Citation2005). However, based on the assay of 226Ra content in aerosol samples (as described in Section 2.2); we rule out any significant contribution of 210Pb from 226Ra via resuspension of regional soils.
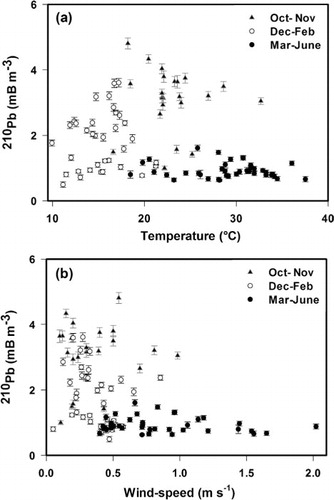
The wind-rose plots for post-monsoon (October–November), wintertime (December–February) and summer months (April–June) during the course of this study are shown in . The average wind speed during winter and October–November is about two to three times lower than that during April–June (Ram et al., Citation2010). The dependence of 210Pb activity on ambient temperature and wind speed is shown in . It can be seen that 210Pb activity is relatively high during October–November and December–February, with the persisting lower ambient temperature and wind-speed conditions. These conditions in the wintertime are sustained by the shallow boundary layer height (500–900 m) along the Gangetic Plain (Nair et al., Citation2007). The 222Rn activity in the ambient air has been used for estimating the planetary boundary layer dynamics and particularly the mixing height of regional pollutants (Malakhov et al., Citation1966; Levin et al., Citation2002; Zahorowski et al., Citation2005). This approach is usually adopted in view of the fact that the escape rate of 222Rn is nearly constant over the land areas (~1 atom cm−2 s−1) (Wilkening and Clements, Citation1975; Turekian and Graustein, Citation2003; Baskaran, Citation2011). A study reported in the literature has shown that the indoor 222Rn activity levels exhibit seasonal variability, with higher values during the wintertime compared to summertime (the average winter/summer ratio being 1.46) (Singh et al., Citation2005). It may, thus, be inferred that shallow boundary layer height during the wintertime could lead to an efficient trapping of chemical constituents (Ram et al., Citation2010), 222Rn and its decay products. In contrast, the time period of March–June is characterised by relatively high ambient temperature and wind speed, which can lead to unstable atmospheric conditions and more convective mixing. These meteorological conditions have led to decrease in concentrations of carbonaceous species and 210Pb activity (). Furthermore, inorganic species such as sulphate, nitrate and ammonium also exhibit a similar seasonal pattern, with lower concentrations in the summer (Ram et al., Citation2010).
Fig. 4. Seasonal wind-rose plot for the sampling period from January 2007 to April 2009: (a) October–November, (b) December–February and (c) March–June. The acronyms N, E, S and W refer to North, East, South and West directions, respectively.
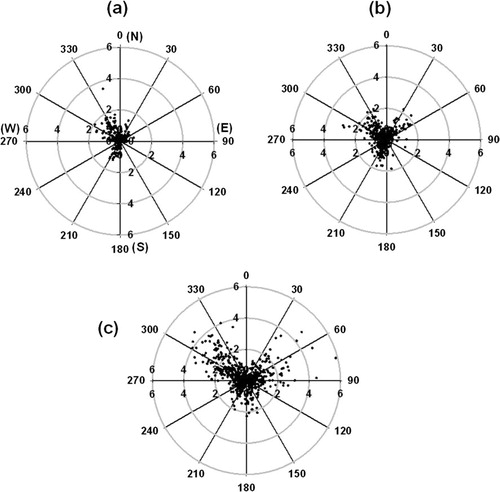
Fig. 5. The relationship between 210Pb activities with (a) ambient temperature and (b) wind speed in aerosols at Kanpur during the sampling period. The data for October–November (post-monsoon), winter (December–February) and summer (March–June) are shown separately. The lower temperature and wind-speed are typical of the wintertime conditions due to lower boundary layer height.
The seven-day back-trajectory analyses are performed for three different types of air masses (Section 2.4) arriving at Kanpur (), and average 210Pb activity associated with these air masses are presented in . The highest 210Pb activity is observed for the localised air masses (Av: 2.5±1.2 mBq m−3) which is two to three times higher than that associated with air masses from Desert areas and maritime air masses (). The majority of air masses are of continental origin with relatively low wind speed (Av: 0.4±0.3 ms−1) and are characterised by high 210Pb activity. In contrast, wind patterns in a show the dominance of south-westerly winds originating from the Desert regions of the Afghanistan and the Middle East. These source regions have depleted 210Pb activity. For example, Sayed et al. (Citation2002) had reported that 210Pb concentrations varied from 0.002 to 2.53 mBq m−3, with an average value of 0.896 mBq m−3 in the atmospheric aerosols collected at Kuwait. More recently, Ali et al. (Citation2011) have reported that 210Pb activities are lower in ambient aerosols (Av: 0.28±0.15 mBq m−3) at Islamabad.
Table 2. The average 210Pb activity in different types of air masses arriving at Kanpur during the sampling period
The annual average 210Pb activity in ambient aerosols at Ahmedabad (an urban site) and Mount Abu (a high-altitude site), located in western India, was reported to be 0.9±0.4 mBq m−3 and 0.8±0.4 mBq m−3, respectively (Rastogi and Sarin, Citation2008). The 210Pb activities were also lower in aerosol samples collected during summer months (0.33±0.11 mBq m−3 at Ahmedabad and 0.4±0.2 mBq m−3 at Mount Abu, respectively) (Rastogi and Sarin, Citation2008). The back-trajectory analyses during March − June suggest that air mass originates from oceanic regions (b) and is associated with lower 210Pb activity (0.9±0.2 mBq m−3) (). Likewise, air masses from the Desert regions of Afghanistan and the Middle East and oceanic regions are depleted in 210Pb.
3.2. 210Po in aerosols
The 210Po activity at Kanpur varied from 0.002±0.02 to 0.28±0.04 mBq m−3 () and is similar to that reported over Chinese regions, Poland and South Pole (Arimoto et al., Citation2004; Dlugosz et al., Citation2010). Dlugosz et al. (Citation2010) had reported that 210Po activity varied from 0.01 to 0.431 mBq m−3 in the urban air of the Polish city of Lodz, Poland, during the spring and winter seasons of 2008–2009. However, lower 210Po activity has been also reported in atmospheric aerosols (Poet et al., Citation1972; Duenas et al., Citation2004; Yi et al., Citation2007). In a study conducted over southeastern Michigan, 210Po activity ranged from below detection limit to 0.118 mBq m−3 in aerosol samples (McNeary and Baskaran, Citation2007). An inter-comparison of 210Po activity and 210Po/210Pb activity ratio in aerosol samples from different locations is presented in . The relatively high 210Po activity at Kanpur () suggests its contribution from other sources (see Section 3.3).
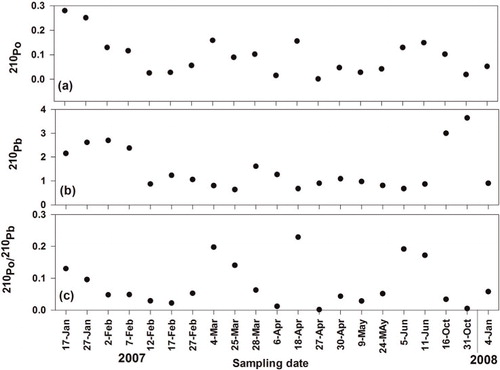
Fig. 6. Temporal plot of activities (in mBq m−3) of environmental nuclides: (a) 210Po, (b) 210Pb and (c) 210Po/210Pb activity ratio at the sampling site (Kanpur) in the Indo-Gangetic Plain.
3.3. Source (s) of 210Po activity at study site
The temporal variability in 210Po and 210Po/210Pb activity ratio is shown in . The relatively high 210Po activity is a characteristic feature seen during October–November and December–February when an increase in the source strength of biomass burning emissions with a simultaneous increase in abundances of carbonaceous species (EC, OC) and K+ is clearly evident (Ram et al., Citation2010). A maximum value of 0.23 for 210Po/210Pb activity ratio is recorded in the samples collected during the month of April ().
It is relevant to discuss other sources and direct emission of 210Po to the ambient atmosphere. It is well recognised that volcanic eruption can contribute significantly to atmospheric 210Po, as erupted lavas are characterised by high 210Po/210Pb activity ratio (Lambert et al., Citation1985). A small mass fraction of volcanic aerosols could, thus, lead to high levels of 210Po in the atmosphere. Likewise, emission of volatile species containing 210Po from sea-surface and coastal waters (associated with phytoplankton) is suggested as a possible source of 210Po to the atmosphere (Kim et al., Citation2000). In this study, the sampling site is far away from an active zone of volcanic activity (the nearest one is in Andaman Island); we, thus, rule out any contribution of 210Po from volcanic emissions.
Biomass burning emissions have been suggested as a potential source of 210Po in the atmosphere (Francis et al., Citation1968; LeCloarec et al., Citation1995; Nho et al., Citation1996). Both 210Po and 210Pb enter into plant material through the root uptake of their activity levels present in the soils. The accumulation of 210Pb and 210Po can lead to significant activity levels in plant tissues. Recently, Manigandan (Citation2009) has studied the transfer of natural radionuclides from soil to plants in the tropical forest of Western Ghats in India and reported that the activity levels of 210Po and 238U in plants and soil reflected the impact of the igneous nature of rocks in the study area. Interestingly, this study has reported that the 210Po activity levels are relatively higher than that of 238U in most of the samples (soil as well as plants). Furthermore, the concentration ratio (defined as the activity ratio in plant to that in soil) for 210Po was relatively higher than that for 238U, suggesting greater transfer of Po than U in plants. It was also concluded that the amount of radionuclides in different plant species (by uptake) depends on the substrate concentration, nature of the plants and ageing of the plant. Being volatile in nature, a significant amount of 210Po from plant tissues is released back to the atmosphere during biomass burning emissions. It is well documented that the strength of biomass burning emissions contributes significantly to the aerosol composition during the wintertime in the IGP (Rengarajan et al., Citation2007; Gustafsson et al., Citation2009; Ram et al., Citation2010).
Emissions from coal combustion have been also identified as a dominant anthropogenic source of 210Po in Seoul, Korea (Kim et al., Citation2005). However, the contribution from coal emissions to carbonaceous aerosols and 210Po is not relevant in the absence of any major coal-based power plants and industrial units located upwind of the sampling site (Kanpur). It is important to reiterate that biomass burning emissions overwhelm the chemical composition of carbonaceous aerosols in the IGP (Rengarajan et al., Citation2007; Ram et al., Citation2010). As argued in the preceding sections that 210Pb and 210Po exhibit pronounced seasonal pattern similar to that documented for carbonaceous species (), it is, thus, inferred that biomass burning emissions contribute significantly to atmospheric 210Po during wintertime at the study site.
4. Conclusion and implication
The atmospheric 210Pb and 210Po activities studied in urban aerosols from the IGP suggest large temporal variability, with significantly high activity levels in the wintertime. The characteristic seasonal pattern of biomass burning emissions (dominated by agricultural-waste burning) in the wintertime, a shallow boundary layer height and efficient trapping of pollutants (EC, OC and inorganic constituents) are the dominant factors for significantly high 210Pb and 210Po activities in the IGP.
This study provides an important data-set on 210Pb and 210Po activities for the Global Atmospheric Watch Programme. The 210Pb activity at Kanpur (26.5°N), representing central region of the IGP, is three times higher than the model derived value at this latitude; suggesting the importance of regional lithology (soil characteristics) and environmental factors (meteorology and emission sources) in the model calculations.
5. Acknowledgements
The authors thank ISRO-GBP Programme office (Bangaluru, India) for the financial support during the course of this study. The authors thank S.N. Tripathi for extending logistic support for aerosol sampling needs at the study site. We are grateful to one of the reviewers for the constructive comments and suggestions.
References
- Ali, N, Khan, E. U, Akhter, P, Khattak, N. U, Khan, F. and co-authors. 2011. The effect of air mass origin on the ambient concentrations of 7Be and 210Pb in Islamabad, Pakistan. J. Environ. Radioact. 102: 35–42.
- Arimoto, R, Hogan, A, Grube, P, Davis, D, Webb, J. and co-authors. 2004. Major ions and radionuclides in aerosol particles from the South Pole during ISCAT-2000. Atmos. Environ. 38(32): 5473–5484.
- Baskaran M. Po-210 and Pb-210 as atmospheric tracers and global atmospheric Pb-210 fallout: a Review. J. Environ. Radioact. 2011; 102(5): 500–513.
- Baskaran M, Shaw G. E. Residence time of arctic haze aerosols using the concentrations and activity ratios of 210Po, 210Pb and 7Be. J. Aerosol Sci. 2001; 32(4): 443–452.
- Dlugosz M, Grabowski P, Bem H. 210Pb and 210Po radionuclides in the urban air of Lodz, Poland. Atmos. Environ. 2010; 283(3): 719–725.
- Draxler, R. R and Rolph, G. D. 2003. HYSPLIT (HYbrid Single-Particle Lagrangian Integrated Trajectory). NOAA Air Resources Laboratory, Silver Spring, MD. Model access via NOAA ARL READY Website, Online at: http://www.arl.noaa.gov/ready/hysplit4.html.
- Duenas C, Fernandez M. C, Carretero J, Liger E, Canete S. Long-term variation of the concentrations of long-lived Rn descendants and cosmogenic 7Be and determination of the MRT of aerosols. 2004; 38(9): 1291–1301.
- Francis C. W, Chesters G, Erhardt W. H. Polonium-210 entry into plants. Atmos. Environ. 1968; 2(9): 690–695.
- Fukuma H. T, Fernandes E. A. N, Quinelato A. L. Distribution of natural radionuclides during the processing of phosphate rock from Itataia-Brazil for production of phosphoric acid and uranium concentrate. Environ. Sci. Technol. 2000; 88: 809.
- Gaggeler H. W, Jost D. T, Baltensperger U, Schwikowski M, Seibert P. Radon and thoron decay product and 210Pb measurements at Jungfraujoch, Switzerland. Radiochimica Acta. 1995; 29(5): 607–616.
- Gustafsson, Ö, Kruså, M, Zencak, Z, Sheesley, R.J, Granat, L. and co-authors. 2009. Brown clouds over South Asia: biomass or fossil fuel combustion?. Atmos. Environ. 323: 495–498.
- Hammer, S, Wagenbach, D, Preunkert, S, Pio, C, Schlosser, C. and co-authors. 2007. Lead-210 observations within CARBOSOL: a diagnostic tool for assessing the spatiotemporal variability of related chemical aerosol species?. Science. 112: D23S03, 10.3402/tellusb.v64i0.17513.
- Kim, G, Hong, Y., -L.,Jang, J, Lee, I, Hwang, D.-W. and co-authors. 2005. Evidence for anthropogenic 210Po in the urban atmosphere of Seoul Korea. J. Geophys. Res. 39(6): 1519–1522.
- Kim G, Hussain N, Church T. M. Excess 210Po in the coastal atmosphere. Environ. Sci. Technol. 2000; 52(1): 74–80.
- Kritz M. A, Rosner S. W, Danielsen E. F, Selkirk H. B. Air mass origins and troposphere-to-stratosphere exchange associated with midlatitude cyclogenesis and tropopause folding inferred from 7Be measurements. Tellus-B. 1991; 96: 17405–17414.
- Lambert G, Le Cloarec M. F, Ardouin B, Le Roulley J. C. Volcanic emission of radionuclides and magma dynamics. J. Geophys. Res. 1985; 76(1–2): 185–192.
- LeCloarec, M. F, Ardouin, B, Cachier, H, Liousse, C, Neveu, S. and co-authors. 1995. 210Po in savanna burning plumes. Earth Planet. Sci. Lett. 22(1–2): 111–122.
- Levin, I, Born, M, Cuntz, M, LangendÖRfer, U, Mantsch, S. and co-authors. 2002. Observations of atmospheric variability and soil exhalation rate of radon-222 at a Russian forest site. Technical approach and deployment for boundary layer studies. J. Atmos. Chem. 54(5): 462–475.
- Liu, H, Jacob, D. J, Dibb, J. E, Fiore, A. M and Yantosca, R. M. 2004. Constraints on the sources of tropospheric ozone from 210Pb-7Be-O3 correlations. Tellus B. 109(7): D073061–15.
- Lozano, R. L, San Miguel, E. G and Bolívar, J. P. 2011. Assessment of the influence of in situ 210Bi in the calculation of in situ 210Po in air aerosols: Implications on residence time calculations using 210Po/210Pb activity ratios. J. Geophys. Res. 116: D08206. 10.3402/tellusb.v64i0.17513.
- Malakhov, S. G, Bakulin, V. N, Dmitrieva, G. V, Kirichenko, L. V, Ssissigina, T.I. and co-authors. 1966. Diurnal variations of radon and thoron decay product concentrations in the surface layer of the atmosphere and their washout by precipitations. J. Geophys. Res. 18: 643–654.
- Manigandan P. K. Transfer of natural radionuclides from soil to plants in tropical forest (Western Ghats – India). Tellus-B. 2009; 4(5): 285–289.
- Marley, N. A, Gaffney, J. S, Drayton, P. J, Cunningham, M. M, Orlandini, K. A. and co-authors. 2000. Measurement of 210Pb, 210Po, and 210Bi in size-fractionated atmospheric aerosols: an estimate of fine-aerosol residence times. Aerosol Sci. Technol. 32( 6), 569–583.
- May, B, Wagenbach, D, Hammer, S, Steier, P, Puxbaum, H. and co-authors. 2009. The anthropogenic influence on carbonaceous aerosol in the European background. , 61(2): 464–472.
- McNeary, D and Baskaran, M. 2003. Depositional characteristics of 7Be and 210Pb in southeastern Michigan. Tellus-B. 108: 4220. 10.3402/tellusb.v64i0.17513.
- McNeary, D and Baskaran, M. 2007. Residence times and temporal variations of 210Po in aerosols and precipitation from southeastern Michigan, United States. J. Geophys. Res. 112: D04208. 10.3402/tellusb.v64i0.17513.
- Menzel R. G. Uranium, radium, and thorium content in phosphate rocks and their possible radiation hazard. J. Geophys. Res. 1968; 16(2): 231–234.
- Nair, V. S, Moorthy, K. K, Alappattu, D. P, Kunhikrishnan, P. K, George, S. and co-authors. 2007. Wintertime aerosol characteristics over the Indo-Gangetic Plain (IGP): impacts of local boundary layer processes and long-range transport. J. Agric. Food Chem. 112: D13205. 10.3402/tellusb.v64i0.17513.
- Nho E.-Y, Ardouin B, Le Cloarec M. F, Ramonet M. Origins of 210Po in the atmosphere at Lamto, Ivory Coast: biomass burning and Saharan dusts. J. Geophys. Res. 1996; 30(22): 3705–3714.
- Nho E.-Y, Le Cloarec M.-F, Ardouin B, Ramonet M. 210Po, an atmospheric tracer of long-range transport of volcanic plumes. Atmos. Environ. 1997; 49(4): 429–438.
- Papastefanou C. Residence time of tropospheric aerosols in association with radioactive nuclides. Tellus-B. 2006; 64(1): 93–100.
- Poet S. E, Moore H. E, Martell E. A. Lead-210, bismuth-210, and polonium-210 in the atmosphere: Accurate ratio measurement and application to aerosol residence time determinationx. Appl. Radiat. Isot. 1972; 77(33): 6515–6527.
- Peirson D. H, Cambray R. S, Spicer G. S. Lead-210 and polonium-210 in the atmosphere. Appl. Radiat. Res. 1966; 18(2): 427–433.
- Ram, K, Sarin, M. M and Tripathi, S. N. 2010. A 1 year record of carbonaceous aerosols from an urban location (Kanpur) in the Indo-Gangetic Plain: characterization, sources and temporal variability. J. Geophys. Res. 115: D24313. 10.3402/tellusb.v64i0.17513.
- Ramola, R. C, Gusain, G. S, Badoni, M, Prasad, Y, Prasad, G. and co-authors. 2008. 226Ra, 232Th and 40K contents in soil samples from Garhwal Himalaya, India, and its radiological implications. J. Radiol. Prot. 28(3). 10.3402/tellusb.v64i0.17513.
- Rani A, Singh S. Natural radioactivity levels in soil samples from some areas of Himachal Pradesh, India using g-ray spectrometry. J. Environ. Radioact. 2005; 39: 6306–6314.
- Rangarajan C. A study of the mean residence time of the natural radioactive aerosols in the planetary boundary layer. Tellus-B. 1992; 15(3): 193–206.
- Rangarajan C, Eapen C. D. The use of natural radioactive tracers in a study of atmospheric residence times. Radiation Protect. Dosimetry. 1990; 42(1): 142–147.
- Rao M. V. N, Bhati S. S, Seshu P. R, Reddy A. R. Natural radioactivity in soil and radiation levels of Rajasthan. J. Geophys. Res. 1996; 63(3): 207–216.
- Rastogi, N and Sarin, M. M. 2008. Atmospheric 210Pb and 7Be in ambient aerosols over low- and high-altitude sites in semiarid region: temporal variability and transport processes. Scientific American. 113( D11103). 10.3402/tellusb.v64i0.17513.
- Rego, B. 2011. Radioactive smoke: a dangerous isotope lurks in cigarettes. J. Geophys. Res. 78–81. http://www.scientificamerican.com/article.cfm?id=radioactive-smoke.
- Rengarajan, R, Sarin, M. M and Sudheer, A. K. 2007. Carbonaceous and inorganic species in atmospheric aerosols during wintertime over urban and high-altitude sites in North India. 112: D21307. 10.3402/tellusb.v64i0.17513.
- Rolph, G. D. 2010. Real-time environmental applications and display system (READY). NOAA Air Resources Laboratory, Silver Spring, MD. Online at: http://ready.arl.noaa.gov.
- Sarin M. M, Rengarajan R, Krishnaswami S. Aerosol NO3- and 210Pb distribution over the central-eastern Arabian Sea and their air-sea deposition fluxes. Environ. Monitor. Assess. 1999; 51(2): 749–758.
- Sayed A. M, Al-Azmi D, Khuraibet N. A. Measurements of 210Pb concentrations in airborne in Kuwait. Atmos. Environ. 2002; 79(1): 47–55.
- Singh S, Mehra R, Singh K. Seasonal variation of indoor radon in dwellings of Malwa region, Punjab. Radiat. Meas. 2005; 39: 7761–7767.
- Singh S, Singh B, Kumar A. Natural radioactivity measurements in soil samples from Hamirpur district, Himachal Pradesh, India. 2003; 36: 547–549.
- Turekian, K. K and Graustein, W. C. 2003. Natural Radionuclides in the Atmosphere, Treatise on Geochemistry. (eds. H. D.Holland, K. K.TurekianVol. 4: Elsevier-Pergamon: Oxford, pp. 261–79.
- Vasconcellos L. M. H, Amaral E. C. S, Vianna M. E, Penna Franca E. Uptake of 226Ra and 210Pb by food crops cultivated in a region of high natural radioactivity in Brazil. J. Geophys. Res. 1987; 5(4): 287–302.
- Wilkening M. H, Clements W. E. Radon 222 from the ocean surface. J. Radioanal. Nucl. Chem. 1975; 80(27): 3828–3830.
- Yi Y, Zhou P, Liu G. Atmospheric deposition fluxes of 7Be, 210Pb and 210Po at Xiamen, China. Tellus-B. 2007; 273(1): 157–162.
- Zahorowski, W, Chambers, S, Wang, T, Kang, C.-H, Uno, I. and co-authors. 2005. Radon-222 in boundary layer and free tropospheric continental outflow events at three ACE-Asia sites. Tellus. 57(2): 124–140.