ABSTRACT
Emissions of CO, CH4 and CO2 in East Asia were estimated using the atmospheric concentration of 222Rn measured at Minamitorishima (MNM) and Yonagunijima (YON) with a high-precision 222Rn measuring system. The 222Rn measurements showed a distinct seasonal variation, as well as enhanced 222Rn (ERN) events associated with high-frequency synoptic variations. The enhancements of CO, CH4 and CO2 coincided with the ERN events at MNM and YON. The enhancement ratios ΔCH4/ΔRn, ΔCO2/ΔRn and ΔCO/ΔRn calculated for the ERN events and corrected for the radioactive decay of 222Rn during the transport were used to estimate the emissions of CO, CH4 and CO2 by multiplying a constant 222Rn exhalation rate of 1.0 atom cm−2 s−1 and the associated catchment area estimated by a 3D transport model. By modifying the categorisation of the sources, the 222Rn-derived emissions of CO2 and CH4 were found to be in agreement with the published emission databases. As for the CO emission, results of our study were consistent with the REAS CO emission database but showed that the EDGAR database underestimates the CO emission over East Asia by about 44%. It is demonstrated that the 222Rn tracer method used in this study could provide a useful and independent tool to verify the trace gas emissions in East Asia.
1. Introduction
Anthropogenic emissions from East Asia have been rapidly increasing in recent decades as the economy and the population in Asian countries have been growing rapidly (Akimoto, Citation2003). Both the atmospheric environment of the source regions and of the downwind areas over the western North Pacific have deteriorated due to gaseous pollutants emitted from the East Asian continent, particularly from the east coast of China (Tanimoto et al., Citation2005). Furthermore, several studies have provided observational evidence of deteriorating air quality over certain regions of North America due to the long-range transport of polluted air masses from Asia (e.g. Andreae et al., Citation1988; Parrish et al., Citation1992; Husar et al., Citation2001).
However, the magnitude of anthropogenic emissions of trace gases like CO from East Asia is not yet well quantified. In particular, emission estimates from burning are characterised by large uncertainties due to variability in the burning of fossil fuel, biofuel and biomass in space and time. Bottom-up estimates of the anthropogenic gas emission for East Asia have been derived from the socio-economic data to create several emission databases, such as the Streets inventory (Streets et al., Citation2003), the Intercontinental Chemical Transport Experiment-Phase B (INTEX-B) emission inventory (Zhang et al., Citation2009), the Regional Emission inventory in Asia (REAS) (Ohara et al., Citation2007), the Emission Database for Global Atmospheric Research (EDGAR) (Olivier et al., Citation2005) and the Carbon Dioxide Information on Climate Change (CDIAC) (Marland et al., Citation2008). Top-down approaches (such as inverse modelling) have also been used to obtain anthropogenic emission estimates for Asia. In this approach, a trace gas in a chemistry transport model is driven by a specified a priori bottom-up emission. The emission field is then modified by minimising the difference between the observed and the simulated concentration of the trace gas in the atmosphere (Heald et al., Citation2004; Kopacz et al., Citation2009; Hooghiemstra et al., Citation2011). However, there are significant disagreements between the bottom-up and inverse modelling emission estimates for East Asia (Heald et al., Citation2004; Palmer et al., Citation2006). These disagreements are caused by substantial uncertainties resulting from insufficient knowledge about the source regions and emission factors (applied to the socio-economic data) for the bottom-up inventories, while uncertainties associated with transport processes of polluted air masses contribute to large errors in the inverse modelling results. The objective of the present study is to attempt to reduce the disagreement between these two approaches using atmospheric radon measurements downstream from the emission regions as an independent method.
Radon tracer method is a useful method to estimate emissions of trace gases. Radon-222 (222Rn) has been used to parameterise atmospheric transport and dilution of ground level emissions of trace gases in the atmospheric surface layer in Europe (Kuhlmann et al., Citation1998; Schmidt et al., Citation2001; Schmidt et al., Citation2003). 222Rn is a radioactive noble gas with a half-life of 3.824 d (e-folding time τ =5.52 d) and is produced by the decay of radium-226 buried in the soil. 222Rn exhalation from soils has been found to be relatively homogeneous over a certain-sized region and nearly constant with time, an assumption shown to be relatively robust from several transport model simulations (e.g. Jacob et al., Citation1997; Taguchi et al., Citation2002b; Taguchi et al., Citation2011). The exhalation rate from the ocean is about two orders of magnitude smaller than that from soils (Wilkening and Clements, Citation1975). Given these characteristics, 222Rn is a useful tracer for air masses originating from the land. However, before we can actually apply 222Rn as a tracer to estimate trace gas emissions, we need to establish and clarify the emission relationship between 222Rn and trace gases.
The National Institute of Advanced Industrial Science and Technology (AIST) and the Meteorological Research Institute (MRI) in Japan have developed a high-precision 222Rn measuring system (Wada et al., Citation2010) and have successfully deployed it to measure atmospheric concentration of 222Rn on the ground at remote sites in the western North Pacific for more than 3 yrs. In addition, the Japan Meteorological Agency (JMA) has been simultaneously measuring atmospheric concentrations of carbon monoxide (CO), methane (CH4) and carbon dioxide (CO2) at the same sites for more than a decade (Watanabe et al., Citation2000; Tsutsumi et al., Citation2006; Wada et al., Citation2007; Wada et al., Citation2011). Wada et al. (Citation2011) showed that a combustion-related enhancement ratio of CO to CO2 observed at these sites depended on the emission ratio of CO to CO2 in East Asia. These results strongly indicated that the emission ratios of the trace gases emitted from East Asia are conserved in the enhancement ratios observed at these sites.
In this study, we show observational results of atmospheric 222Rn and trace gases at remote sites in the western North Pacific and highlight the relationship between 222Rn and the trace gases. We then use this relationship to estimate the emissions of CO, CH4 and CO2 in East Asia and compare them to the existing emission databases.
2. Sampling and analytical methods
2.1. Sampling sites
JMA is operating three atmospheric monitoring stations at Minamitorishima (MNM) (24.3°N, 154.0°E, 8 m above sea level) and Yonagunijima (YON) (24.5°N, 123.0°E, 30 m above sea level) under the Global Atmosphere Watch programme of the World Meteorological Organization (WMO/GAW) ().
Fig. 1. Geographical locations of the observational sites of Minamitorishima (MNM) and Yonagunijima (YON).
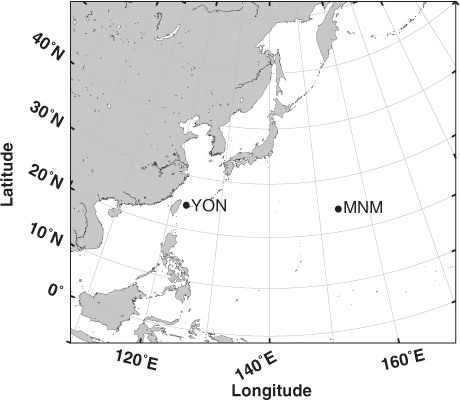
MNM is a remote coral island in the western North Pacific, about 2000 km southeast of Tokyo. At this site, easterly winds associated with the maritime air masses prevail much of the year, except in the winter season, when the continental air masses from East Asia are transported by synoptic-scale weather systems. Since this island is very small, about 1.4 km2 with a population of about 50 people, the influence of local sources and sinks on the trace gas measurement is negligible (Wada et al., Citation2007).
YON is a remote island located 111 km east from Taiwan. At this site, northeasterly winds associated with the continental high pressure system prevail, except in the summer when southerly winds associated with the maritime air masses dominate the site. Although the island is located at the same latitude as MNM, YON is positioned much closer to the downwind of the Asian continent (), thus it is more frequently influenced by the heavily polluted air masses from Asia (Tsutsumi et al., Citation2006). Since the island is small, less populated and lightly trafficked, local influence on the measurements is not significant.
2.2. Measuring method
The 222Rn analyser used in this study was developed by AIST and MRI (Wada et al., Citation2010) for precise measurement of the atmospheric 222Rn concentration. It is based on the electrostatic collection method that collects positively charged progenies of 222Rn in the sampling air on the PIN photodiode for an alpha particle detector charged high negative voltage. It automatically allows continuous measurements so that we can calculate hourly mean data. Calibration of this analyser has been made at Nagoya University; the details of the method are described elsewhere (Iida et al., Citation1991; Iida et al., Citation1996). The detection limit of this measuring system is 0.16 Bq m−3 for hourly mean data.
The measurement of atmospheric 222Rn by the above analyser has been made at MNM since September 2007. At YON, the same system was installed in November 2008. Our current sampling method is a commonly used one for the greenhouse gas observation (Wada et al., Citation2007; Wada et al., Citation2010). Air is sampled at the top of a 10 m observational tower. After drying by the electric cooling units and the membrane tube dryers, the sample air is introduced into the 222Rn analyser at a flow rate of 3.0 L min−1 at both sites.
The concentrations of CO and CH4 were measured continuously using a nondispersive infrared analyser (NDIR: GA-360S, Horiba, Ltd., Japan) with a precision of±5 ppb. The concentration of CH4 in the sample air is reported on the JMA primary standard scale (Matsueda et al., Citation2004a), which is similar to the WMO CH4 mole fraction scale maintained by the National Oceanic and Atmospheric Administration/Global Monitoring Division (NOAA/GMD, formerly NOAA/CMDL) (Dlugokencky et al., Citation2005). The concentration of CO in the sample air is based on the standard gases assigned by the Chemicals Evaluation and Research Institute of Japan. Recently, the measuring system for CO and CH4 has been improved by using a gas chromatograph (TRA-1, Round Science Inc. for CO, RGC-1, Round Science Inc. for CH4) with a precision of±2 ppb (for both trace gases) installed at YON since 2008 and at MNM since 2010. The standard gases to calibrate the analysers are traceable to the WMO mole fraction scale.
The concentration of CO2 was measured using an NDIR (VIA510R, Horiba, Ltd., Japan) with a precision of ±0.02 ppm. Recently, the measuring system has been changed by replacing the NDIR with a new NDIR (LI-7000 LI-COR Inc.) with a precision of ±0.02 ppm, and was installed at YON in 2008 and at MNM in 2010. All CO2 measurements used here were re-calculated for consistency with the WMO CO2 mole fraction scale of the NOAA/GMD (Matsueda et al., Citation2004b).
2.3. 3-D chemical transport model
A 3-D chemical transport model called Simulator of Trace Atmospheric Constituent on a Global scale (STAG) developed by AIST (Taguchi, Citation1996; Taguchi et al., Citation2002a) was used in this study. This model, which consists of 28 sigma vertical levels with T63 (equivalent to 1.875°×1.875° resolution) horizontal grid, is driven every 6 hours using the meteorological reanalysis data provided by the NOAA-CIRES Climate Diagnostics Center at their website (http://www.cdc.noaa.gov/). The boundary layer stability at each time step is estimated from the bulk Richardson number (Troen and Mahrt, Citation1986) and is used to calculate the boundary layer height and the uniform distribution of trace gases concentrations in the layer. The basic performance of the model has been evaluated using 222Rn concentrations (Taguchi et al., Citation2002b).
The emanation rate of 222Rn was given a value of 1.0 atoms cm−2 s−1 for all of the land areas between 60°S and 60°N, and 0.5 atoms cm−2 s−1 for the land areas between 60°N and 70°N, excluding Greenland, with no temporal variation (Jacob et al., Citation1997; Taguchi et al., Citation2002b; Taguchi et al., Citation2011). The emanation rate of 222Rn from the ocean was set to 0 atoms cm−2 s−1, since we were interested only in the short-term variations of the atmospheric 222Rn concentration. However, 222Rn flux from the ocean could affect the background concentration of atmospheric 222Rn in the marine boundary layer (Jacob et al., Citation1997; Taguchi et al., Citation2002b).
3. Results
3.1. Observational data
shows hourly mean concentrations of atmospheric 222Rn observed at MNM and YON. The observed temporal variations of the 222Rn concentration at two stations clearly show a distinct seasonal cycle, as well as high-frequency synoptic variations. No significant long-term trend was found at these stations. also shows monthly mean 222Rn concentrations at MNM and YON. A similar seasonal cycle was observed at MNM and YON, with a maximum in the winter season around December–January and a minimum in the summer season around July–September. The seasonal amplitude of about 1 Bq m−3 was observed at YON, while MNM showed a smaller seasonal amplitude of about 0.7 Bq m−3. It is noted that the summer minimum at MNM with a very low value of less than 0.2 Bq m−3 is similar in magnitude to the one observed at Mauna Loa (Zahorowski et al., Citation2005), indicating the value to be a baseline concentration over the western North Pacific. A similar seasonal cycle pattern was also observed at sites located on the coastal regions such as Hok Tsui in Hong Kong, Gosan in Korea and Sado in Japan (Zahorowski et al., Citation2005; Chambers et al., Citation2009), as well as two Pacific island stations of Hachijo-jima and Hateruma-jima (Moriizumi et al., Citation2008; Ohkura et al., Citation2009). These results strongly suggest that the observed 222Rn seasonal cycles at various locations are influenced primarily by the seasonal exchange of continental and maritime air masses over the western North Pacific.
Fig. 2. Hourly mean observed atmospheric 222Rn concentration at MNM (a), YON (b). White circles indicate monthly mean concentration of 222Rn calculated from hourly mean data.
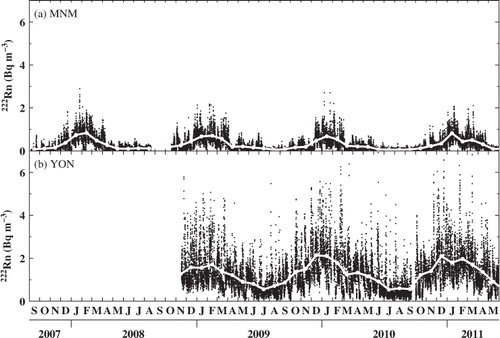
No significant diurnal cycle was observed at MNM and YON, indicating no impact of local emissions on the 222Rn measurements at these island stations.
3.2. Enhanced 222Rn events
The observed 222Rn at two stations clearly reveal the numerous synoptic variations consisting of episodically enhanced 222Rn peaks on timescales less than one week (). These peaks are caused by the influence of continental air masses because no local sources have been found around both of these stations that would produce such peaks. Based on the preliminary results obtained at MNM, these 222Rn peaks showed high correlation with the synoptic scale variation of CO observed simultaneously at the station (Wada et al., Citation2010). This provided the motivation to investigate the detailed relationship between 222Rn and other trace gases.
shows detailed variations of 222Rn observed at MNM in January 2010, compared with those of CH4, CO2 and CO. During this time period, 10 enhanced 222Rn events were identified. Concentrations of other trace gases also increased in concert with 222Rn during these events. Similar enhancements of CH4, CO2 and CO associated with increased 222Rn for the events were also found in other seasons at MNM, as well as at YON. Surface weather charts and observed meteorological data indicated that a cold front passed over the stations each time a 222Rn peak was observed. This transport mechanism is consistent with the cold frontal transport process of well-mixed polluted air masses with high concentrations of CO from the Asian continent to the western North Pacific region (Sawa et al., Citation2007). These results suggest that 222Rn is well mixed with other trace gases in the polluted air masses over the Asian continent and is advected by the same transport mechanism that transports other trace gases to the western North Pacific region.
Fig. 3. Time series of hourly mean concentrations of atmospheric 222Rn, CH4, CO2 and CO observed at MNM in January 2010. Arrows point to the peak of each enhanced 222Rn event. The dashed and solid lines for 222Rn (top panel) are the smoothed fitting curve and the upper threshold of smaller ΔRn variability, respectively. The black and grey dots represent the enhanced 222Rn (ERN) events and non-enhanced events, respectively (see text). The black dots for other gases relate to the corresponding periods of the ERN events.
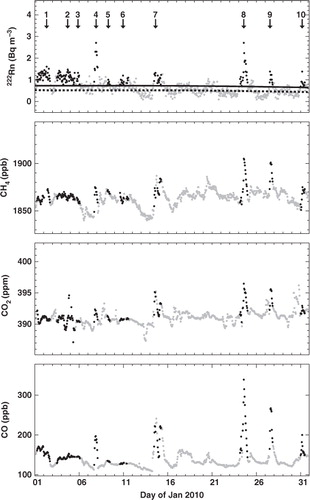
To identify the enhanced 222Rn peaks in the observed time series, the same procedures as described in Wada et al. (Citation2011) were used to extract synoptic variations. The differences between the hourly observed data and the smoothed seasonal curve were calculated as residual 222Rn (ΔRn). Positive ΔRn peaks that were identified as enhanced 222Rn (ERN) events were chosen based on the following criteria: (1) ΔRn≥2σ from the fitted curve, where σ was calculated from the negative ΔRn in each month, and (2) ΔRn event lasted for more than 4 hours. Following these criteria, 290 and 287 ERN events were identified in the MNM data (September 2007–May 2011) and in the YON data (November 2008–May 2011), respectively.
3.3. Correlation of trace gases with 222Rn and radioactive decay during transport
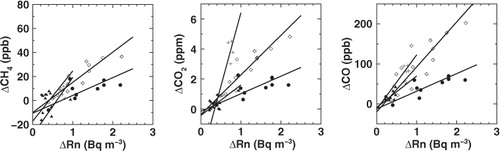
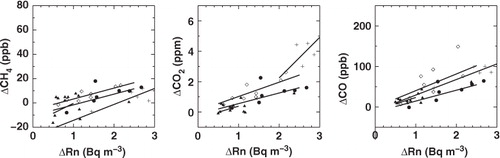
To determine the enhancement ratios of the trace gases and 222Rn, slopes of ΔRn with ΔCH4, ΔCO2 and ΔCO were calculated for each ERN event. The values of ΔCH4, ΔCO2 and ΔCO were determined using the same method that was used for ΔRn. shows scatter plots of the enhanced trace gas correlations and their slopes for the four ERN events (ERN-4, 7, 8 and 10) observed at MNM in January 2010. These four events were selected because they showed correlation coefficients greater than 0.5 and were used for the emission estimate described in section 4.3. Since these high correlations between the trace gases and 222Rn were found during the ERN events, their slopes were obtained by using the reduced major axis (RMA) method (Hirsch and Gilroy, Citation1984). The slope of the enhanced values is denoted as ΔCH4/ΔRn, ΔCO2/ΔRn and ΔCO/ΔRn. Note that the units of ΔCH4/ΔRn and ΔCO/ΔRn are in ppb (Bq m−3) −1 and that of ΔCO2/ΔRn in ppm (Bq m−3) −1.
Fig. 4. Scatter plots of ΔCH4, ΔCO2 and ΔCO as a function of ΔRn observed at MNM in January 2010. The circles, crosses, diamonds and triangles represent enhanced 222Rn events of 4, 7, 8 and 10 in , respectively. The solid line represents the RMA regression for each event.
The enhancement ratios of ΔCH4/ΔRn, ΔCO2/ΔRn and ΔCO/ΔRn depended on the nature of each ERN event (), but they were not corrected for the 222Rn radioactive decay during the transport from the continent to the station. Thus, they were re-calculated using the decay-corrected ΔRn.
The transit time of the long-range transport (from the Asian continental coast to each station) was estimated based on the 20-d backward trajectories; less than 2% of the ERN events at MNM and YON were not included in the analysis because no trajectories from the stations made contact with the continent during the 20-d period. The transit time at MNM shows a distinct seasonal variation with a short traveling time of around 100 hours in the winter and a long traveling time of around 250 hours in the summer. On the other hand, a short transit time of around 50 hours at YON shows no clear seasonal difference. At both MNM and YON, the variability in the estimated transit time is significantly smaller in the winter than in the summer, indicating almost the same transport pathway for the ERN events at both stations in the winter.
Using the estimated transit time, the radioactive decay during the transport could be calculated to obtain for each ERN event a decay-corrected ΔRn concentration, which is defined as the accumulated 222Rn over the continent before being exported to the oceanic region.
3.4. Decay-corrected enhancement ratio of trace gases to 222Rn
shows the correlation plots between the trace gases and the decay-corrected ΔRn for the four ERN events (ERN-4, 7, 8 and 10) at MNM in January 2010. The decay-corrected ΔRn was calculated by the radioactive half-life and the transit time estimated from the trajectory analysis. Note that the chemical losses of CO and CH4 due to OH radical reactions during the transport were also corrected according to the same method described in Wada et al. (Citation2011), although their photochemical losses were much smaller than the radioactive decay of ΔRn especially in the winter. Since these enhancement ratios represent the ratios before the long-range transport over the Pacific Ocean, we refer to them hereafter as the ‘preformed’ enhancement ratios. The preformed enhancement ratios of ΔCH4/ΔRn, ΔCO2/ΔRn and ΔCO/ΔRn are significantly reduced compared with the ratios observed at MNM. Furthermore, it is seen that the preformed enhancement ratio values are similar in magnitude, in contrast to the observed ratios of the corresponding ERN events (). These results indicate that the enhancement ratios associated with these ERN events changed mainly due to the radioactive decay of 222Rn during transport. Thus, the preformed enhancement ratios should be used when we deduce the impact of the continental source regions on the ERN events.
Fig. 5. Scatter plots of ΔCH4, ΔCO2 and ΔCO as a function of decay-corrected ΔRn of the event of 4, 7, 8 and 10 in . The solid lines represent the RMA regressions for each plot.
To examine the variability of the enhancement ratios of trace gases with respect to 222Rn, ΔCH4/ΔRn, ΔCO2/ΔRn and ΔCO/ΔRn were calculated for all the ERN events at MNM and YON. We also estimated their corresponding preformed enhancement ratios. shows the frequency distributions of ΔCH4/ΔRn, ΔCO2/ΔRn and ΔCO/ΔRn observed for the ERN events at MNM and YON, together with their preformed enhancement ratios indicated as grey bars. In this figure, only the data with correlation coefficients greater than 0.5 were used. This data selection process reduced the data to 15–18% for MNM and 15–22% for YON of the total original data. Furthermore, the frequency distributions shown in are for the winter and spring seasons only, because most of the data used were obtained from the ERN events between December and April. The plotted data of ΔCO/ΔRn, ΔCH4/ΔRn and ΔCO2/ΔRn in were 51, 44, 44 and 63, 44, 44 for MNM and YON, respectively.
Fig. 6. Frequency distribution of the enhancement ratios of ΔCO/ΔRn, ΔCH4/ΔRn and ΔCO2/ΔRn for the ERN events observed at MNM and YON from December to April. The open and grey bars represent the observed and preformed enhancement ratios, respectively. Data with correlation coefficients greater than 0.5 are used here.
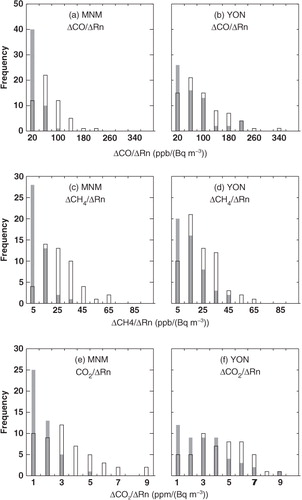
The frequency distribution of the preformed enhancement ratios at MNM shows a very narrow distribution with predominantly low values when compared with those of the observed ratios. The preformed enhancement ratios at YON show large variability, probably due to the station's vicinity to various sources in the Asian continent.
4. Discussions
4.1. Radon tracer method
The radon tracer method is governed by eq. (1):1
where FX is the flux density of the trace gas X, ΔX/ΔRn is the preformed enhancement ratio and is the mean flux density of 222Rn. When a catchment area is identified, the emissions of the trace gases are estimated by eq. (2);
2
where EX is the estimated emission of the trace gas X, and A is the catchment area defined as the source area for which the preformed enhancement ratio is calculated.
Following eq. (1), the mean flux densities of CH4, CO2 and CO were calculated from the preformed enhancement ratios by multiplying the 222Rn flux density with a constant and uniform value of 1.0 atom cm−2 s−1 (Jacob et al., Citation1997; Taguchi et al., Citation2002b; Taguchi et al., Citation2011). The use of the constant value of 1.0 atom cm−2 s−1 was deemed appropriate for synoptic scale analysis because simulated results by many global chemical transport models that have used this constant flux density have reproduced, with a reasonable agreement, the observed 222Rn data (Jacob et al., Citation1997; Rasch et al., Citation2000). To estimate the impact of the variability of the 222Rn flux density on calculated catchment areas, we used simulated results of the monthly mean flux density of 222Rn from 2007 to 2010 calculated by Hirao et al. (Citation2010). The variability of the 222Rn flux density in the catchment areas of MNM and YON was 18.4% and 15.1% from December to April. In this study, we used average values of the monthly mean preformed enhancement ratios from December to April to focus on the winter transport mechanism. The mean flux densities from the preformed enhancement ratios with their variability (1 standard deviation) at MNM were estimated to be 0.033±0.008 mmol m−2 h−1 for CH4, 3.6±0.8 mmol m−2 h−1 for CO2 and 0.080±0.009 mmol m−2 h−1 for CO, while the data at YON showed larger flux densities of 0.054±0.008 mmol m−2 h−1 for CH4, 8.8±2.1 mmol m−2 h−1 for CO2 and 0.22±0.07 mmol m−2 h−1 for CO. This difference suggests that the continental air masses reaching YON passed over more heavily polluted regions on the Asian continent rather than those reaching MNM. Furthermore, it is interesting to compare these flux densities with those obtained by other studies for the different regions based on a similar radon tracer method. It was reported that the flux density of CH4 around Europe is 0.056–0.086 mmol m−2 h−1 (Schmidt et al., Citation1996; Levin et al., Citation1999), while the flux density of CO2 in Europe is 4.3–10.4 mmol m−2 h−1 (Schmidt et al., Citation1996; Biraud et al., Citation2000). Although the flux density depends on the catchment area that affects the enhancement ratios at the observation sites, these reported results are similar in magnitude to our values.
4.2. Estimation of the emissions of CO2, CH4 and CO in East Asia
4.2.1. Model simulation of the atmospheric 222Rn.
The global chemical transport model STAG was used to simulate the spatial distributions of 222Rn over the western North Pacific. shows a comparison of the 6-hourly mean simulated 222Rn concentration in the surface air and the 6-hourly mean observed data from the stations MNM and YON for 2010. The model is generally successful in reproducing the seasonal variations observed at both stations. The simulated 222Rn in the summer at MNM shows levels less than 0.2 Bq m−3, in general agreement with the observed concentrations. At YON, the 222Rn values in the winter and spring seasons are well simulated by the model, although the slightly low 222Rn values in the model (compared to the observation) in the summer are probably due to some strong local 222Rn emissions not resolved by the model. In this study, the model calculations were carried out using a constant 222Rn emission without temporal variations, although it has been reported that 222Rn fluxes from the continent do appear to vary with time and space, due mainly to changes in soil water content (Dörr and Münnich, Citation1990; Genthon and Armengaud, Citation1995). The consistency between the model and observation in this study strongly indicates that the constant 222Rn emission was adequate for reproducing the salient features of the observed 222Rn data.
Fig. 7. Simulated and observed atmospheric concentration of 222Rn at MNM (a) and YON (b) in 2010. The black dots represent 6-hourly mean observed 222Rn and the red solid line represents simulated 222Rn.
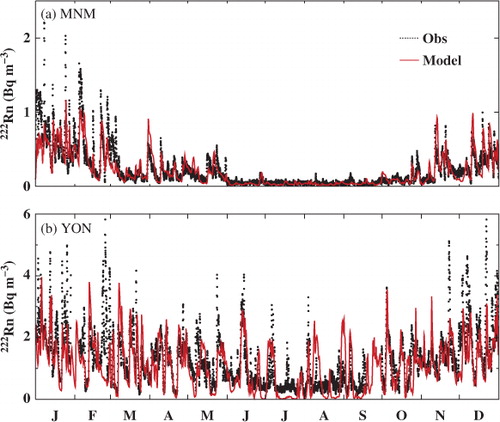
The model results also show that the major enhanced 222Rn observed with the ERN events at the stations are discernible. In addition, the timing of the occurences of the ERN events observed at the stations is relatively well simulated by the model, although it slightly underestimates the magnitude of the 222Rn peaks. The correlation at MNM and YON shows that the overall model/observation ratios range from about 0.85 to 0.92; these values are less than 1, due mainly to the fact that the model generally underestimates large increases in the 222Rn concentration associated with major peak events. MNM shows a relatively good relation between the model and the observation, with a high correlation coefficient of 0.73, while YON (closer to the continent) shows a slightly low correlation coefficient of less than 0.6; this is most likely due to the emission dilution resulting from unresolved sources in the model. Although the model is unable to reproduce well the small-scale 222Rn plumes, it is able to capture most of the major ERN events observed at the stations, allowing us to use it to understand the mechanism of transport that produced the major ERN events observed at the two stations.
4.2.2. Identification of the catchment area.
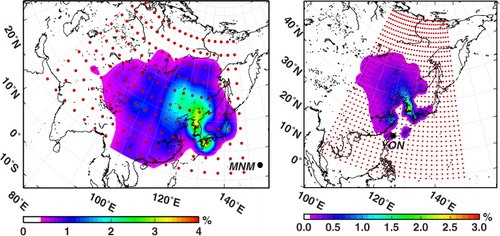
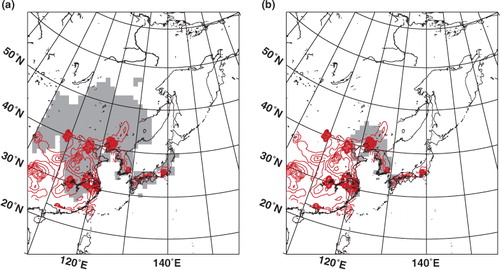
To identify the catchment areas for MNM and YON, a tagged tracer experiment with gridded 222Rn emissions was performed using STAG (Taguchi, Citation1996). The potential region of the 222Rn emission (60°E–150°E, 20°N–70°N) for MNM was divided into 180 grids with a 5°×5° resolution, whereas the potential region (99.375°E–150.00°E, 8.571°N–71.426°N) for YON was divided into 952 grids with 1.875°×1.875° resolution (). A simulation of 222Rn concentration was carried out for the period December 2009 to April 2010 for each grid. The impact of emission detected at the stations was defined as the contributive percentage relative to the total 222Rn concentration produced by the emissions from all the grids. also shows the geographical distributions of the contributive percentage for the simulated 222Rn concentration at MNM and YON. The 222Rn from all the grids in the potential Asian region accounted for 91.5% and 84.0% of the total 222Rn simulated using the global emission for MNM and YON, respectively. These results indicate that the Asian continental emissions are responsible for much of the 222Rn variations observed at MNM and YON.
Fig. 8. Contributive percentage and its grid-point distributions for the 222Rn tagged traced experiments for MNM (left panel) and YON (right panel). The resolutions of the grid are 5°×5° for MNM and 1.875°×1.875° for YON.
Based on the results from the regional tagged tracer experiment, which is similar to the tagged tracer experiment by Sawa et al. (Citation2007), the operative threshold of contributive percentage was determined to be more than 1.0% for MNM and more than 0.5% for YON. The grids with values above the threshold were integrated to identify their catchment areas. shows the geographical distributions of the identified catchment areas for the stations MNM and YON. The catchment area for MNM was found to be 6.5×10⁶ km2 covering much of eastern China from south to north, Korea and Japan, whereas the catchment area for YON covered 1.2×10⁶ km2 that included the regions from Shanghai to Beijing, Seoul, and western part of Japan. The geographical distribution for the CO emission field from the inventory of EDGAR version 4.2 (EC-JRC/PBL, 2011) is compared with the identified catchment area (). The comparison shows that most of the major CO emission regions are included in the catchment areas identified for MNM and YON, indicating useful sites for estimating the anthropogenic trace gas emissions in East Asia.
Fig. 9. Identified catchment areas for MNM (a) and YON (b). The grey shaded area represents the identified catchment area, together with the CO emission field (red contour) of the EDGAR ver. 4.2.
To confirm the validity of these threshold values and their uncertainties, sensitivity tests were conducted by changing the maximum of the contributive percentage to evaluate the potential range of the threshold. The potential range of the threshold at MNM was evaluated to be between 0.8 and 1.1%, giving about 12% uncertainty in the catchment area estimate. The potential threshold at YON ranged from 0.4 to 0.6%, resulting in about 24% uncertainty in the catchment area estimate.
4.3. Comparison of emissions of CO, CH4 and CO2 with emission databases in East Asia
To estimate the CO, CH4 and CO2 emissions using eq. (2), the preformed enhancement ratios for the observed events with high correlation coefficients greater than 0.5 (shown in ) were averaged for 5 months from December to April; the other months were not included because of very few events. Thus, the 222Rn-derived estimate for each trace gas represents mostly emissions from the winter and early spring.
The 222Rn-derived estimates in this study include anthropogenic emissions only in the winter and early spring, as well as the natural biogenic sources from the land ecosystem in the catchment areas. The emission values for CO2 obtained in this study include natural biogenic CO2 flux from vegetation (Chen et al., Citation2004; Turnbull et al., Citation2011). The natural biogenic flux of CO2 was obtained as an average flux from December to April in the catchment areas based on the net ecosystem production (NEP) output from the Carnegie-Ames-Stanford Approach (CASA) model (Randerson et al., Citation1997). This land biosphere emission accounted for about 38% and 18% of the total 222Rn-derived emissions of CO2 for the catchment areas of MNN and YON, respectively. These natural biogenic fluxes of CO2 were subtracted from the 222Rn-derived estimates of CO2 in this study to obtain anthropogenic emission estimates.
The estimated CH4 emission in this study does not include emissions from rice paddies (a major source of agricultural CH4 in East Asia) since they produce nearly zero methane emission during the winter and early spring in China (Yan et al., Citation2003). Thus, the estimated emission of CH4 in this study includes only the anthropogenic emission.
As for CO, a significant emission comes from anthropogenic sources, but biomass burning in the dry season could be non-negligible. However, based on the results from a transport model simulation using the biomass burning emission estimates of the Global Fire Emissions Database (GFED) ver. 3.1 from 2005 to 2010 (van der Werf et al., Citation2010) to drive the CO field in STAG, we have found that the contribution to the measurements from the biomass burning was relatively insignificant.
The emissions for the catchment area of MNM were estimated to be 127±31 TgCO yr−1, 30±9.6 TgCH4 yr−1 and 1.5±0.5 PgC-CO2 yr−1, while the estimated emissions for the catchment area of YON were 63±28 TgCO yr−1, 9±2.9 TgCH4 yr−1 and 0.9±0.3 PgC-CO2 yr−1 (). The error was estimated from the uncertainties of the catchment area, the variability of the preformed enhancement ratios and the variability of the monthly mean flux density of 222Rn by the error propagation method.
Table 1. Comparison of estimated emissions of CO, CH4, CO2 for the catchment areas of MNM and YON
In comparison with the 222Rn-derived estimates in this study, the three emission inventory databases of EDGAR ver.4.2 (EC-JRC/PBL, 2011), REAS for 2009 (Ohara et al., Citation2007), CDIAC ver. 2011 (Boden et al., Citation2011) were used to calculate their CO, CH4 and CO2 emissions within the catchment areas of MNM and YON, respectively, and their results are summarised in . Since the 222Rn-derived emissions in this study included only the anthropogenic sources, the EDGAR emission values listed in do not include emissions from agricultural biomass burning sources. The CDIAC and REAS values include only the anthropogenic emission. Furthermore, the EDGAR and CDIAC emission values were calculated for the reference year of 2009 using the emission data from 2005 to 2008. The uncertainty of the extrapolation was 0.8–1.6% for CO, 4.8–6.8% for CH4 and 1.9–3.1% for CO2 for EDGAR, and 6.8–7.0% for CO2 for CDIAC, at 95% confidence level. The REAS emission values for 2009 were obtained by interpolating between the emission for 2003 and the predicted emission for 2010 (Ohara et al., Citation2007).
In , the 222Rn-derived estimates of CO, CH4 and CO2 emissions for MNM and YON are compared to those from the three emission databases listed in . The 222Rn-derived CO2 emission of MNM agrees well with the estimate of 1.2–1.6 PgC-CO2 yr−1 obtained from the emission databases. Although we obtained a slightly larger estimated value for YON when compared to 0.5–0.6 PgC-CO2 yr−1 obtained from the emission databases, it was consistent with the emission databases to within its uncertainty. These results attest to the fact that the 222Rn-derived method is reliable and useful for estimating anthropogenic CO2 emissions in East Asia, and completely independent from other methods for estimating other trace gas emissions.
Fig. 10. Comparisons of the estimated emissions of CO, CH4 and CO2 between this study and three emission databases for the catchment areas of MNM and YON. The databases are derived from the EDGAR ver.4.2, REAS for 2009, CDIAC ver. 2011. The error bars represent the estimated uncertainties (see text).
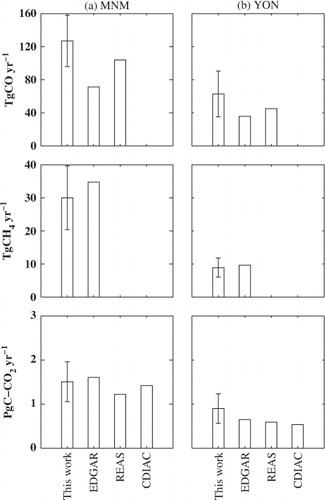
The CH4 emissions based on the 222Rn tracer method are also in good agreement with those obtained from the modified EDGAR database. As was the case with CO2, this agreement suggests that the 222Rn tracer method is reliable for evaluating the anthropogenic CH4 emissions in East Asia regions.
The 222Rn-derived CO emissions are similar to the emission of the REAS database, whereas the emission estimate of EDGAR is significantly smaller when compared to this study, especially at MNM. This difference likely stems from large uncertainties associated with the estimation of major CO productions from the residential biomass-fuel burnings in East Asia, especially China (Streets et al., 2003; Suntharalingam et al., Citation2004). Since the REAS emission values of CO are consistent with the results obtained by the inverse method (Ohara et al., Citation2007), our 222Rn tracer method is also consistent with the inverse method. Furthermore, our results show that the EDGAR CO emission database has underestimated the emission by about 44% for East Asia, consistent with the inverse modelling results obtained by Kasibhatla et al. (Citation2002). The 222Rn-derived approach provides more robust estimates of the CO emission as it is not differentially affected by source types.
5. Conclusions
A high-precision 222Rn measuring system developed by AIST and MRI was deployed in 2007 to make measurements of the atmospheric concentration of 222Rn at MNM, followed by measurements at YON. These measurements showed a distinct seasonal variation with a winter maximum and a summer minimum. In addition, high-frequency synoptic variations associated with enhanced 222Rn (ERN) events caused by long-range transport of continental air masses were observed.
The enhancements of CH4, CO2 and CO were also observed during many of the ERN events at MNM and YON. The simultaneous elevations of these gases indicate that the concentrations of 222Rn and other trace gases were well mixed in polluted air masses over the continent and then exported to the western North Pacific regions by the cold frontal transport. The enhancement ratios of ΔCH4/ΔRn, ΔCO2/ΔRn and ΔCO/ΔRn were calculated for the ERN events at MNM and YON. These observed enhancement ratios varied over a wide range, caused mainly by the radioactive decay of 222Rn during transport to MNM and YON. Based on the transport transit time from the continent to MNM or YON calculated using backward trajectory analysis, the radioactive decay influence was eliminated. The resulting preformed enhancement ratios were found to be lower in value with reduced variability, when compared to the observed enhancement ratios at the stations.
The mean flux densities of CH4, CO2 and CO calculated from the preformed enhancement ratios and a constant and uniform 222Rn emanation rate of 1.0 atom cm−2 s−1 for MNM were estimated to be 0.033±0.008 mmol m−2 h−1 for CH4, 3.6±0.8 mmol m−2 h−1 for CO2 and 0.080±0.009 mmol m−2 h−1 for CO, while the data at YON showed larger flux densities of 0.054±0.008 mmol m−2 h−1 for CH4, 8.8±2.1 mmol m−2 h−1 for CO2 and 0.22±0.07 mmol m−2 h−1 for CO. These flux densities are in a similar magnitude range to those obtained by a similar 222Rn tracer method applied in Europe.
Multiplying the flux density by the catchment area, the emissions of CO, CH4 and CO2 were estimated. The catchment areas representing the 222Rn-derived fluxes obtained from the MNM and YON observations were identified for the winter season by conducting a series of tagged trace experiments using the 3-D chemical transport model STAG. The identified catchment area for MNM covered a large surface area of about 6.5×10⁶ km2 that included southern China, northern China, Korea and Japan, whereas the YON catchment area was smaller with a surface area of about 1.2×10⁶ km2 that included Shanghai, Beijing, Seoul and the western part of Japan. The emissions of CO, CH4 and CO2 in the catchment area for MNM were estimated to be 127±31 TgCO yr−1, 30±9.6 TgCH4 yr−1 and 1.5±0.5 PgC-CO2 yr−1, respectively, while the corresponding estimated emissions for YON were 63±28 TgCO yr−1, 9±2.9 TgCH4 yr−1 and 0.9±0.3 PgC-CO2 yr−1. For the CO2 emission estimates, the biogenic CO2 emissions based on CASA was subtracted from the 222Rn-derived emissions. When compared with values from the emission databases, the 222Rn-derived emissions of CO2 and CH4 were found to be in good agreement with the emission databases of EDGAR, REAS and CDIAC, while disagreement in the CO emission likely stemmed from large uncertainties associated with the estimation of the residential biomass-fuel burning CO source in the emission databases. Our estimated emission of CO was consistent with the REAS emission, which is also consistent with the results obtained by the inverse method. Based on our results, the CO emission for East Asia is underestimated by about 44% in the EDGAR database. It was demonstrated that the 222Rn tracer method used in this study could provide a useful and independent tool to verify the trace gas emissions in East Asia.
Related Research Data
References
- Akimoto H. Global air quality and pollution. Science. 2003; 302: 1716–1719. 10.3402/tellusb.v65i0.18037.
- Andreae M. O, Berresheim H, Andreae T. W, Kritz M. A, Bates T. S, co-authors. Vertical distribution of dimethylsulfide, sulfur dioxide, aerosol ions, and radon over the northwest Pacific Ocean. J. Atmos. Chem. 1988; 6: 149–173. 10.3402/tellusb.v65i0.18037.
- Biraud S, Ciais P, Ramonet M, Simmonds P, Kazan V, co-authors. European greenhouse gas emissions estimated from continuous atmospheric measurements and radon 222 at Mace Head, Ireland. J. Geophys. Res. 2000; 105(D1): 1351–1366. 10.3402/tellusb.v65i0.18037.
- Boden, T. A, Marland, G., and Andres, R. J. 2011. Global, Regional, and National Fossil-Fuel CO2 Emissions. Carbon Dioxide Information Analysis Center, Oak Ridge National Laboratory, U.S. Department of Energy, Oak Ridge, TN. DOI: 10.3402/tellusb.v65i0.18037.
- Chambers S, Zahorowski W, Matsumoto K, Uematsu M. Seasonal variability of radon-derived fetch regions for Sado Island, Japan, based on 3 years of observations: 2002–2004. Atmos. Environ. 2009; 43: 271–279. 10.3402/tellusb.v65i0.18037.
- Chen, B, Chen, J. M, Liu, J, Chan, D, Higuchi, K. and co-authors. 2004. A vertical diffusion scheme to estimate the atmospheric rectifier effect. J. Geophys. Res. 109: D04306. DOI: 10.3402/tellusb.v65i0.18037.
- Dlugokencky, E. J, Myers, R. C, Lang, P. M, Masarie, K. A, Crotwell, A. M. and co-authors. 2005. Conversion of NOAA atmospheric dry air CH4 mole fractions to a gravimetrically-prepared standard scale. J. Geophys. Res. 110: D18306. DOI: 10.3402/tellusb.v65i0.18037.
- Dörr H, Münnich K. O. 222Rn flux and soil air concentration profiles in West-Germany. Soil 222Rn as tracer for gas transport in the unsaturated soil zone. Tellus B. 1990; 42: 20–28. 10.3402/tellusb.v65i0.18037.
- European Commission, Joint Research Centre (JRC)/Netherlands Environmental Assessment Agency (PBL). 2011. Emission database for global atmospheric research (EDGAR) release version 4.2. Online at: http://edgar.jrc.ec.europa.eu..
- Genthon, C., and Armengaud, A. 1995. Radon 222 as a comparative tracer of transport and mixing in two general circulation models of the atmosphere. J. Geophys. Res. 100(D2): 2849–2866. DOI: 10.3402/tellusb.v65i0.18037.
- Heald, C. L, Jacob, D. J, Jones, D. B. A, Palmer, P. I, Logan, J. A. and co-authors. 2004. Comparative inverse analysis of satellite (MOPITT) and aircraft (TRACE-P) observations to estimate Asian sources of carbon monoxide. J. Geophys. Res. 109: D23306. DOI: 10.3402/tellusb.v65i0.18037.
- Hirao S, Yamazawa H, Moriizumi J. Estimation of global radon exhalation rate distribution. Jpn. J. Health Phys. 2010; 45(2): 161–171. 10.3402/tellusb.v65i0.18037.
- Hirsch R. M, Gilroy E. J. Methods of fitting a straight line to data: examples in water resources. Water Resour. Bull. 1984; 20(5): 705–711. 10.3402/tellusb.v65i0.18037.
- Hooghiemstra P. B, Krol M. C, Meirink J. F, Bergamaschi P, van der Werf G. R, co-authors. Optimizing global CO emission estimates using a four-dimensional variational data assimilation system and surface network observations. Atmos. Chem. Phys. 2011; 11: 4705–4723. 10.3402/tellusb.v65i0.18037.
- Husar, R. B, Tratt, D. M, Schichtel, B. A, Falke, S. R, Li, F. and co-authors. 2001. Asian dust events of April 1998. J. Geophys. Res. 106(D16): 18317–18330. DOI: 10.3402/tellusb.v65i0.18037.
- Iida T, Ikebe Y, Suzuki K, Ueno K, Wang Z, co-authors. Continuous measurements of outdoor radon concentrations at various locations in East Asia. Environ. Int. 1996; 22: 139–147. 10.3402/tellusb.v65i0.18037.
- Iida T, Ikebe Y, Tojo K. An electrostatic radon monitor for measurements of environmental radon. Res. Lett. Atmos. Electr. 1991; 11: 55–59.
- Jacob D. J, Prather M. J, Rasch P. J, Shia R.-L, Balkanski Y. J, co-authors. Evaluation and intercomparison of global atmospheric transport models using 222Rn and other short-lived tracers. J. Geophys. Res. 1997; 102(D5): 5953–5970. 10.3402/tellusb.v65i0.18037.
- Kasibhatla, P, Arellano, A, Logan, J. A, Palmer P. I and Novelli, P. 2002. Top-down estimate of a large source of atmospheric carbon monoxide associated with fuel combustion in Asia. Geophys. Res. Lett. 29(19): 1900. DOI: 10.3402/tellusb.v65i0.18037.
- Kopacz, M, Jacob, D. J, Henze, D. K, Heald, C. L, Streets, D. G. and co-authors. 2009. Comparison of adjoint and analytical Bayesian inversion methods for constraining Asian sources of carbon monoxide using satellite (MOPITT) measurements of CO columns. J. Geophys. Res. 114: D04305. DOI: 10.3402/tellusb.v65i0.18037.
- Kuhlmann A. D, Worthy D. E, Trivett N. B. A, Levin I. Methane emissions from a wetland region within the Hudson Bay Lowland: an atmospheric approach. J. Geophys. Res. 1998; 103: 16009–16016. 10.3402/tellusb.v65i0.18037.
- Levin I, Glatzel-Mattheier H, Marik T, Cuntz M, Schmidt M, co-authors. Verification of German methane emission inventories and their recent changes based on atmospheric observations. J. Geophys. Res. 1999; 104(D3): 3447–3456. 10.3402/tellusb.v65i0.18037.
- Marland, G, Boden, T. A and Andres, R. J. 2008. Global, Regional, and National Fossil Fuel CO2 Emissions. In Trends: A Compendium of Data on Global Change. Carbon Dioxide Information Analysis Center, Oak Ridge National Laboratory, U.S. Department of Energy, Oak Ridge, TN.
- Matsueda H, Sawa Y, Wada A, Inoue H. Y, Suda K, co-authors. Methane standard gases for atmospheric measurements at the MRI and JMA and intercomparison experiments. Pap. Meteorol. Geophys. 2004a; 54: 91–109. 10.3402/tellusb.v65i0.18037.
- Matsueda H, Suda K, Nishioka S, Hirano Y, Sawa Y, co-authors. Re-evaluation for scale and stability of CO2 standard gases used as long-term observations at the Japan Meteorological Agency and the Meteorological Research Institute (in Japanese). Tech. Rep. Meteorol. Res. Inst. 2004b; 45: 1–64.
- Moriizumi, J, Ohkura, T, Hirao, S, Nono, Y, Yamazawa, H. and co-authors. 2008. Continuous observation of atmospheric 222Rn concentrations for analytic basis of atmospheric transport in East Asia. J. Nucl. Sci. Technol. ( Suppl. 6), 173–179.
- Ohara T, Akimoto H, Kurokawa J, Horii N, Yamaji K, co-authors. An Asian emission inventory of anthropogenic emission sources for the period 1980–2020. Atmos. Chem. Phys. 2007; 7: 4419–4444. 10.3402/tellusb.v65i0.18037.
- Ohkura, T, Yamazawa, H, Moriizumi, J, Hirao, S, Guo, Q. and co-authors. 2009. Monitoring network of atmospheric radon-222 concentration in East Asia and backward trajectory analysis of radon-222 concentration trend at a small solitary island on Pacific Ocean. J. Jan. Soc. Atmos. Environ. 44(1): 42–51. ( in Japanese with English abstract)
- Olivier, J. G. J, Van Aardenne, J. A, Dentener, F, Pagliari, V, Ganzeveld, L. N. and co-authors. 2005. Recent trends in global greenhouse gas emissions: regional trends 1970–2000 and spatial distribution of key sources in 2000. Env. Sci. 2 (2–3), 81–99. DOI: 10.3402/tellusb.v65i0.18037.
- Palmer, P. I, Suntharalingam, P, Jones, D. B. A, Jacob, D. J, Streets, D. G. and co-authors. 2006. Using CO2: CO correlations to improve inverse analyses of carbon fluxes. J. Geophys. Res. 111: D12318. DOI: 10.3402/tellusb.v65i0.18037.
- Parrish D. D, Hahn C. J, Williams E. J, Norton R. B, Fehsenfeld F. C, co-authors. Indications of photochemical histories of Pacific air masses from measurements of atmospheric trace species at Pt. Arena, California. J. Geophys. Res. 1992; 97(D14): 15883–15901. 10.3402/tellusb.v65i0.18037.
- Randerson J. T, Thompson M. V, Conway T. J, Fung I. Y, Field C. B. The contribution of terrestrial sources and sinks to trends in the seasonal cycle of atmospheric carbon dioxide. Global Biogeochem. Cy. 1997; 11: 535–560. 10.3402/tellusb.v65i0.18037.
- Rasch P. J, Feichter J, Law K, Mahowald N, Penner J, co-authors. A comparison of scavenging and deposition processes in global models: results from the WCRP Cambridge workshop of 1995. Tellus B. 2000; 52: 1025–1056. 10.3402/tellusb.v65i0.18037.
- Sawa, Y, Tanimoto, H, Yonemura, S, Matsueda, M, Mukai, H. and co-authors. 2007. Carbon monoxide for widespread pollution events observed over the western North Pacific during EAREX campaign 2005. J. Geophys. Res. 112: D22S26. DOI: 10.3402/tellusb.v65i0.18037.
- Schmidt M, Glatzel-Mattheier H, Sartorius H, Worthy D. E, Levin I. Western European N2O emissions – a top down approach based on atmospheric observations. J. Geophys. Res. 2001; 106(D6): 5507–5516. 10.3402/tellusb.v65i0.18037.
- Schmidt M, Graul R, Sartorius H, Levin I. Carbon dioxide and methane in continental Europe: a climatology, and 222radon-based emission estimates. Tellus B. 1996; 48: 457–473. 10.3402/tellusb.v65i0.18037.
- Schmidt, M, Graul, R, Sartorius, H and Levin, I. 2003. The Schauinsland CO2 record: 30 years of continental observations and their implications for the variability of the European CO2 budget. J. Geophys. Res. 108(D19): 4619. DOI: 10.3402/tellusb.v65i0.18037.
- Streets, D. G, Bond, T. C, Carmichael, G. R, Fernandes, S. D, Fu, Q. and co-authors. 2003. An inventory of gaseous and primary aerosol emissions in Asia in the year 2000. J. Geophys. Res. 108(D21): 8809. DOI: 10.3402/tellusb.v65i0.18037.
- Suntharalingam, P, Jacob, D. J, Palmer, P. I, Logan, J. A, Yantosca, R. M. and co-authors. 2004. Improved quantification of Chinese carbon fluxes using CO2/CO correlations in Asian outflow. J. Geophys. Res. 109: D18S18. DOI: 10.3402/tellusb.v65i0.18037.
- Taguchi S. A three-dimensional model of atmospheric CO2 transport based on analyzed winds: model description and simulation results for TRANSCOM. J. Geophys. Res. 1996; 101: 15099–15109. 10.3402/tellusb.v65i0.18037.
- Taguchi S, Iida T, Moriizumi J. Evaluation of the atmospheric transport model NIRE-CTM-96 by using measured radon-222 concentrations. Tellus B. 2002b; 54: 250–268. 10.3402/tellusb.v65i0.18037.
- Taguchi S, Law R. M, Rödenbeck C, Patra P. K, Maksyutov S, co-authors. TransCom continuous experiment: comparison of 222Rn transport at hourly time scales at three stations in Germany. Atmos. Chem. Phys. 2011; 11: 10071–10084. 10.3402/tellusb.v65i0.18037.
- Taguchi S, Matsueda H, Inoue H. Y, Sawa Y. Long-range transport of CO from tropical ground to upper troposphere: a case study for Southeast Asia in October 1997. Tellus B. 2002a; 54: 22–40. 10.3402/tellusb.v65i0.18037.
- Tanimoto, H, Sawa, Y, Matsueda, H, Uno, I, Ohara, T. and co-authors. 2005. Significant latitudinal gradient in the surface ozone spring maximum over East Asia. Geophys. Res. Lett. 32: L21805. DOI: 10.3402/tellusb.v65i0.18037.
- Troen I, Mahrt L. A simple model of the atmosphere boundary layer, sensitively to surface evaporation. Bound. Lay. Meteorol. 1986; 37: 129–148. 10.3402/tellusb.v65i0.18037.
- Tsutsumi Y, Mori K, Ikegami M, Tashiro T, Tsuboi K. Long-term trends of greenhouse gases in regional and background events observed during 1998–2004 at Yonagunijima located to the east of the Asian continent. Atmos. Environ. 2006; 40: 5868–5879. 10.3402/tellusb.v65i0.18037.
- Turnbull, J. C, Tans, P. P, Lehman, S. J, Baker, D, Conway, T. J. and co-authors. 2011. Atmospheric observations of carbon monoxide and fossil fuel CO2 emissions from East Asia. J. Geophys. Res. 116: D24306. DOI: 10.3402/tellusb.v65i0.18037.
- Wada, A, Matsueda, H, Sawa, Y, Tsuboi, K and Okubo, S. 2011. Seasonal variation of enhancement ratios of trace gases observed over 10 years in the western North Pacific. Atmos. Environ. 45: 2129–2137. DOI: 10.3402/tellusb.v65i0.18037.
- Wada A, Murayama S, Kondo H, Matsueda H, Sawa Y, co-authors. Development of a compact and sensitive electrostatic radon-222 measuring system for use in atmospheric observation. J. Meteor. Soc. Jpn. 2010; 88(2): 123–134. 10.3402/tellusb.v65i0.18037.
- Wada, A, Sawa, Y, Matsueda, H, Taguchi, S, Murayama, S. and co-authors. 2007. Influence of continental air mass transport on atmospheric CO2 in the western North Pacific. J. Geophys. Res. 112: D07311. DOI: 10.3402/tellusb.v65i0.18037.
- Watanabe F, Uchino O, Joo Y, Aono M, Higashijima K, co-authors. Interannual variation of growth rate of atmospheric carbon dioxide concentration observed at the JMA's three monitoring stations: large increase in concentration of atmospheric carbon dioxide in 1998. J. Meteorol. Soc. Jpn. 2000; 78: 673–682.
- van der Werf G. R, Randerson J. T, Giglio L, Collatz G. J, Mu M, co-authors. Global fire emissions and the contribution of deforestation, savanna, forest, agricultural, and peat fires (1997–2009). Atmos. Chem. Phys. 2010; 10: 11707–11735. 10.3402/tellusb.v65i0.18037.
- Wilkening M. H, Clements W. E. Radon-222 from the ocean surface. J. Geophys. Res. 1975; 80: 3828–3830. 10.3402/tellusb.v65i0.18037.
- Yan, X, Cai, Z, Ohara, T and Akimoto, H. 2003. Methane emission from rice fields in mainland China: amount and seasonal and spatial distribution. J. Geophys. Res. 108(D16): 4505. DOI: 10.3402/tellusb.v65i0.18037.
- Zahorowski W, Chambers S. D, Wang T, Kang C.-H, Uno I, co-authors. Radon-222 in boundary layer and free tropospheric continental outflow events at three ACE-Asia sites. Tellus B. 2005; 57: 124–140. 10.3402/tellusb.v65i0.18037.
- Zhang Q, Streets D. G, Carmichael G. R, He K. B, Huo H, co-authors. Asian emissions in 2006 for the NASA INTEX-B mission. Atmos. Chem. Phys. 2009; 9: 5131–5153. 10.3402/tellusb.v65i0.18037.