Abstract
We studied if the presence of Saharan dust intrusions and the rains modify the chemical signature of the wet and dry deposition in the southern Iberian Peninsula. We have sorted the 109 sampling weeks by the presence (rainy weeks) or absence (dry weeks) of rain and by the occurrence or not of Saharan dust intrusions. Dry deposition dominated the delivery of particulate material (PM), total phosphorus (TP), soluble reactive phosphorus (SRP), Ca2+, Mg2+ and K+, whereas wet deposition dominated the delivery of Na+, total nitrogen,
and
. In the dry weeks, the presence of Saharan dust intrusions lead to higher inputs of PM, TP, SRP, Ca2+, Mg2+ and K+ in the dry deposition. Conversely, in the rainy weeks, there were no differences in mean values of dry deposition irrespective of the occurrence of Saharan dust intrusions. Nevertheless, in the presence of Saharan intrusions and some rain, the weekly collection of PM, TP and Ca2+ in dry deposition were significantly higher and increased as rainfall was lower. By contrast, the ions Cl– and Na+ in wet deposition were higher in absence of Saharan dust intrusion and increased as rainfall increased.
1. Introduction
Aerosol deposition has a relevant effect on terrestrial and aquatic ecosystems through the supply of limiting elements (see Chadwick et al., Citation1999; Jickells et al., Citation2005). The main source of aerosols in the atmosphere at the global scale is the dust injected from arid regions which dominates aerosol loadings compared to anthropogenic sources (Schlesinger, Citation1997). The largest and most persistent sources of coarse aerosol (particles of supramicron size) are located in the Northern Hemisphere, mainly in the ‘dust belt’ that extends from the west coast of North Africa, over the Middle East, Central and South Asia, to China (Prospero et al., Citation2002). Therefore, there are great differences in the content of dust aerosol among world localities depending on their geographical localisation with respect to this ‘dust belt’ (Mladenov et al., Citation2011).
Aerosol deposition occurs through rain washout (named wetfall or wet deposition), or by direct sedimentation during periods without rain (named dryfall or dry deposition). Some studies on atmospheric deposition have been carried out using ‘bulk’ collectors that mix both dryfall and wetfall, precluding their discrimination and specific characterisation. This fact has been considered of minor importance in rainy areas where dryfall can be neglected compared with wetfall (Loÿe-Pilot and Martin, Citation1996) or dryfall does not basically modify the chemical signature of the wet deposition (Avila and Alarcón, Citation1999). However, other studies have underlined the significance of dry deposition that, in some cases, can be the dominant fraction of the total deposition (Lovett, Citation1994). Dryfall is particularly relevant in arid and semi-arid regions where intense dust loadings take place (Kubilay et al., Citation2000; Morales-Baquero et al., Citation2006; Pulido-Villena et al., Citation2006). In such regions, it is necessary to separately quantify wet and dry deposition to achieve a more comprehensive understanding of the atmospheric deposition and their corresponding chemical signatures under the influence of dust loading or in its absence. In this work, we use the term chemical signature of wet deposition as the sum of the chemical composition of rain water plus the soluble fraction of particulate aerosol captured by the rain. The chemical signature of dry deposition is the fraction of particulate aerosols soluble in ultrapure water. In both cases, the elements in these soluble phases have a direct impact on the ecosystem biogeochemistry.
The Iberian Peninsula is exposed to frequent Saharan dust intrusions and presents a strong precipitation gradient, from less than 200 mm of mean annual rain in the south-east to more than 2000 mm in the north-west (MMA, Citation2000). Previous works carried out in Sierra Nevada (south-east of the Iberian Peninsula) have reported a relative higher contribution of dryfall to total atmospheric deposition of particulate matter (PM), water soluble organic carbon (WSOC), total phosphorus (TP), total nitrogen (TN) and calcium (Morales-Baquero et al., Citation2006; Pulido-Villena et al., Citation2006, Mladenov et al., Citation2008). Other studies in the north-eastern Iberian Peninsula have pointed to the significance of Saharan dust on the chemistry of ‘bulk’ deposition (Camarero and Catalan, Citation1993; Avila et al., Citation1998; Avila and Alarcón Citation1999; Avila and Peñuelas, Citation1999). Despite these efforts, the effects of Saharan dust on the chemistry of wet and dry deposition remain scantly explored (Izquierdo et al., Citation2012).
In this study, we determined the chemical signature of Saharan dust intrusions on wet and dry atmospheric deposition in the south of the Iberian Peninsula. This region is very suitable to explore the significance of Saharan dust on both types of deposition because it has long period without rain and is influenced by frequent Saharan dust intrusions.
2. Material and methods
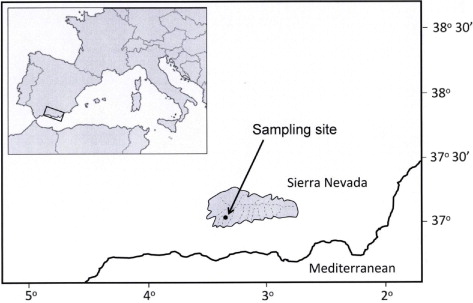
This study was conducted in Sierra Nevada, a remote mountain site located in the south of the Iberian Peninsula, close to the Mediterranean Sea (<25 km) (). The area is located far from direct human activity and is highly influenced by Saharan dust intrusions which make it an ideal site to study the deposition of long-range transported aerosol (Morales-Baquero et al., Citation2006; Pulido-Villena et al., Citation2006). This site is located in a semi-arid region with annual rainfall of ≈450 mm.
Fig. 1 Location of the study site, in the south-western Mediterranean Region.
2.1. Sampling and chemical analyses
Separate samples of dry and wet deposition were collected weekly from December 2000 to December 2002 using a MTX® ARS 1010 automatic deposition sampler located at 1000 m asl (36°56′N, 3°30′W). These samplers discriminate between dry and wet atmospheric deposition using a humidity sensor that activate an aluminium lid to cover/uncover two (dry and wet) buckets. Every sampling date, dry and wet deposition buckets were replaced and taken to the laboratory. The dry deposition sample was obtained by rinsing the bucket with 1000 mL of Milli-Q® ultrapure water and this solution was saved for the chemical analyses. The volume of rain in the wet deposition bucket was recorded, and a 1000-mL aliquot was used for analysis. If rain volume was <1000 mL, it was brought up to that volume with Milli-Q ultrapure water. At the end of the study period, 109 samples were collected. Despite the complexity in the collection of dry atmospheric deposition (Wesely and Hicks, Citation2000), the comparatively large size of Saharan dust aerosol (supramicrons) (Alados-Arboledas et al., Citation2003; Mladenov et al., Citation2010) that are submitted to long-range transport (Prospero, Citation1996) makes that sedimentation is the main delivery process and likely unaffected by the specific collector properties. Nevertheless, the fluxes of some elements with gaseous compounds as N and S may be underestimated with this procedure. Concentration of PM in dry and wet deposition was determined as dry weight (60°C, 24 h) using Whatman GF/F glass fibre filters. Prior to filtration, 50-mL subsamples were taken to analyse TP and TN concentration. The filtrate was used for analysing soluble reactive phosphorus (SRP), nitrate (NO3 −-N), sulphate (SO4 2−-S), silicate (SiO2-Si), chloride (Cl−), and calcium (Ca2+), potassium (K+), sodium (Na+) and magnesium (Mg2+). Data on PM, TP, TN, SRP and Ca2+ have been published elsewhere to assess their effects on alpine lake chemistry and biology (Morales-Baquero et al., Citation2006; Pulido-Villena et al., Citation2006; Pulido-Villena et al., Citation2008a). These values where incorporated in the data pool under the different approach of this work. NO3 − was analysed following the ultraviolet spectrophotometric method (APHA, Citation1992); SO4 2− and Cl− analyses were performed with a Dionex® DX100 ionic chromatographer and Ca2+, Na+, K+ and Mg2+ were determined by atomic absorption with a Perkin Elmer® 5100 spectrometer.
The concentration of all chemical species measured in dry and wet deposition samples, collected during each week, was converted to units of daily deposition by considering the sampler area (0.07 m2) and the rain volume (only for wet deposition). This approach for the determination of atmospheric deposition implies that the term ‘dry deposition’ for SRP, NO3 −, SO4 2−, SiO2, Cl−, Ca2+, K+, Na+ and Mg2+ designates the fraction contained in dry deposition that is soluble in ultrapure water. Hereafter, the following terms will be used to refer to the different forms of atmospheric deposition: dry deposition (soluble fraction for anions and/or in suspension for TP, TN and PM), wet deposition (chemical species dissolved in rainwater and/or in suspension for TP, TN and PM), and total deposition (sum of dry and wet deposition).
2.2. Statistical analysis
To investigate the influence of Saharan dust intrusions on the amount and chemical composition of dry and wet atmospheric deposition we compared mean values between the weeks sorted depending on the presence or not of rain and Saharan dust intrusions (). Saharan dust intrusions over the Iberian Peninsula during the study period were identified after Querol et al. (Citation2002, Citation2003). These authors developed the methodology for the alert network for Saharan intrusion over the Iberian Peninsula based on: (1) measurements of total particles in suspension; (2) backward trajectories analyses; (3) TOMS (Total Ozone Mapping Spectrometer) aerosol index analyses; (4) Image analysis from SeaWIFS satellite (Goddard Space Flight Centre, NASA); and (5) Saharan dust distribution according to SKIRON and DREAM-ICOD models. Comparisons between means were performed using t-tests when it was possible and with the non-parametric Kolmogorov–Smirnov test to avoid violation of assumptions regarding distribution of measures. The analysis of covariance (ANCOVA) combines one-way analysis of variance with linear regression. This analysis allows comparing one categorical variable in two groups taking into account the variability of another continuous variable, called covariate. The ANCOVA's were used to assess the effect of both Saharan dust events and the rain. Saharan dust events were the categorical variable (presence or absence in the week) and the weekly rain was the covariate (amount of rain during the week). Statistical analyses were performed using Statistica Software (StatSoft Inc., Citation1997).
Table 1. Number of weeks with absence of rain (dry weeks) and with presence of rain (rainy weeks), affected or not by Saharan dust intrusions, during the 2-year study period
3. Results and discussion
3.1. Total deposition
The mean annual precipitation was 503.7 mm (), with maximum rainfall of 189 mm in November 2002 and several consecutive weeks without rain (5 and 11 weeks in 2001 and 2002, respectively). PM total deposition (mean annual value 11.1 g m−2) fitted the regional trend of dust deposition reported for the Mediterranean region with values declining with distance from the north of Africa and toward the west (Goudie and Middleton, Citation2001). Total deposition of TP and Ca2+ also fitted the above mentioned regional distribution pattern. Total TN deposition was lower than reported for central Europe and the eastern part of Mediterranean. More seasonal details about PM, TP, TN and Ca2+ deposition can be found in Morales-Baquero et al. (Citation2006) and Pulido-Villena et al. (Citation2006).
Table 2. Daily mean values and range (m−2 d−1) of dry, wet and total deposition from December 2000 to December 2002
Mean total deposition of NO3 − was in the lower range recently found in the Mediterranean region while SRP deposition was similar to other Mediterranean areas (). Total deposition of SO4 2− was lower than in northern Italy, and in the eastern Mediterranean area (). The deposition of silicate was lower than the values reported for the north-western Mediterranean region (Bartoli et al., Citation2005) and much lower than that found by Anderson and Downing (Citation2006) in an agricultural area. However, the scarcity of data on silicate deposition in the literature makes this comparison premature. Total deposition of Na+, Mg2+, Cl− and K+ was lower than the high values reported for the eastern Mediterranean in a location close to the sea (Al-Momani et al., Citation1995). It is interesting to note that while the total deposition of Na+ and Mg2+ in this study was similar to the reported values for northern Italy, the total deposition of Cl− and K+ was lower (). The low values of total deposition of Cl− compared to Na+ and Mg2+ would indicate a deficit of Cl− with respect to sea salt. Moreover, the low deposition of Cl− and K+ observed in this study also suggests a scarce influence during the study period of biomass burning, which is a major source of these chemical species in the atmospheric deposition (Li et al., Citation2003).
3.2. Marine ionic ratios and the Cl− deficit
Dry and wet deposition showed similar ionic ratios with respect to Na+ (). Non-sea-salt (nss) Ca2+, nss K+ and nss SO4 2− appeared enriched with respect to the marine proportion of Na+, indicating a continental origin (). The proportion of nss Mg2+ with respect to Na+ was in the range of the marine ratio, although there were not correlations between nss Mg2+ and Na+, neither in dry (r=0.07; p=0.605) nor wet (r=0.11; p=0.565) deposition. In contrast, the Cl− to Na+ ratio was markedly lower than in marine waters () indicating a Cl− deficit.
Fig. 2 Non-sea-salt (nss) Ca2+, SO4 2−, K+, Mg2+ and Cl− in dry (solid dots) and wet (empty dots) deposition as function of Na+. The solid line represents the ratio of these ions to Na+ in sea water.
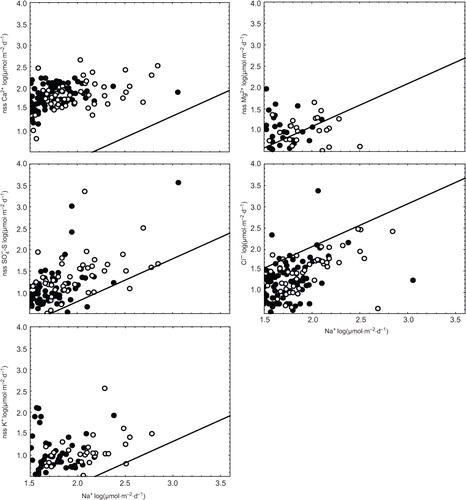
This deficit of Cl− in the atmospheric deposition has been previously reported in other studies of the Mediterranean basin. Mihajlidi-Zelic et al. (Citation2006) found a deficit of Cl− in bulk deposition of a coastal site in the Adriatic Sea with the highest values of Na+/Cl− ratios during the driest months. Mihalopoulos et al. (Citation1997) and Koçak et al. (Citation2004) also found Cl− deficits in lower tropospheric aerosols in the eastern Mediterranean. During the winter, the Na+/ Cl− ratio reflected the marine ratio whereas during the summer (when the rainfall reaches its lowest values) this ratio increased above the marine ratio. On the other hand, Balestrini et al., (Citation2000) did not find departures of Na+/ Cl− marine ratio in dry nor wet deposition in five sites of the northern Italy region where the precipitation values ranged from 852 mm·y−1 to 1959 mm·y−1. These precipitation values were markedly higher than the values in this study. All these previous studies suggest a link between dryness and the Cl− deficit.
Sodium chloride from sea salt can react in the atmosphere with gaseous nitric acid producing sodium nitrate and chloride acid. This reaction can occur in the surface of aerosol particles (Pakkanen, Citation1996) and a certain fraction of sea-salt Cl− can be replaced by NO3 − . In addition, the amount of NO3 − in sea water is negligible compared with the main ionic concentrations. Therefore, the marine Na+/Cl− equivalent ratio of 0.85 can be assumed as representative of the original Na+/(NO3 −+Cl−) ratio in sea water (Pakkanen, Citation1996). Deviations from 0.85 indicate enrichments or impoverishments of these ions with respect to the marine proportion. shows the mean values of Na+/ Cl− and Na+/(NO3 − +Cl−) ratios in both dry and wet deposition. The Na+/ Cl− ratio was above the marine ratio, without statistical differences between dry and wet deposition (A). However, the Na+/(NO3 −+Cl−) ratio decreases markedly in both types of deposition, being close to the marine ratio in the wet deposition and significantly higher in dry deposition (B).
Fig. 3 Mean ratios (bars) and standard errors (whiskers) of: (A) Na+ to Cl− in dry and wet deposition (not statistically different; t-test=0.887; p=0.376) and (B) Na+ to (Cl−+NO3 −). These ratios in dry deposition are significantly higher than in wet deposition (t-test=2.673; p<0.01). Note the change of scale in the two plots. The solid lines represent the Na+ to Cl− ratio of 0.85 in sea water.
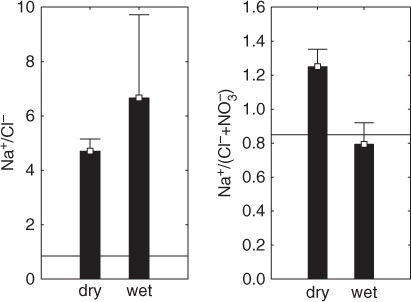
These significant differences between dry and wet deposition in the Na+/(NO3 − +Cl−) ratios, provide some insights in the process of Cl− losses from the particulate aerosol. The ratio values in wet deposition of about 0.85, or slightly lower, could be attributed to a substitution of Cl− by NO3 − in the surface of sea salt or soil particles after reacting with nitric acid. In dry deposition samples, although the ratio Na+/(NO3 − +Cl−) decreased notably with respect to Na+/Cl− ratio, it was higher than the marine proportion, suggesting a loss of Cl− which it is not exchanged by NO3 −. Cl− ions can also evaporate directly (Pakkanen, Citation1996) or react with other acidic species. Our results suggest a lack of NO3 − available in dry deposition to substitute Cl− in the atmospheric particles. In fact, NO3 − deposition in the south-east of the Iberian Peninsula is scarce compared with other sites from the north of Europe or eastern Mediterranean area and is mostly related to the wet deposition (). This process in the study area should be different to what is occurring in the eastern Mediterranean where evidences linking dust and sea salts with nitrates have been previously reported (Mara et al., Citation2009).
3.3. Dry and wet deposition
Marked differences were observed concerning the relative contribution of dry and wet deposition to total inputs for the different chemical species studied. Dry deposition was the main pathway for the atmospheric delivery of PM, TP, SRP, Ca2+, Mg2+ and K+, whereas Na+, TN, NO3 − and SO4 2− showed a clear predominance in wet deposition ().
PM was three times higher in dry than in wet deposition (). This could be due to the high number of weeks without rain, and the proximity of the study site to Sahara desert. It has been reported that the ratio of dry to wet deposition of dust decreases with the distance from the source of emissions, as the readily dry-deposited substances are depleted from the air mass as they travel downwind (Lovett, Citation1994).
Concerning phosphorus compounds, TP deposition was almost twice higher in dry than in wet mode, and SRP was more than three times. These results are similar to previous studies showing the predominance of dry over wet deposition for phosphorus (Anderson and Downing, Citation2006). Phosphorus delivered by deposition is derived mostly from soil and is not incorporated in a great extent into rainfall. The deposition of Ca2+, Mg2+ and K+ were also higher in dry than in wet deposition, but less markedly than for PM, TP and SRP.
The predominance of Na+, TN, NO3 − and SO4 2− in wet deposition indicates that, despite nitrates and sulphates undergoing long-range transport associated with dust (Dentener et al., Citation1996), the free gaseous phases of these compounds are predominately incorporated into wet deposition. Nevertheless, regarding TN, these results should be considered with precaution because NHx compounds that can be a significant source of N in dry deposition appear to not be properly sampled in the dry collectors (Anderson and Downing, Citation2006).
3.4. Effects of Saharan dust intrusions on the chemistry of dry and wet deposition
In the dry weeks (complete absence of rain), the effect of the Saharan dust intrusion is evidenced by the statistically significant increase of most chemical species deposited (). Only dry deposition of SiO2, NO3 − SO4 2− and Na+ did not show significant increases linked to the occurrence of Saharan dust events.
Table 3. Mean quantities (± standard error) of the chemical species collected in dry weeks (complete absence of rain) and in rainy weeks (presence of rain) from December 2000 to December 2002. p shows probability values according to Kolmogorov–Smirnov test for mean differences
In the rainy weeks, the effect of Saharan dust intrusions on dry deposition was not statistically significant for any of the chemical species analysed (). This absence of statistical significance can be interpreted as the effect of the atmospheric washout by the rain that reduces the availability of aerosols for the following dryfall. For instance, the total (dry+wet) PM deposition in weeks submitted to Saharan dust intrusions was similar in rainy weeks (19.5+15.6 mg m−2 d1 [wet+dry, respectively]) to that in dry weeks (36.7 mg m−2 d−1, dry deposition). Similarly, the total PM deposition in weeks without Saharan dust intrusions was similar in rainy weeks (12.1+15.5 mg m−2 d−1 [wet+dry, respectively]) and in dry weeks (22.5 mg m−2 d−1, dry deposition) (). Therefore, these results point out that the total PM deposition was similar irrespectively of the occurrence of rain, and that the effect of rain washout only leaves less PM (and associated soluble ions) for the following dry deposition. On the other hand, there are no effects of Saharan dust on wet deposition except the marginally significant lower quantities of Na+ collected ().
The comparison of the chemical species between dry and wet deposition showed important differences in weeks with rain events. There were higher deposition rates of TN, NO3 −, Na+ and SO4 2− in wet than in dry mode and particularly higher for TN, Cl−, SO4 2− and Na+ in weeks without Saharan dust intrusions (). Since TN, Cl − , SO4 2− and Na+ have either a gaseous phase or a marine origin, it is highly probable that an important source of these last elements is sea salt or gases captured by the westerly winds from the Atlantic Ocean, which are the main drivers of rain in the study area (Naya, Citation1984).
Because Saharan dust intrusions and rain events can interact affecting the chemical signature of dry and wet deposition, we performed ANCOVA analyses to test the effect of Saharan dust intrusions (categorical variable, presence vs. absence) on the weekly deposition considering the amount of rain (continuous variable) as a covariate (). In dry deposition, both Saharan dust intrusions and rain affected the deposition of TP, Ca2+ and, marginally, PM. Saharan dust intrusions increased the deposition of these analytes while the amount of rain showed inverse relationships (the higher rain, the lower the analyte quantity) (). Deposition rates of SRP and SiO2 did not appear to be affected by Saharan dust intrusions although the increases of rain decreased their dry deposition (). Other chemical species in dry deposition such as TN and Mg2+ appeared to be affected by Saharan dust intrusions but not by the quantity of rain. In contrast, dry deposition of NO3 −, Na+, K+, Cl− and SO4 2− did not appear to be affected by dust intrusions nor by the rain quantity (). These last ions may be linked to atmospheric particles that are removed less efficiently by the type of rain that occurs in the study area. It is known that the size of raindrops and the intensity and duration of the rain events affect the size of particles that are washout from the atmosphere (Pranesha and Kamra, Citation1997). On the other hand, the below-cloud scavenging may not be the dominant process in the removal of atmospheric components (Celle-Jeanton et al., Citation2009).
Fig. 4 Particulate matter (PM), total phosphorus (TP) and Ca2+ in dry deposition as a function of the rainfall and the presence (solid dots and continuous line) or not (empty dots and dashed line) of Saharan dust intrusions. All relationships are statistically significant according to ANCOVA results shown in .
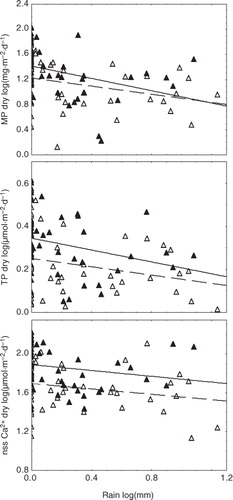
Table 4. ANCOVA analyses of Saharan intrusions effect (categorical variable) on deposition, taking into account the amount of rain as a covariate (continuous variable). p shows the probability values of F statistic
In wet deposition, only Na+ and, marginally, Cl− were influenced by both Saharan dust intrusions and the rain quantity. Saharan dust intrusions decreased the deposition of Na+ and Cl−, while the quantity of rain increased their deposition (). This result corroborated the marine origin of both ions. The rest of ions and the PM did not appear to be influenced by Saharan dust intrusions in wet deposition (). In contrast, the quantity of rain affected positively all ions and particles, except nss Mg2+ and nss SO4 2−. Although it is known that increases in rain reduce the solutes concentration in the wet deposition by dilution (Balestrini et al., Citation2000), they can still result in higher deposition (Anderson and Downing, Citation2006) due to larger total washout of the atmosphere as it appears to be the case in this study.
Fig. 5 Na+ and Cl− in wet deposition as a function of the rainfall and the presence (solid dots and continuous line) or not (empty dots and dashed line) of Saharan dust intrusions. Na+ and Cl− relationships are statistically significant according to ANCOVA results shown in .
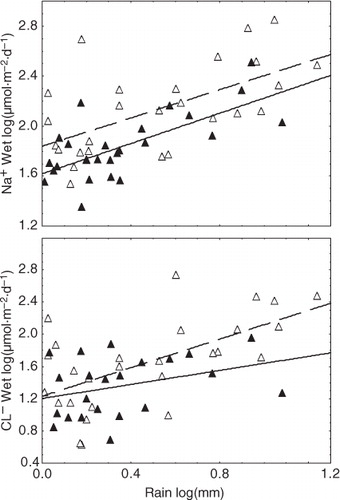
Therefore, the interaction between Saharan dust intrusions and the rain quantity showed two contrasting effects depending on the type (wet or dry) of deposition. Dry deposition of PM, TP and Ca2+ were higher in weeks with Saharan dust intrusions and lower quantity of rain, while Na+ and Cl− were more representative in wet deposition in weeks without Saharan intrusions and higher quantity of rain.
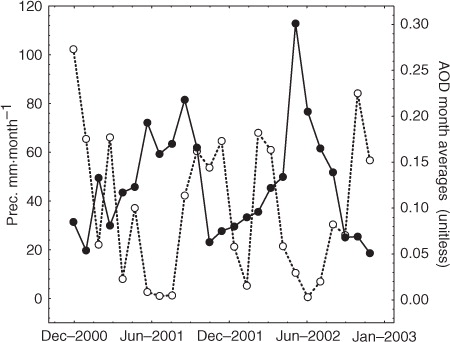
In a seasonal basis, it is known that Saharan intrusions over Europe increased during spring and summer (Moulin et al. Citation1997), when the intense heating of Sahara and the consequent development of the North African thermal low originating a convective system that pumps dust up to 5000 m asl (Escudero et al., Citation2005). These authors also show that a wide majority of these episodes occurs without local convective rains over Iberian Peninsula. Accordingly, satellite measures of aerosol concentration over study area showed its highest values in spring and summer, just when rain shows its lowest values (). The aerosol deposition of PM, TP and Ca2+ also follows this seasonal pattern as it was previously reported (Morales-Baquero et al., Citation2006, Pulido-Villena et al., Citation2006).
Fig. 6 Times series monthly averages of aerosol optical depth (AOD, solid line) provided by NASA Giovanni portal: (http://gdata1.sci.gsfc.nasa.gov/daac-bin/G3/gui.cgi?instance_id=MISR_Monthly_L3) and precipitation (dashed line): (http://gdata1.sci.gsfc.nasa.gov/daac-bin/G3/gui.cgi?instance_id=GPCC_Monthly). Values are integrated for the study area as shown in the frame of .
4. Summary and conclusions
Three major conclusions can be extracted from this study. First, dry deposition dominates the atmospheric delivery of PM, TP, SRP, Ca2+, Mg2+ and K+, while wet deposition dominates the atmospheric delivery of Na+, TN, NO3 − and SO4 2− in the study area; second, the chemical composition of the dry deposition clearly reflected the effect of Saharan dust intrusions during the dry weeks, when the deposition rates of PM, TP, SRP, Ca2+, Mg2+ and K+ were higher than in weeks without intrusions; and third, the wet deposition of ions Cl − and Na+ was lower under the influence of Saharan dust intrusions and increased as the quantity of rain increased.
In general, this study underlines the need to quantify dry deposition, particularly in arid and semi-arid regions, which is relevant not just for the amount of soluble substances but also for the chemical species deposited in comparison with the wet deposition. Dry deposition of some elements of biogeochemical interest for ecosystems (as P, Ca2+, Mg2+ and K+) are therefore related to dust long-range transport. This evidence complements previous studies performed in regions with higher rainfall. For instance, Balestrini et al. (Citation2000) concluded that, in northern Italy, wet deposition reflects long-range transport phenomena, while dry deposition is more linked to local pollution levels. There, the rainfall (852–1959 mm·y −1 and absence of months without rain) was much higher than in our locality (507 mm·y−1 and months without rain). Therefore, the relative contribution of dry and wet deposition for the supply of elements from the atmosphere is, to some extent, depending on the precipitation regime in the area. The dryfall predominance is likely also to be relevant in many other world arid areas, particularly in those ones included within the ‘dust belt’ zone (Prospero et al., Citation2002; Mladenov et al., Citation2011). In these zones, the atmospheric delivery of elements of biogeochemical interest might be both quantitatively and qualitatively different to areas with predominant wet deposition.
5. Acknowledgements
We are grateful to J. R. Francia (CIFA, Granada, Spain) for permission to install the atmospheric deposition collectors. We thank two anonymous reviewers who helped to improve an earlier version of this work. Satellite analyses used in this article were produced with the Giovanni online data system, developed and maintained by the NASA GES DISC. Financial support was provided by the Spanish Ministry of Education and Ministry of Environment projects CICYT AMB99-0541 and CICYT REN03-03038.
Related Research Data
References
- Alados-Arboledas L. , Lyamani H. , Olmo F. J . Aerosol size properties at Armilla Granada (Spain). Q. J. R. Meteorol. Soc. 2003; 129(590): 1395–1413.
- Al-Momani I. F. , Tuncel S. , Eler Ü. , Örtel E. , Sirin G. , co-authors . Major ion composition of wet and dry deposition in the eastern Mediterranean basin. Sci. Total. Environ. 1995; 164: 75–85.
- Anderson K. A. , Downing J. A . Dry and wet atmospheric deposition of nitrogen, phosphorus and silicon in an agricultural region. Water. Air. Soil. Poll. 2006; 176: 351–374.
- APHA. Standard Methods for the Examination of Water and Wastewater 18th ed . 1992; Washington, DC: American Public Health Association.
- Avila A. , Alarcón M . Relationship between precipitation chemistry and meteorological situations at a rural site in NE Spain. Atmos. Environ. 1999; 33: 1663–1677.
- Avila A. , Alarcón M. , Queralt-Mitjans I . The chemical composition of dust transported in red rains: its contribution to the biogeochemical cycle of a holm oak forest in Catalonia (Spain). Atmos. Environ. 1998; 32: 179–191.
- Avila A. , Peñuelas J . Increasing frequency of Saharan rains over northeastern Spain and its ecological consequences. Sci. Total. Environ. 1999; 228: 153–156.
- Balestrini R. , Galli L. , Tartari G . Wet and dry atmospheric deposition at prealpine and alpine sites in northern Italy. Atmos. Environ. 2000; 34: 1455–1470.
- Bartoli G. , Migon C. , Losno R . Atmospheric input of dissolved inorganic phosphorus and silicon to the coastal north-western Mediterranean Sea: fluxes, variability and possible impact on phytoplankton dynamics. Deep. Sea. Res. Part. 1. 2005; 52: 2005–2016.
- Bergametti G. , Remoudaki E. , Losno R. , Steiner E. , Chatenet B. , co-authors . Source, transport and deposition of atmospheric phosphorus over the north-western Mediterranean. J. Atmos. Chem. 1992; 14: 501–513.
- Camarero L. , Catalan J . Chemistry of bulk precipitation in the central and eastern Pyrenees, north-east Spain. Atmos. Environ. 1993; 27(1): 83–94.
- Celle-Jeanton H. , Travi Y. , Loye-Pilot M. D. , Huneau F. , Bertrand G . Rainwater chemistry at a Mediterranean inland station (Avignon, France): local contribution versus long range supply. Atmos. Res. 2009; 91(1): 118–126.
- Chadwick O. A. , Derry L. A. , Vitousek P. M. , Huebert B. J. , Hedin L. O . Changing sources of nutrients during four million years of ecosystem development. Nature. 1999; 397: 491–497.
- Dentener F. J. , Carmichel G. R. , Zhang Y. , Lelieveld J. , Crutzen P. J . Role of mineral aerosol as a reactive surface in the global troposphere. J. Geophys. Res. 1996; 101: 22869–22889.
- Escudero M. , Castillo S. , Querol X. , Avila A. , Alarcón M. , co-authors . Wet and dry African dust episodes over eastern Spain. J. Geophys. Res. 2005; 110: 1–15.
- Goudie A. S. , Middleton N. J . Saharan dust storms: nature and consequences. Earth. Sci. Rev. 2001; 56: 179–204.
- Izquierdo R. , Benítez-Nelson C. R. , Masqué P , Castillo S. , Alastuey A. , co-authors . Atmospheric phosphorus deposition in a near-coastal rural site in the NE Iberian Peninsula and its role in marine productivity. Atmos. Environ. 2012; 49: 361–370.
- Jickells T. D. , An Z. S. , Andersen K. K. , Baker A. R. , Bergametti G. , co-authors . Global iron connections between desert dust, ocean biogeochemistry and climate. Science. 2005; 308: 6771.
- Koçak M. , Kubilay N. , Mihalopoulos N . Ionic composition of lower tropospheric aerosol at a north-eastern Mediterranean site: implications regarding sources and long-range transport. Atmos. Environ. 2004; 38: 2067–2077.
- Kubilay N. , Nickovic S. , Moulin C. , Dulac F . An illustration of the transport and deposition of mineral dust onto the eastern Mediterranean. Atmos. Environ. 2000; 34: 1293–1303.
- Li J. , Pósfai M. , Hobbs P. V. , Buseck P. R . Individual aerosol particles from biomass burning in southern Africa: 2, compositions and aging of inorganic particles. J. Geophys. Res. 2003; 108: 1–12.
- Lovett G. M . Atmospheric deposition of nutrients and pollutants in North America: an ecological perspective. Ecol. Appl. 1994; 4: 630–650.
- Loÿe-Pilot M. D. , Martin J. M . Güerzoni S , Chester S . Saharan dust input to the western Mediterranean: an eleven years record in Corsica. The Impact of Desert Dust Across the Mediterranean. 1996; Dordrecht: Kluwer Academic. 191–199.
- Mara P. , Mihalopoulos N. , Gogou A. , Daehnke K. , Schlarbaum T. , co-authors . Isotopic composition of nitrate in wet and dry atmospheric deposition on Crete in the eastern Mediterranean Sea. Global. Biogeochem. Cycles. 2009; 23: GB4002.
- Markaki Z. , Loÿe-Pilot M. D. , Violaki K. , Benyahya L. , Mihalopoulos N . Variability of atmospheric deposition of dissolved nitrogen and phosphorus in the Mediterranean and possible link to the anomalous seawater N/P ratio. Mar. Chem. 2010; 120: 187–194.
- Mihajlidi-Zelić A. , Deršek-Timotić I. , Relića D. , Popović A. , D--ord-ević D . Contribution of marine and continental aerosols to the content of major ions in the precipitation of the central Mediterranean. Sci. Total. Environ. 2006; 370: 441–451.
- Mihalopoulos N. , Stephanou E. , Kanakidou M. , Pilitsidis S. , Bousquet P . Tropospheric aerosol ionic composition in the eastern Mediterranean region. Tellus. 1997; 49: 314–326.
- Mladenov N. , Pulido-Villena E. , Morales-Baquero R. , Ortega-Retuerta E. , Sommaruga R. , co-authors . Spatiotemporal drivers of dissolved organic matter in high alpine lakes: role of Saharan dust inputs and bacterial activity. J. Geophys. Res. 2008; 113: 1–10.
- Mladenov N. , Reche I. , Olmo F. J. , Lyamani H. , Alados-Arboledas L . Relationships between spectroscopic properties of high altitude organic aerosols and sun photometry from ground-based remote sensing. J. Geophys. Res. Biogeosciences. 2010; 115: 1–13.
- Mladenov N. , Sommaruga R. , Morales-Baquero R. , Laurion I. , Camarero L. , co-authors . Dust inputs and bacteria influence dissolved organic matter in clear alpine lakes. Nat. Commun. 2011; 2: 405.
- MMA (Spanish Ministry “Ministerio de Medio Ambiente”). Publications Center . Water White Book (in spanish). 2000; Madrid: Spanish Ministry of Environment.
- Morales-Baquero R. , Pulido-Villena E. , Reche I . Atmospheric inputs of phosphorus and nitrogen to the south-west Mediterranean region: biogeochemical responses of high mountain lakes. Limnol. Oceanogr. 2006; 51: 830–837.
- Moulin C. , Lambert C. E. , Dulac F. , Dayan U . Control of atmospheric export of dust from North Africa by the North Atlantic Oscillation. Nature. 1997; 387: 691–694.
- Naya A . Meteorología Superior. 1984; Espasa-Calpe, Madrid, 546.
- Pakkanen T. A . Study of formation of coarse particle nitrate aerosol. Atmos. Environ. 1996; 30(14): 2475–2482.
- Pieri L. , Matzneller P. , Gaspari N. , Marotti I. , Dinelli G. , co-authors . Bulk atmospheric deposition in the southern Po Valley (northern Italy). Water. Air. Soil. Poll. 2010; 210: 155–169.
- Pranesha T. S. , Kamra A. K . Scavenging of aerosol particles by large water drops. 3. Washout coefficients, half-lives, and rainfall depths. J. Geophys. Res. Atmos. 1997; 102: 23947–23953.
- Prospero J. M . Guerzoni S , Chester R . Saharan dust transport over the North Atlantic Ocean and Mediterranean: an overview. The Impact of Desert Dust Across the Mediterranean. 1996; Dordrecht: Kluwer Academic. 133–151.
- Prospero J. M. , Ginoux P. , Torres O. , Nicholson S. E. , Gill T. E . Environmental characterization of global sources of atmospheric soil dust identified with the NIMBUS 7 Total Ozone Mapping Spectrometer (TOMS) absorbing aerosol product. Rev. Geophys. 2002; 40: 1–31.
- Pulido-Villena E. , Reche I. , Morales-Baquero R . Significance of atmospheric inputs of calcium over the south-western Mediterranean region: high mountain lakes as tools for detection. Global. Biogeochem. Cycles. 2006; 20: 1–9.
- Pulido-Villena E. , Reche I. , Morales-Baquero R . Evidence of an atmospheric forcing on bacterioplankton and phytoplankton dynamics in a high mountain lake. Aquat. Sci. 2008a; 70: 1–9.
- Pulido-Villena E. , Wagener T. , Guieu C . Bacterial response to dust pulses in the western Mediterranean: implications for carbon cycling in the oligotrophic ocean. Global. Biogeochem. Cycles. 2008b; 22: 1–12.
- Querol X. , Alastuey Y. , Rodríguez S. , Viana M. M. , Artiñano B. , co-authors . Time series analysis (1996–2000) of the level of airborne particles in Spain (in Spanish). 2002; Spanish Ministry of Environment. Madrid, 555.
- Querol X. , Alastuey Y. , Rodríguez S. , Viana M. M. , Artiñano B. , co-authors . Study and assessment of atmospheric pollution by particulate matter in Spain. Final reports (in Spanish). 2003; Madrid: IJA-CSIC, ISCIII, CIEMAT, University of Huelva, University of Vasque Country, Spanish Ministry of Environment.
- Schlesinger W. H . Biogeochemistry: An Analysis of Global Change. 1997; Academic Press, New York, 588.
- StatSoft Inc. Statistica for Windows (computer program manual). 1997; Tulsa: StatSoft Inc.
- Wesely M. , Hicks B . A review of the current status of knowledge on dry deposition. Atmos. Environ. 2000; 34: 2261–2282.