ABSTRACT
This paper presents a study of a strong desert dust episode over the Iberian Peninsula, and its effect on the spectral ultraviolet (UV) irradiance in Granada, Spain. Remote sensing measurements, forecast models, and synoptic analysis are used to identify a Saharan desert dust outbreak that affected the Iberian Peninsula starting 20 July 2009. Additionally, a Bentham DMc150 spectroradiometer is employed to obtain global, direct and diffuse spectral UV irradiances every 15 minutes in Granada. The desert dust caused a large attenuation of the direct UV irradiance (up to 55%), while the diffuse UV irradiance increased up to 40% at 400 nm. The UVSPEC/LibRadtran radiative transfer model is used to study the spectral dependence of the experimental UV irradiance ratios (ratios of spectral irradiance for the day with the highest aerosol load to that measured in days with low–moderate load). The spectral increase or decrease of the UV direct irradiance ratios depends on a new parameter: a threshold wavelength. The spectral dependence of the UV diffuse irradiance ratio can be explained because under the influence of the intense dust outbreak, the Mie scattering by aerosols at shorter wavelengths is stronger than the Rayleigh scattering by gases. Finally, the sensitivity analysis of the aerosol absorption properties shows a substantial attenuation of UV spectral irradiance with a weak spectral dependence.
1. Introduction
Ultraviolet (UV) waveband is the portion of solar radiation with the shortest wavelengths reaching the Earth's atmosphere. UV range is divided into three sub-intervals: UV-C (200–280 nm), UV-B (280–315 nm) and UV-A (315–400 nm), but only UV-B and UV-A reach the surface. UV radiation is involved in different chemical and biological processes and its detrimental effects on human beings, animals and plants are well known (Diffey, Citation1991). A typical effect on human beings is sunburn (erythema). The erythemal action spectrum gives the effectiveness of the wavelengths to produce the erythema (McKinlay and Diffey, Citation1987), and the UV radiation weighted by this spectrum is named the ultraviolet erythemal radiation (UVER).
Gases and particles due to absorption and scattering processes affect UV radiation transmitted across the Earth's atmosphere. Several authors (McKenzie et al., Citation1991; de Miguel et al., Citation2011b; Román et al., Citation2012b) reported a strong relationship between the decrease in UVER levels and the increase of the total ozone column (TOC) due to the strong ozone absorption in the UV-B waveband. The ozone absorption presents a weak influence on wavelengths higher than 315 nm (di Sarra et al., Citation2002). Sola et al. (Citation2008) studied the role of ozone in the spectral UV changes at different altitudes over sea level, finding an increase in the differences with the TOC.
The cross section for Rayleigh scattering with atmospheric molecules roughly varies inversely with the fourth power of the wavelength (Bodhaine et al., Citation1999). This implies larger attenuation (part of the radiation is backscattered to the space) and scattered radiation (diffuse radiation) in UV wavelengths than in other wavebands, such as the visible band. Thus, molecular scattering causes a large portion of diffuse radiation in the global (diffuse+direct) component, which depends on solar zenith angle (SZA). Many authors have evaluated the ratio of diffuse to global radiation (diffuse fraction). Parisi et al. (Citation2000) calculated the diffuse fraction at noon at three wavebands, giving 0.26, 0.20 and 0.14 for UVER, UV-A and visible band, respectively in Toowoomba (Australia). Utrillas et al. (Citation2007) reported an averaged diffuse fraction of 0.62 for UVER radiation using data with SZA lower than 70° for the clearest days in Valencia (Spain). Blumthaler and Ambach (Citation1991) observed an increase in the spectral UV diffuse fraction when wavelength decreases due to the stronger molecular scattering at shorter wavelengths, and Kaskaoutis et al. (Citation2006) found a power relationship between the spectral diffuse fraction and wavelength, which depends on atmospheric aerosol.
Both clouds and aerosol also modulate the UV radiation reaching the surface. The effect of clouds on short-term UV variability is intense, depending on cloud cover, type and cloud optical thickness (Schwander et al., Citation2002; Calbó et al., Citation2005; Bilbao et al., Citation2011; de Miguel et al., Citation2011a; Mateos et al., Citation2011). Additionally, the UV attenuation associated with aerosol varies with type and load (Balis et al., Citation2004). Kalashnikova et al. (Citation2007) studied the spectral effect of aerosol calculating the ratio of measured spectra under high aerosol load to spectra under low aerosol conditions, finding an increase in this ratio when wavelength increases for high aerosol load.
Desert dust (DD) scatters radiation but can also absorb, and this absorption is wavelength dependent, increasing when wavelength decreases (Russell et al., Citation2010). The DD absorption in the UV led to overestimations in the surface UV radiation from satellite retrievals since the absorption by aerosol is not taken into account (Krotkov et al., Citation2005; Meloni et al., Citation2005; Mateos et al., Citation2013).
The main goals of this work are the characterization of a DD event at Granada (South-Eastern Spain) and its effects on global, direct and diffuse UV irradiance using experimental and modelled data. Although several DD events have been identified and studied over South Europe (e.g. Cachorro et al., Citation2008; Guerrero-Rascado et al., Citation2009; Preißler et al., Citation2011), works focused on the influence of these episodes on spectral UV radiation are very limited (Antón et al., Citation2012a). Additionally, the novelty of this paper is the analysis of the quasi-simultaneous measurements of the global, direct and diffuse (retrieved from global and direct) spectral UV radiation from a Bentham spectroradiometer, which are essential to understand the processes involved in the attenuation of the UV radiation during desert dust events.
The structure of the paper is as follows: Section 2 presents the experimental site, instruments and data; Section 3 provides a detailed description and characterization of the Saharan dust event over the Iberian Peninsula in July 2009. The aerosol effect on spectral UV during the DD episode is studied in Section 4. Finally, the main conclusions are summarized in Section 5.
2. Experimental site and instrumentation
The Atmospheric Physics Group of the University of Granada (GFAT, http://atmosfera.ugr.es) took the measurements used in this paper from the rooftop of the Andalusian Center for Environmental Studies (CEAMA, 37.17° N, 3.61° W, 680 m a.s.l). The experimental site is in the city of Granada (Spain) located at the South-Eastern tip of the Iberian Peninsula. Atmospheric characteristics of Granada were described in detail by Lyamani et al. (Citation2011). In addition, the dust properties registered during Saharan episodes at the experimental site were presented by Valenzuela et al. (Citation2012a, Citation2012b).
The DMc150 spectroradiometer (Bentham manufacturer) is a double monochromator with a robotic mirror that can select between two different light sources. This spectroradiometer has a grating with 2400 lines per millimetre giving a spectral range from 250 to 650 nm with a resolution lower than 0.5 nm. The full width at half maximum (FWHM) is 1.05 nm, which was determined using a laser light at 325 nm. Bentham monochromator was fixed installed at CEAMA in 2007. This monochromator is connected to two diffusers using two optical fibres. The diffusers are installed at the CEAMA rooftop; the first is at 3 m above the ground mounted in a horizontal plate; the second diffuser has a limited field of view of 1.2° thanks to a collimator tube with three optic diaphragms which take measurements of direct sunlight only. The collimator tube is mounted in a sun tracker (2AP model, Kipp & Zonen) which has a pointing accuracy lower than 0.02° due to a sun sensor installed into the tracker. The sun disc is completely viewed by the diffuser due to the pointing accuracy and the field of view of 1.2°. The monochromator is installed in a container (weather proof) with temperature stabilized at 25°C by a Peltier cell air/air system. The spectroradiometer was programmed to take a spectrum of global and direct irradiance from 280 to 400 nm (0.5 nm steps) every 15 minutes. First, the instrument records a spectrum of global irradiance in approximately four minutes and then it measures a spectrum of the direct component, which also lasts nearly four minutes.
The instrument is periodically calibrated (every three months) using a mercury lamp (shift correction) and a pre-calibrated 120 W lamp (NIST standard) following the method of Sperling et al. (Citation1996). Firstly, the raw signal is wavelength shift corrected and then converted into physical units (Wm−2 nm−1) using the reference measurements of the calibrated lamp and convoluting the spectra assuming a triangular slit function of the spectroradiometer with a bandwidth of 1.05 nm FWHM (Slaper et al., Citation1995). Bernhard and Seckmeyer (Citation1999) quantified the uncertainties of a similar UV spectroradiometer finding, for SZA=30°, an expanded uncertainty (95% confidence) of 9.9%, 6.3% and 6.6% for 300, 350 and 400 nm, respectively; for SZA=60° the uncertainties are similar, except for 300 nm when it rises up to 12.7%. Diffuse irradiance is estimated using direct and global measurements following Iqbal (Citation1983):1
where θ is the SZA and I dif−λ , I g−λ , and I dir−λ , are the diffuse, global and direct (beam) irradiance at the λ-wavelength, respectively.
Aerosol optical properties are retrieved by measurements of a CIMEL CE-318 sun/sky photometer installed at the CEAMA rooftop close to Bentham spectroradiometer. CIMEL photometer takes direct sun measurements at 340, 380, 440, 500, 670, 870 and 1020 nm, and sky radiance measurements at 440, 670, 870 and 1020 nm in almucantar and principal plane configurations. The direct sun measurements are used to obtain the aerosol optical depth (AOD) and Ångström coefficients following the methodology described in Alados-Arboledas et al. (Citation2003). The estimated uncertainty in AOD is ±0.01 for λ >440 nm and ±0.02 for shorter wavelengths (Holben et al., Citation1998). Ångström coefficients describe the wavelength–AOD dependence by (Iqbal, Citation1983):2
where α is the Ångström Exponent (related to aerosol size), β the Ångström Turbidity (related to aerosol load), λ is the wavelength in microns and τ a−λ is the AOD at λ. In addition, single scattering albedo (SSA), particle size distribution and asymmetry parameter (g) are retrieved from the sky radiance measurements following the principal plane inversion method described by Olmo et al. (Citation2008). The accuracy of SSA and g parameters derived from this inversion method is approximately 5% while the accuracy of the size distribution rises to 10% for the radius interval 0.1–7 µm (Valenzuela et al., Citation2012c). Regularly, Langley plots at a high location in Sierra Nevada (2200 m a.s.l.) are performed for calibration purposes (Alcántara-Ruiz et al., Citation2004). More information about CIMEL CE-318 sun/sky photometer can be found in Holben et al. (Citation1998).
3. Characterization of the desert dust episode
Saharan desert dust episodes frequently appear in the Iberian Peninsula particularly in summer, being stronger in the South region (Toledano et al., Citation2007). A strong Saharan dust outbreak has been detected over the study area on 21 July 2009 using diverse information from remote sensing measurements, models, back-trajectories analysis and synoptic meteorological charts. Next, this episode is analysed in detail.
Measurements of AOD at 440 nm and Ångström Exponent are drawn in from 17 to 26 July 2009. A clear opposite behaviour between α and AOD appears after day 19. Studies mentioned in Section 1 in relation to Saharan dust events reported low values of α and high aerosol optical depths as a typical characteristic of DD. shows values of variables derived from the CIMEL sun-photometer at 9:30 UTC during the study period. The selected days and times correspond with cloud-free measurements (global and direct irradiance) of the Bentham spectroradiometer. The passive remote sensing measurements reveal that the DD episode started on 20th July, reaching the maximum load on the 21st July with an AOD at 440 nm close to 0.8, i.e. the Ångström Exponent and the Ångström Turbidity 0.15 and 0.61, respectively. DD particles were in the atmosphere the following days according to the low Ångström Exponent (~0.4) obtained during those days.
Fig. 1. Aerosol optical depth at 440 nm and Ångström Exponent (calculated with AOD at 440, 670, 870 and 1020 nm) temporal evolution from 17 to 26 July 2009.
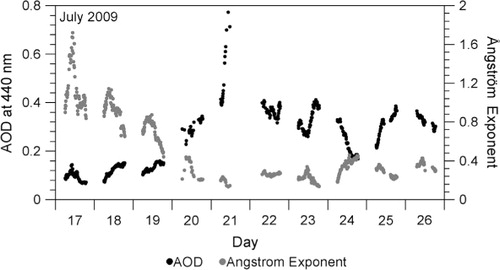
Table 1. Atmospheric characteristics in July 2009 at 9:30 UTC for different days
Additionally, another variable that clearly indicates the presence of DD aerosols after 20th July is the single scattering albedo. shows smaller SSA values (more absorbing particles) at 440 nm than at 670 nm after the 20th July, this behaviour exclusively related to DD aerosol (Lyamani et al., Citation2006; Russell et al., Citation2010). The asymmetry parameter in shows a higher value for days with desert dust (0.72–0.74) than days before the event (0.67–0.68), which is in agreement with values obtained by Meloni et al. (Citation2003) and Valenzuela et al. (Citation2012a), among others. Finally, the aerosol size distribution retrieved by CIMEL photometer measurements (not shown) has a stronger peak in the coarse mode on the 21st July, corresponding to dust particles (Cachorro et al., Citation2008; Valenzuela et al., Citation2012c). A higher peak in the coarse mode than the fine mode appears in the subsequent days; however the coarse mode is lower than for day 21. This result indicates that the coarse mode for days after 21st July is still dominant but weaker. Coarse and fine modes are similar before the 20th July.
Vertical aerosol profiles are measured at Granada with a Raman Lidar model LR331D400 (Raymetrics S.A., Greece) included in EARLINET and described in detail by Guerrero-Rascado et al. (Citation2009). Lidar is an active remote sensing technique and it provides attenuated backscatter profiles, which are useful to observe qualitatively the vertical distribution of the aerosol load. These profiles in the form of quicklooks are not shown in this paper, but it can be seen at the GFAT website mentioned above. Lidar information reveals that aerosol load was below 3000 m a.s.l. before 20th July, with the highest concentration at ground level. However, during the afternoon of 20th July, lofted aerosol layers were detected at higher altitudes, reaching 4000–5000 m a.s.l. Lidar quicklooks show lofted aerosol layers up to 6000 m a.s.l, with a stronger aerosol layer between 2000 and 3000 m a.s.l. The maximum height of aerosol layer decreased down to 5000 m a.s.l. (showing the same strong layer) on 23rd July and to 4000 m a.s.l. on 24th July. The presence of lofted aerosol layer at high altitudes is typical of DD intrusion (Guerrero-Rascado et al., Citation2009; Córdoba-Jabonero et al., Citation2011; Preißler et al., Citation2011).
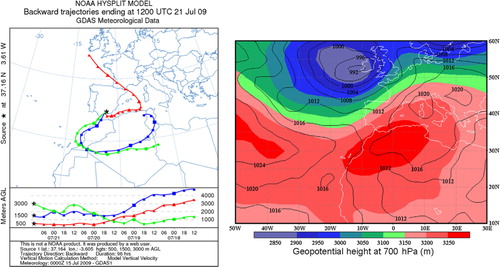
The Air Resources Laboratory's HYbrid Single-Particle Lagrangian Integrated Trajectory (HYSPLIT) model is used to determine the origin source of the DD intrusion. This model calculates the back and forward trajectories of the air masses for different altitudes and locations (Draxler and Rolph, Citation2012). (left panel) shows the 96 hours back-trajectories at 500, 1500 and 3000 m a.g.l. for 21 July 2009 at 12:00 UTC in Granada calculated using the GDAS (Global Data Assimilation System) data as inputs directly in the web http://ready.arl.noaa.gov/HYSPLIT.php. The 500 m height a.g.l. back-trajectory suggests the arrival of an air mass on 21st July at this altitude coming from the Western-Mediterranean basin, which were previously advected from the Atlantic region to the Pyrenees. In contrast, the back-trajectories at 1500 and 3000 m height show that air masses from the Saharan desert came to Granada, in agreement with the mineral features detected with the CIMEL retrievals. Moreover, the air mass at 3000 m height crossed the desert at low altitude, which means that this air mass could be heavily loaded with DD. The back-trajectories at 2000, 4000 and 5000 m height a.g.l. (not shown) show the same North-African origin. These trajectories can be explained by the prevalent synoptic conditions shown in (right panel). Sea level pressure and the 700 hPa geopotential height (data provided by the NOAA-ESRL Physical Sciences Division, Boulder Colorado from their Web site at http://www.esrl.noaa.gov/psd/) are represented in (right panel). High pressure in the high levels in North Africa (the high geopotential height in the figure) appeared due to strong warming in the surface which developed a thermal low in North Africa; it implied a considerable vertical growth of the boundary layer; this convective system pumped dust up to high altitudes injecting dust into the mid-troposphere followed by dust being transported toward the Iberian Peninsula by the eastern branch of the high cyclone over North Africa (Escudero et al., Citation2005). This synoptic scenario is identified as North African High at Altitude (NAH-A), one of the four described by Escudero et al. (Citation2005) as responsible of Saharan dust intrusions over the Iberian Peninsula. In addition, Toledano et al. (Citation2007) found that the NAH-A scenario is the most frequent and the only synoptic condition that leads to DD outbreaks over the Iberian Peninsula in summer.
Fig. 2. HYSPLIT 96-hour back trajectories at 500, 1500 and 3000 m a.g.l. for 21 July 2009 at 12:00 UTC (left panel). Geopotential height at 700 hPa (shadow) and pressure at sea level in hPa (black lines) for 21 July 2009 at 12:00 UTC (right panel).
Regarding to the other days, the calculated back-trajectories for the 20th July (not shown) also show Saharan origin at all levels excluding 500 and 1500 m a.g.l., which do not present a clearly defined origin. This fact indicates that Saharan intrusion started on 20th July in the higher atmosphere altitudes (faster layers), but the layers with highest desert aerosol load (2000–3000 m a.s.l. indicated by the Lidar) entered the Iberian Peninsula on 21st July. In addition, the back-trajectories before 20th July suggest the arrival of North Atlantic air masses for those days. On 23rd July only the air masses arriving at 3000 and 4000 m a.g.l. came from the Saharan desert, and the days after that the air masses arriving at high altitudes crossed the desert regions also but at high altitudes, thus justifying less aerosol load.
Two forecast models that predict Saharan dust events are used in order to study the episode on a global scale. The Dust REgional Atmospheric Modelling model (DREAM; http://www.bsc.es/projects/earthscience/DREAM/) predicts the atmospheric life cycle of the eroded DD. This model, which provides information on the columnar Saharan aerosol load, predicted a DD intrusion from South-Eastern to North-Western Europe, forecasting a weak outbreak of the dust plume into the Iberian Peninsula on 20 July 2009 at noon. The model forecasted the spreading of the plume over Southern France on 21st July. Moreover, the model predicted that desert load crossed the Mediterranean Sea and Central Europe after 21st July. The Navy Aerosol Analysis and Prediction System (NAAPS; http://www.nrlmry.navy.mil/aerosol/) global aerosol model predicts the aerosol concentration in surface discerning between aerosol types (sulphur, smoke and dust emissions). The NAAPS images (not shown) reveal a DD plume evolution similar to that forecasted by DREAM, but NAAPS predicted the maximum dust concentration in surface on 22nd July over the Iberian Peninsula, a day later than the maximum dust in load in column. Cachorro et al. (Citation2008) also found a delay between the dust in surface and in column in a Saharan episode over the Iberian Peninsula and they stated that this delay depends on the deposition process, the characteristics of the desert dust event and also the sampling technique. Guerrero-Rascado et al. (Citation2009) and Córdoba-Jabonero et al. (Citation2011) found similar results.
4. Desert dust effects on spectral UV irradiance
A simple way to study the aerosol influence on spectral solar irradiance is through the ratio of the measurements under desert to those under clearer sky conditions. The advantage of analysing these ratios is that the instrumental errors are minimized (Badarinath et al., Citation2007). Following the method used by Antón et al. (Citation2012a), the UV spectral measurements recorded on 21 July 2009 at 9:30 UTC under high desert load and cloud-free conditions are divided by the cloud-free UV spectral measurements of the next and previous days at the same hour. The selected days are listed in , corresponding to those cases with availability of cloud-free UV spectral measurements recorded at 9:30 UTC.
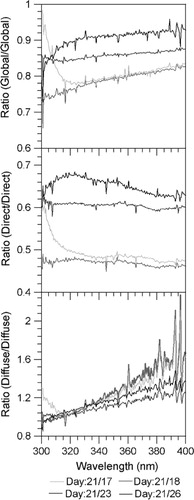
The ratios of the 21st July to the other days are shown in for global (up), direct (middle) and diffuse (down) UV irradiance. The sub-sections 4.1, 4.2 and 4.3 analyse these three plots. Additionally, sub-section 4.4 explains the role of the DD absorbing properties on the global, direct and diffuse ratios.
Fig. 3. Ratio of the global (up), direct (middle) and diffuse (down) UV spectral irradiance measured 21 July 2009 at 9:30 UTC (high desert dust conditions) to the measured one at 9:30 UTC on 17, 18, 23 and 26 July 2009.
4.1. Global ratio
The ratios derived from the global irradiance (global ratio) increase by approximately 5–10% from UV-B to UV-A, and the maximum variation can be observed for the ratios obtained from the days before the intrusion. Thus, the global UV irradiance shows a substantial reduction around 20% when day 21 is compared with the previous days, with an evident increase of the global ratio as a function of the wavelength. Antón et al. (Citation2012a) found a similar spectral dependence but with larger attenuation (40–50%) of global UV irradiance due to a higher aerosol load. The behaviour in the UV-B region is dominated by TOC () which is retrieved from the measurement of the direct solar irradiances (Bentham spectroradiometer) by a differential optical absorption technique using the double-pair wavelengths of 305.5–325.5 nm and 317.5–340.0 (Antón et al., Citation2012b).
The aerosol effect on global radiation can be evaluated as a combination of the effects on direct and diffuse components. In this sense, a quick look at the three plots of reveals that the spectral variations in the global ratio is clearly dominated by the behaviour of the diffuse component. The next two sub-sections analyse the direct and diffuse ratios in detail.
4.2. Direct ratio
Direct irradiance shows a greater attenuation than global irradiance, being around 50–55% for 21st July compared with 17th and 18th July (, middle). Additionally, this attenuation is somewhat larger than that obtained in other days also affected by DD (35–40%). It must be noted that the direct ratios slightly decrease with wavelength in contrast to the global ratios. To explain this behaviour, we use the following relationship between the direct (I
dir−λ
) and the extra-terrestrial () spectral solar irradiance assuming the independence of the different atmospheric processes (Iqbal, Citation1983):
3
where T
R−λ
, T
g−λ
and T
a−λ
are the spectral atmospheric transmittances due to Rayleigh scattering, gases absorption, and aerosol extinction, respectively, being this last defined as:4
This formula indicates that direct irradiance is directly modulated by aerosol extinction, which is the sum of absorption and scattering aerosol optical depths. The direct ratios shown in can be expressed using eq. (3) by the next equation:5
where the index i represents the values for the 21st July, and the index j is for the other days. If we consider the same atmospheric conditions for all days except the aerosol conditions (which can be valid for UV-A where the ozone effect is weak), then eq. (5) will be:6
and taking into account eq. (4):7
This expression shows that the dependence of the ratio Rij on wavelength is controlled by the differences between the AOD of the two days (j and i). The ratio increases with the wavelength when its derivate is positive, which happens when the next condition is true:8
which implies that λ must be:9
The last expression means that the ratio of eq. (7) increases with the wavelength only when the wavelength is higher than a threshold wavelength, λ
T
, which changes the aerosol effect on direct irradiance and is defined in microns by:10
As a particular case, if the Ångström Exponent is the same, the ratio of eq. (7) will increase in the full range with the wavelength when β j is higher than β i (λ T ~0), and decreases when β j is lower than β i (λ T ~∞). The threshold wavelength, λ T , has been calculated for the analysed days, being 715, 454, 1 and 1303 nm for days 17, 18, 23 and 26, respectively. These results are in agreement with the direct ratio in (middle), because in the UV range the ratio must decrease with wavelength except on day 23 (λ T <300 nm). In fact, the decrease slope is lower when λ T is near to the UV range. Therefore, the slight wavelength dependence in the UV range for the direct ratio could be related to a new parameter defined as a threshold wavelength in eq. (10) and its proximity to the UV range.
The ratios given by eq. (7) have been calculated for 340 and 380 nm using the corresponding experimental AOD at these two wavelengths measured by the CIMEL sun-photometer. These derived ratios are compared with the experimental direct ratio derived from the Bentham spectroradiometer. presents the relative differences between the derived (using CIMEL photometer) and experimental (with Bentham) Rij dir−λ at 340 and 380 nm for different days. The absolute differences are lower than 6% and 4% for 340 and 380 nm, respectively, which supports the explanation given for the spectral dependence of the direct ratio.
Table 2. Difference between the ratios obtained using eq. (7) and the experimental ratios of direct irradiance (day 21) to direct irradiance (days showed in the table), for the wavelengths of 340 (ΔR340) and 380 (ΔR380) nm
Meloni et al. (Citation2003) found a decrease with wavelength in the global ratio derived from global UV measurements with similar AOD and different Ångström Exponent. The threshold wavelength was approximately 3420 nm (decrease of direct ratio in UV range), therefore the wavelength dependence of the global ratio reported by Meloni et al. (Citation2003) could be likely related to the spectral variation of the direct component. Our results show an opposite wavelength dependence in the global ratio which could be associated with a stronger influence of diffuse component.
4.3. Diffuse ratio
(down) shows that the diffuse ratio presents a strong increase with the wavelength. Thus, the diffuse UV irradiance under the studied high DD load increases from 5–10% at 330 nm to 20–60% at 380 nm when it is compared with the remaining days with low–moderate aerosol load (the increase is higher when the reference day is clearer). This strong increase in the diffuse ratio with the wavelength may likely explain the spectral dependence of the global ratio. The ozone effect can be observed in the UV-B region causing the same effect as in the other panels. The peaks and noise around 393 and 397 nm are due to a wavelength shift between global and direct irradiances (used to estimate diffuse irradiance) which provides peaks near the Calcium Fraunhofer lines (Bernhard et al., Citation1998); this effect is known as the ‘ring effect’.
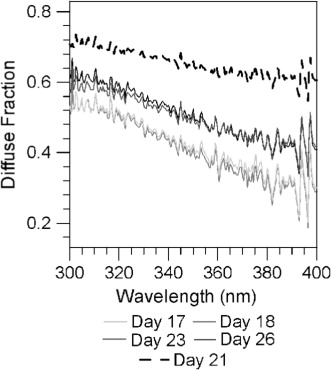
In order to understand better the effect of high desert dust load on diffuse UV irradiance, the diffuse fractions (diffuse/global) have been calculated for each wavelength (). The diffuse fraction is approximately 50–65% in the UV-B band and approximately 40–50% in the middle of the UV-A band for days with low aerosol load. Diffuse fraction increases on 21st July with values in the range 0.70–0.65. This is due to an increase in diffuse component (more scattered radiation) and a decrease in direct component, which reduces global irradiance. In addition, diffuse fraction decreases with the wavelength, but on 21st July this spectral dependence is weaker than the other days due to the weak spectral dependence of the aerosol extinction associate to DD aerosol. This fact may explain the behaviour of the diffuse ratio seen in (down), since the stronger decrease of diffuse component with wavelength the days with low aerosol load produces the opposite spectral dependence of diffuse ratio, which increases with wavelength.
Fig. 4. Spectral diffuse fraction measured different days at 9:30 UTC as a function of the wavelength.
A radiative transfer model has been used for trying to isolate the different factors that affect the diffuse solar radiation. The spectral irradiances have been simulated using the LibRadtran software package (in this paper the version 1.6 beta) where the main tool is the UVSPEC model, developed by Mayer and Kylling (Citation2005). The model has been run under 16 streams mode using the pseudo-spherical discrete ordinate algorithm (Dahlback and Stamnes, Citation1991), SDISORT, to solve the radiative transfer equation. The values in have been selected as input parameters, considering that SSA and g do not depend on wavelength and assuming their values to equal 440 nm. The atmosphere vertical distribution has been considered as mid latitudes summer (afglms), and the ground albedo has been fixed at 0.035. The aerosol vertical distribution has been the same as used by Román et al. (Citation2012a). The Ångström's coefficients have been calculated using the AOD at 440, 670, 870 and 1020 nm, therefore, the differences between the measured AOD at 340 and 380 nm and those predicted by Ångström's coefficients have been calculated; these differences are shown in (Δ380 and Δ340) and they are into the uncertainties of the AOD retrieval, which suggest that Ångström's law can be used in the UV range. Finally, the spectral irradiances for the same atmospheric conditions have been calculated for the analysed days. Moreover, the same simulations have been run without Rayleigh scattering (No Rayleigh), and considering a null aerosol load (No Aerosol).
Fig. 5. Experimental and simulated diffuse fraction under different sky conditions (up), and Rayleigh and aerosol optical depth (down) at 9:30 UTC for a clear day 17th July (left) and a strong desert dust day 21st July (right). The simulated diffuse fraction is taking into account the measured aerosols (Real Inputs), considering the real atmosphere without Rayleigh scattering (No Rayleigh) and taking into account the real atmosphere but without any aerosol (No aerosol).
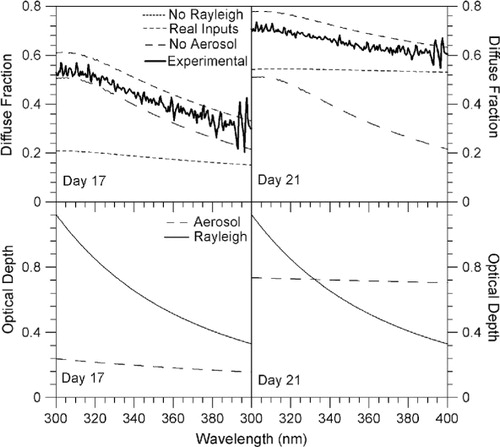
The simulations can be useful in understanding the different processes that modify UV radiation at ground level. (upper panels) shows the diffuse fraction for 17th (left) and 21st (right) July, taking into account different conditions. First, the experimental diffuse fraction presents a similar spectral dependency than the simulated (Real Inputs) for the two days. The simulated fraction overestimates by 10% the experimental values for both days. The modelled values show that the effect of Rayleigh scattering is the same in the two days, since the diffuse fraction is identical when the aerosol is null. However, when the Rayleigh scattering is not considered, the diffuse fraction varies from 0.2 (17th July) to 0.5 (21st July). The variation of the experimental diffuse fraction with the wavelength presents a behaviour between the modelled as ‘No Aerosol’ (strong decrease) and the modelled as ‘No Rayleigh’ (weak decrease). It indicates that the behaviour of diffuse fraction is controlled by both Mie (aerosol) and Rayleigh (molecules) scattering, but mainly by the dominant scattering effect.
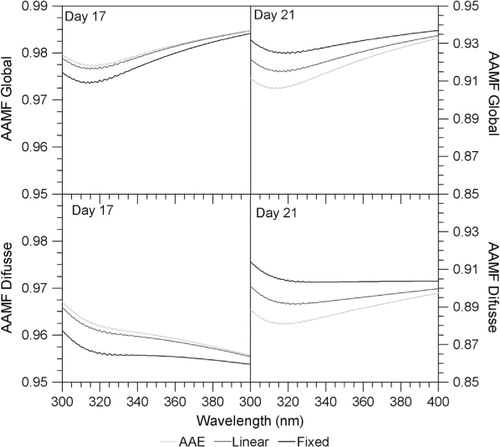
Fig. 6. Simulated spectral aerosol absorption modification factor in the global (up) and diffuse (down) components at 9:30 UTC for a clear day 17th July (left) and a strong desert dust day 21st July (right) taking into account different SSA values in the UV range. The AAMF values are calculated considering a fixed SSA equal to the measured SSA at 440 nm (Fixed), extrapolating the SSA in the UV range considering a linear variation between the measured SSA at 440 and 670 nm (linear), and taking into account SSA values calculated in the UV range using eq. (12) and eq. (13) and the measured SSA at 440 and 670 nm (AAE).
To discern the dominant effect, the Rayleigh optical depth (ROD) was calculated using the direct irradiance simulations under Rayleigh and no Rayleigh conditions. The ratio of the simulations with ‘Real Inputs’ to the simulations without Rayleigh scattering can be considered equal to T
R−λ
, and the ROD can be calculated using the next equation (Bodhaine et al., Citation1999):11
where τ R−λ is the ROD at λ. (down panels) presents AOD and ROD for 17th (left) and 21st (right) July. As can be expected, the scattered irradiance is mainly due to Rayleigh processes on 17th July. However, the high aerosol load on 21st July causes a higher AOD than ROD for wavelengths higher than 330 nm. It means that the diffuse radiation recorded on 21st July is mainly produced by aerosol scattering processes whose dependence on wavelength is lower. It explains the whiteness of the sky in a strong aerosol event, because Rayleigh scattering is responsible for a blue sky and it is exceeded by Mie scattering when a high aerosol load appears.
From all of these results, the behaviour shown by diffuse ratio in (down) can be explained as follows: UV diffuse irradiance on 21st July is dominated by aerosol scattering, and when it is divided by the UV diffuse irradiance registered in other days, when Rayleigh processes are dominant in this spectral range, the ratio increases with wavelength due to the strong variation in the denominator due to Rayleigh and the weak spectral dependence in the numerator due to aerosols. Sabburg and Parisi (Citation2006) found a similar spectral dependency in the ratio of the global irradiance under partial cloud conditions (unobstructed sun) to cloud-free sky. The behaviour of the UV global irradiance ratios obtained by them could be explained in the same terms we use in this paper: scattering by clouds is stronger than by molecules, giving a slight diffuse irradiance dependence on wavelength, and when it is divided by cloud-free sky (stronger wavelength dependence), the ratio increases. In addition, the ratio in global irradiance measured by Meloni et al. (Citation2003) is controlled by the direct component (see sub-section 4.2), because the diffuse irradiances are similar in both compared days due to their similar low aerosol optical depth, which implies a high Rayleigh scattering contribution in both cases.
An atmosphere with high relative humidity values in the summer period may exhibit a substantial increase of diffuse radiation caused by Mie scattering produced by the presence of hydrometeors, e.g. haze. However, the relative humidity recorded in a near meteorological station (Granada Airport) of the Spanish Meteorological Agency (AEMet) decreased from 50% at 7:00 UTC to 15% at 12:00 UTC on the 21st July, which implies the non-presence of hydrometeors.
4.4. Influence of the DD absorbing properties
The spectral dependence of the global ratio (, up) could also be related to the absorbing properties of the DD aerosol. Thus, several experimental studies (e.g. Russell et al., Citation2010) have shown that this type of particle presents an enhanced absorption in the UV compared with that of the visible range. In order to check this hypothesis, we have simulated the spectral UV irradiance using the UVSPEC code for four different aerosol absorption conditions: SSA equal to 1 (no absorption), SSA equal to SSA at 440 nm (fixed), SSA spectral variation considering a linear variation between SSA at 440 and 670 nm which variation is extrapolated to the UV range (linear), and SSA varying taking into account the Absorption Ångström Exponent (AAE). This last variation is explained in Russell et al. (Citation2010) using these equations:12
13
where τ aa−λ is the aerosol absorption optical depth (AAOD) at λ, ω 0−λ is the SSA at λ, and α a is the AAE. AAE values were calculated using eq. (12) and eq. (13) and the SSA at 440 and 670 nm. shows the values of AAE, which is a useful variable to determine a DD episode. Thus, according to Khatri et al. (Citation2010), a DD event shows an Ångström Exponent lower than AAE.
The irradiances computed for the three different SSA conditions have been divided by the irradiances computed under the assumption of SSA equal to 1. This ratio can be called as Aerosol Absorption Modification Factor (AAMF). The AAMF of a global and diffuse component is represented in for 17th (left) and 21st (right) July. The effect of DD absorption reduces the diffuse and global irradiance by approximately 11% and 8% on 21st July (high aerosol load). In contrast, the absorption effect is notably smaller on 17th July (low aerosol load) with diffuse and global decreases of approximately 4% and 2%, respectively. This result for 17th July may be due to the fact that the direct component (which presents no significant direct dependence on SSA variations) is substantially larger than the diffuse component during that day, that being the absorption negligible (AAMF tends to 1). On the other hand, the spectral variation of SSA presents a slight influence on AAMF for the global and diffuse irradiance with an increase up to 2% from 320 to 400 nm on 21st July. Thus, the absorption properties of the DD particles may partially explain the spectral dependence seen in the global ratio (, up), although its influence is moderately smaller than the scattering effect discussed in sub-section 4.3. Moreover, Kalashnikova et al. (Citation2007) found an increase in the global ratio with the wavelength for smoke aerosol, where absorption dependence on wavelength is the opposite of that associated with a DD aerosol.
5. Summary and conclusions
A Saharan desert dust episode over the Iberian Peninsula in July 2009 has been identified using passive and active remote sensing instruments, forecast and back-trajectories models and synoptic analysis. The dust plume was caused by high pressures in altitude in the North Africa, which provided a desert dust intrusion over the Iberian Peninsula from North-Western Africa to South-Eastern Spain. First, the Saharan intrusion started in the highest levels of the atmosphere (4000–5000 m a.s.l.) in the noon–afternoon 20 July 2009, and in the morning of the next day in 2000–3000 m a.s.l. reached the Iberian Peninsula, leading to a strong desert load in this layer. The desert dust crossed Europe from South-Eastern Spain to North-Western Europe giving a high desert load after 21st July in Central Europe.
The effect of the high aerosol load (21st July) on spectral UV irradiance has been studied using the ratio of the irradiance measured this day to the irradiance measured other days characterized by low–moderate aerosol load. The desert dust provides an attenuation up to 50% in the direct UV irradiance, while the diffuse irradiance increases up to 40%. The weak spectral variation found on the direct ratio only increases when the wavelength is higher than a new parameter called threshold wavelength, which depends on the aerosol optical properties. Conversely, the diffuse ratio exhibits a strong variation with the wavelength due to the different spectral dependence between the aerosol and molecular scattering. Thus, the diffuse component is what is mainly responsible for the spectral variation of the global ratio in the analysed case.
The sensitivity of the aerosol absorption effect has been tested by changing its absorption properties with a radiative transfer model. The spectral variation in the SSA led to slight changes in the global UV irradiance at ground level, but these spectral changes related to the absorption are substantially smaller than those associated with the scattering.
In summary, the spectral behaviour of direct UV irradiance at ground can be explained by the defined threshold wavelength, while for the diffuse irradiance the spectral behaviour varies with the aerosol load. Thus, under high aerosol load, the aerosol scattering dominates the scattering processes in the UV range.
6. Acknowledgements
The authors gratefully acknowledge the financial support extended by the Spanish Ministry of Science and Innovation for the projects: CSD2007–00067, CGL2010-12140E, CGL2010-18782, CGL2011-25363 and CGL-2011-2992-1-C02-01. This work was also partially supported by the Andalusian Regional Government through projects P08-RNM-3568 and P10-RNM-6299, and by the European Union through ACTRIS project (EU INFRA-2010-1.1.16–262254). Roberto Román thanks Valladolid University for the support to research short stays and the PIF-UVa grant. The authors gratefully acknowledge the NOAA Air Resources Laboratory (ARL), Naval Research Laboratory and Barcelona Supercomputing Center for the HYSPLIT transport and dispersion model, the NAAPs aerosol maps and DREAM model dust data, respectively.
Related Research Data
References
- Alados-Arboledas L, Lyamani H, Olmo F. J. Aerosol size properties at Armilla, Granada (Spain). Q. J. R. Meteorol. Soc. 2003; 129: 1395–1413. 10.3402/tellusb.v65i0.19578.
- Alcántara-Ruiz A, Olmo F. J, Alados-Arboledas L. Langley calibrations of sunphotometer at Sierra Nevada, Granada, Spain. Opt. Pura Apl. 2004; 37: 3263–3269.
- Antón, M, Sorribas, M, Bennouna, Y, Vilaplana, J. M, Cachorro, V. E. and co-authors. 2012a. Effects of an extreme desert dust event on the spectral ultraviolet irradiance at El Arenosillo (Spain). Atmos. Meas. Tech. Discuss. 117: D03205.10.3402/tellusb.v65i0.19578.
- Antón M, Román R, Valenzuela A, Olmo F. J, Alados-Arboledas L. Direct-sun total ozone data from a Bentham spectroradiometer: methodology and comparison with satellite observations. J. Geophys. Res. 2012b; 5: 8131–8160. 10.3402/tellusb.v65i0.19578.
- Badarinath K. V. S, Kharol S. K, Kaskaoutis D. G, Kambezidis H. D. Case study of a dust storm over Hyderabad area, India: its impact on solar radiation using satellite data and ground measurements. Sci. Total Environ. 2007; 384(1–3): 316–332. 10.3402/tellusb.v65i0.19578.
- Balis, D. S, Amiridis, V, Zerefos, C, Kazantzidis, A, Kazadzis, S. and co-authors. 2004. Study of the effect of different type of aerosols on UV-B radiation from measurements during EARLINET. Atmos. Chem. Phys. 4: 307–321. 10.3402/tellusb.v65i0.19578.
- Bernhard G, Seckmeyer G. Uncertainty of measurements of spectral solar UV irradiance. J. Geophys. Res. 1999; 104: 14321–14346. 10.3402/tellusb.v65i0.19578.
- Bernhard G, Seckmeyer G, McKenzie R. L, Johnston P. V. Ratio spectra as a quality control tool for solar spectral UV measurements. J. Geophys. Res. 1998; 103(D22): 28855–28861. 10.3402/tellusb.v65i0.19578.
- Bilbao J, Román R, de Miguel A, Mateos D. Long-term solar erythemal UV irradiance data reconstruction in Spain using a semiempirical method. J. Geophys. Res. 2011; 116: D22211.10.3402/tellusb.v65i0.19578.
- Blumthaler M, Ambach W. Spectral measurements of global and diffuse solar ultraviolet-B radiant exposure and ozone variations. Photochem. Photobiol. 1991; 54(3): 429–432. 10.3402/tellusb.v65i0.19578.
- Bodhaine B. A, Wood N. B, Dutton E. F, Slusser J. R. On Rayleigh optical depth calculations. J. Atmos. Oceanic Technol. 1999; 16: 1854–1861.
- Cachorro, V. E, Toledano, C, Prats, N, Sorribas, M, Mogo, S. and co-authors. 2008. The strongest desert dust intrusion mixed with smoke over the Iberian Peninsula registered with sun-photometry. J. Geophys. Res. 113: D14504.10.3402/tellusb.v65i0.19578.
- Calbó J, Pagès D, González J. A. Empirical studies of cloud effects on UV radiation: a review. Rev. Geophys. 2005; 43(2): 1–28.
- Córdoba-Jabonero, C, Sorribas, M, Guerrero-Rascado, J. L, Adame, J. A, Hernández, Y. and co-authors. 2011. Synergetic monitoring of Saharan dust plumes and potential impact on surface: a case study of dust transport from Canary Islands to Iberian Peninsula. Atmos. Chem. Phys. 11: 3067–3091. 10.3402/tellusb.v65i0.19578.
- Dahlback A, Stamnes K. A new spherical model for computing the radiation field available for photolysis and heating at twilight. Planet. Space Sci. 1991; 39: 671–683. 10.3402/tellusb.v65i0.19578.
- de Miguel A, Mateos D, Bilbao J, Román R. Sensitivity analysis of ratio between ultraviolet and total shortwave solar radiation to cloudiness, ozone, aerosols and precipitable water. Atmos. Res. 2011a; 102: 136–144. 10.3402/tellusb.v65i0.19578.
- de Miguel A, Román R, Bilbao J, Mateos D. Evolution of erythemal and total shortwave solar radiation in Valladolid, Spain: effects of atmospheric factors. J. Atmos. Sol-Terr. Phy. 2011b; 73: 578–586. 10.3402/tellusb.v65i0.19578.
- di Sarra, A, Cacciani, M, Chamard, P, Cornwall, C, DeLuisi, J. J. and co-authors. 2002. Effects of desert dust and ozone on the ultraviolet irradiance at the Mediterranean island of Lampedusa during PAUR II. J. Geophys. Res. 107(D18): 8135.10.3402/tellusb.v65i0.19578.
- Diffey B. L. Solar ultraviolet radiation effects on biological systems. Phys. Med. Biol. 1991; 36: 299–328. 10.3402/tellusb.v65i0.19578.
- Draxler, R. R and Rolph, G. D. 2012. HYSPLIT (HYbrid Single-Particle Lagrangian Integrated Trajectory) Model. NOAA Air Resources Laboratory: Silver SpringMD. Online at: http://ready.arl.noaa.gov/HYSPLIT.php.
- Escudero, M, Castillo, S, Querol, X, Avila, A, Alarcón, M. and co-authors. 2005. Wet and dry African dust episodes over eastern Spain. J. Geophys. Res. 110: D18S08.10.3402/tellusb.v65i0.19578.
- Guerrero-Rascado, J. L, Olmo, F. J, Avilés-Rodríguez, I, Navas-Guzmán, F, Pérez-Ramírez, D. and co-authors. 2009. Extreme Saharan dust event over the southern Iberian Peninsula in September 2007: active and passive remote sensing from surface and satellite. Atmos. Chem. Phys. 9: 8453–8469. 10.3402/tellusb.v65i0.19578.
- Holben, B. N, Eck, T. F, Slutsker, I, Tanré, D, Buis, J. P. and co-authors. 1998. AERONET—a federated instrument network and data archive for aerosol characterization. Remote Sens. Environ. 66(1): 1–16. 10.3402/tellusb.v65i0.19578.
- Iqbal M. An Introduction to Solar Radiation. Academic Press: New York., 1983
- Kalashnikova O. V, Mills F. P, Eldering A, Anderson D. Application of satellite and ground-based data to investigate the UV radiative effects of Australian aerosols. Remote Sens. Environ. 2007; 107: 65–80. 10.3402/tellusb.v65i0.19578.
- Kaskaoutis D. G, Kambezidis H. D, Jacovides C. P, Steven M. D. Modification of solar radiation components under different atmospheric conditions in the greater Athens area, Greece. J. Atmos. Sol.-Terr. Phy. 2006; 68: 1043–1052. 10.3402/tellusb.v65i0.19578.
- Khatri P, Takamura T, Shimizu A, Sugimoto N. Spectral dependency of aerosol light-absorption over the East China sea region. SOLA. 2010; 6: 1–4. 10.3402/tellusb.v65i0.19578.
- Krotkov, N. A, Barthia, P. K, Herman, J. R, Slusser, J, Scott, G. and co-authors. 2005. Aerosol ultraviolet absorption experiment (2000 to 2004), part 2: absorption optical thickness, refractive index, and single scattering albedo. Opt. Eng. 44(4): 041005.10.3402/tellusb.v65i0.19578.
- Lyamani H, Olmo F. J, Alcántara A, Alados-Arboledas L. Atmospheric aerosols during the 2003 heat wave in southeastern Spain II: microphysical columnar properties and radiative forcing. Atmos. Environ. 2006; 39: 7276–7284.
- Lyamani H, Olmo F. J, Foyo I, Alados-Arboledas L. Black carbon aerosols over an urban area in south-eastern Spain: changes detected after the 2008 economic crisis. Atmos. Environ. 2011; 45: 6423–6432. 10.3402/tellusb.v65i0.19578.
- Mateos, D, Bilbao, J, Kudish, A. I, Parisi, A. V, Carbajal, G. and co-authors. 2013. Validation of OMI satellite erythemal daily dose retrievals using ground-based measurements from fourteen stations. Remote Sens. Environ. 1282013, 1–10. 10.3402/tellusb.v65i0.19578.
- Mateos D, di Sarra A, Meloni D, di Biagio C, Sferlazzo D. M. Experimental determination of cloud influence on the spectral UV irradiance and implications for biological effects. J. Atmos. Sol.-Terr. Phy. 2011; 73: 1739–1746. 10.3402/tellusb.v65i0.19578.
- Mayer, B and Kylling, A. 2005. Technical note: the libRadtran software package for radiative transfer calculations—description and examples of use. Atmos. Chem. Phys. 5: 1855–1877. DOI: 10.3402/tellusb.v65i0.19578.
- McKenzie R. L, Matthews W. A, Johnston P. V. The relationship between erythemal UV and ozone, derived from spectral irradiance measurements. Geophys. Res. 1991; 18(12): 2269–2272.
- McKinlay A. F, Diffey B. L. A reference action spectrum for ultraviolet induced erythema in human skin. Commission Internationale de l'Eclairage (CIE). 1987; 6: 17–22.
- Meloni D, Marenco F, di Sarra A. Ultraviolet radiation and aerosol monitoring at Lampedusa, Italy. Ann. Geophys. 2003; 46: 373–383.
- Meloni D, di Sarra A, Herman J. R, Monteleone F, Piacentino S. Comparison of ground-based and total ozone mapping spectrometer erythemal UV doses at the Island of Lampedusa in the period 1998–2003: role of tropospheric aerosols. J. Geophys. Res. 2005; 110: D01202.10.3402/tellusb.v65i0.19578.
- Olmo F. J, Quirantes A, Lara V, Lyamani H, Alados-Arboledas L. Aerosol optical properties assessed by an inversion method using the solar principal plane for non-spherical particles. J. Quant. Spectrosc. Radiat. Transfer. 2008; 109: 1504–1516. 10.3402/tellusb.v65i0.19578.
- Parisi A. V, Kimlin M. G, Wong J. C. F, Wilson M. Diffuse component of solar ultraviolet radiation in tree shade. J. Photochem. Photobiol. B: Biol. 2000; 54: 116–120. 10.3402/tellusb.v65i0.19578.
- Preißler J, Wagner F, Pereira S. N, Guerrero-Rascado J. L. Multi-instrumental observation of an exceptionally strong Saharan dust outbreak over Portugal. J. Geophys. Res. 2011; 116: D24204.10.3402/tellusb.v65i0.19578.
- Román, R, Antón, M, Cazorla, A, de Miguel, A, Olmo, F. J. and co-authors. 2012a. Calibration of an all-sky camera for obtaining sky radiance at three wavelengths. Atmos. Meas. Tech. 5: 1873–1905. 10.3402/tellusb.v65i0.19578.
- Román, R, Mateos, D, de Miguel, A, Bilbao, J, Pérez-Burgos, A. and co-authors. 2012b. Atmospheric effects on the ultraviolet erythemal and total shortwave solar radiation in Valladolid, Spain. Opt. Pura Apl. 45(1): 17–21. 10.3402/tellusb.v65i0.19578.
- Russell, P. B, Bergstrom, R. W, Shinozuka, Y, Clarke, A. D, DeCarlo, P. F. and co-authors. 2010. Absorption Ångström Exponent in AERONET and related data as an indicator of aerosol composition. Atmos. Chem. Phys. 10: 1155–1169. 10.3402/tellusb.v65i0.19578.
- Sabburg J, Parisi A. V. Spectral dependency of cloud enhanced UV irradiance. Atmos. Res. 2006; 81: 206–214. 10.3402/tellusb.v65i0.19578.
- Schwander, H, Koepke, P, Kaifel, A and Seckmeyer, G. 2002. Modification of spectral UV irradiance by clouds. J. Geophys. Res. 107(D16): 4296. DOI: 10.3402/tellusb.v65i0.19578.
- Slaper H, Reinen H, Blumthaler M, Huber M, Kuik F. Comparing ground-level spectrally resolved solar UV measurements using various instruments: a technique resolving effects of wavelength shift and slit width. Geophys. Res. Lett. 1995; 22(20): 2721–2724. 10.3402/tellusb.v65i0.19578.
- Sola, Y, Lorente, J, Campmany, E, de Cabo, X, Bech, J. and co-authors. 2008. Altitude effect in UV radiation during the evaluation of the effects of elevation and aerosols on the ultraviolet radiation 2002 (VELETA-2002) field campaign. J. Geophys. Res. 113: D23202.10.3402/tellusb.v65i0.19578.
- Sperling, A, Winter, S, Raatz, K. H and Metzdorf, J. 1996. Entwicklung von Normallampen für das UV-B_ Messprogramm, PTB-Ber. PTB-Opt-52. BraunschweigGermany.
- Toledano, C, Cachorro, V. E, de Frutos, A. M, Sorribas, M, Prats, N. and co-authors. 2007. Inventory of African desert dust events over the southwestern Iberian Peninsula in 2000–2005 with an AERONET cimel sun photometer. J. Geophys. Res. 112: D21201.10.3402/tellusb.v65i0.19578.
- Utrillas, M. P, Marín, M. J, Esteve, A. R, Tena, F, Cañada, J. and co-authors. 2007. Diffuse UV erythemal radiation experimental values. J. Geophys. Res. 112: D24207.10.3402/tellusb.v65i0.19578.
- Valenzuela, A, Olmo, F. J, Lyamani, H, Antón, M, Quirantes, A. and co-authors. 2012a. Analysis of the desert dust radiative properties over Granada using principal plane sky radiances and spheroids retrieval procedure. Atmos. Res. 104–105: 292–301. 10.3402/tellusb.v65i0.19578.
- Valenzuela, A, Olmo, F. J, Lyamani, H, Antón, M, Quirantes, A. and co-authors. 2012b. Classification of aerosol radiative properties during African desert dust intrusions over southeastern Spain by sector origins and cluster analysis. J. Geophys. Res. 117: D06214.10.3402/tellusb.v65i0.19578.
- Valenzuela, A, Olmo, F. J, Lyamani, H, Antón, M, Quirantes, A. and co-authors. 2012c. Aerosol radiative forcing during African desert dust events (2005–2010) over Southeastern Spain. Atmos. Chem. Phys. 12: 10331–10351. 10.3402/tellusb.v65i0.19578.