Abstract
Estuaries are known to contribute a significant amount of nitrous oxide (N2O) to the atmosphere; however, the contribution from the Indian estuaries is unknown. We made an attempt to estimate emissions of N2O from the Indian estuaries by collecting samples from 28 major and minor estuaries along the Indian coast during the wet and dry periods. The N2O was mostly saturated in all measured Indian estuaries during the study period (72–631%), with exceptionally high saturation in the Ponniyaar estuary (5902%) during the wet period. The N2O saturation displayed a strong relation with dissolved inorganic nitrogen (DIN; nitrate +nitrite and ammonium), ammonium and dissolved oxygen saturation, suggesting that nitrification is the major source of N2O in the Indian estuaries. The negative relation between salinity and N2O saturation suggests inner estuaries are a strong source compared to outer estuaries. The annual mean N2O saturation (204±137%) and fluxes (1.3 µmol N2O m−2 d−1) in the Indian estuaries were significantly less than European estuaries (271% and ~2.7 µmol N2O m−2 d−1, respectively). The estimation of flux of N2O from the European estuaries was also biased due to the inclusion of an exceptionally high supersaturation value from a small UK estuary, Colne (2645%). However, low N2O saturation and fluxes in the Indian estuaries were related to mean low concentration of DIN that led to low nitrification rates compared to world estuaries. Despite India ranking second in artificial fertilizers use, high flushing rates during the wet period reduce residence time leading to less modification within the estuary.
To access the supplementary material to this article, please see Supplementary files under Article Tools online.
1. Introduction
Nitrous oxide (N2O) is an important greenhouse gas, which is 298 times greater with regard to global warming potential (Forster et al., Citation2007) than carbon dioxide (CO2), and has a lifetime of 114 year in the atmosphere (IPCC, Citation2007). Since pre-industrial time atmospheric N2O has increased ~18% in the atmosphere (IPCC, Citation2007). Oceans are the second major natural source of N2O to the atmosphere after soils (Bange et al., Citation1996; Seitzinger et al., Citation2000). The N2O is produced as a by-product in the first step of nitrification and as an obligate intermediate during denitrification. Both nitrification and denitrification occur in water columns, sediments or interior sediment particles (Nevison et al., Citation2003; Codispoti et al., Citation2005; Bange, Citation2008), depending highly on dissolved oxygen concentration (Goreau et al., Citation1980; De Bie et al., Citation2002). To the global emission of atmospheric N2O, aquatic sources contribute ~30% of which 60% come from estuaries and coastal regions (Bange et al., Citation1996; Seitzinger et al., Citation2000). Bange (Citation2006) estimated N2O emission to the atmosphere from European estuaries based on data collected in nine estuaries as 0.33–0.67×10¹² g N annually, which represents up to 26% of global N2O emission. They further concluded that coastal N2O is mainly formed in the estuarine system. Recently Barnes and Upstill-Goddard (Citation2011) revised these estimates to 6.8±13.2×10⁹ g N2O y−1 and noticed that higher estimates by Bange (Citation2006) come from use of a larger area for estuaries. Conversely, Bange et al. (Citation1996) estimated N2O emissions from the world estuaries to be 3.68–5.71×10¹² g N2O y−1, and these estimates may have to be revised due to recent modifications in the area of European estuaries. Overall, the estimates from the estuaries suffer from large uncertainties due to large variability and lack of consistent data. It is especially true for Southeast Asian estuaries where the biogeochemical cycling of material is different due to high atmospheric temperature, seasonality of monsoons, and discharge pattern, high fertilizer use, etc. These regions were also highly under-sampled with reference to time and space.
India houses ~220 major and minor estuaries, which are influenced by monsoonal rainfall, and therefore called as monsoonal estuaries. These estuaries have characteristic runoff periods, mostly from June to September when the Indian subcontinent receives rainfall, when they exhibit non-steady state behaviour (Vijith et al., Citation2009). Seasonal runoff into these monsoonal estuaries far exceeds their total volume and when discharges are at peak level, the entire estuary turns into a river (Sarma et al., Citation2009, Citation2010, Citation2011). Discharges of variable magnitudes occur for a period of 4–6 months, and other periods, the upstream river almost dries up giving place to dominance of seawater in the estuary. Hence, the biogeochemical processes in monsoonal estuaries during discharge period could be completely different from that of a dry period. Recently, Sarma et al. (Citation2012) estimated emissions of CO2 from the Indian estuaries as ~2×10¹² gC to the atmosphere annually, which is about 10 times less compared to European estuaries. Such low CO2 fluxes from the Indian estuaries result from high flushing rates and less dense human settlements along the banks of estuaries. In India, N2O emissions were estimated for the Adayar estuary, in the south east of India, and found to emit ~23.2 µmol N2O m−2 d−1 to the atmosphere (Rajkumar et al., Citation2008). With the exception of this report, no information is available from other Indian estuaries. Indian Mangroves, which are part of the estuarine system, are found to be a strong source of trace gases to the atmosphere (Chauhan et al., Citation2008; Krithika et al., Citation2008; Fernandes et al., Citation2012). The annual emission of N2O from the mangroves located along the east coast of India was estimated to be 5.8×10³ gN2O. The objective of this study is to estimate the contribution of N2O emissions from the Indian monsoonal estuaries to the atmosphere.
2. Sampling and measurements
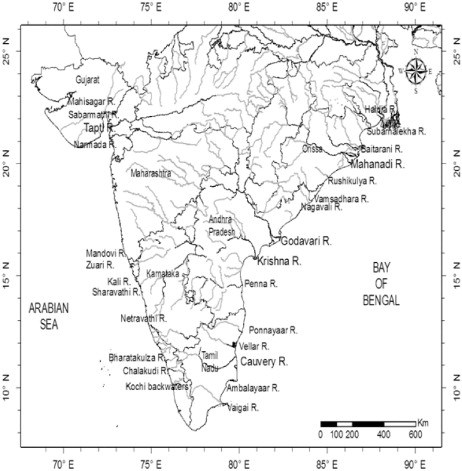
In order to examine the variations in N2O concentrations and related atmospheric fluxes from the Indian estuaries, sampling was conducted in 28 major estuaries along the Indian coast during peak discharge (wet) period (28 July–18th August 2011), and dry period (2–15 January 2012) (). From each estuary, samples were collected at 5–10 locations from river mouth to upper reaches of the estuary. Temperature and salinity were measured using a CTD system (Sea Bird Electronics, SBE 19 plus, USA). Nutrients were measured using a spectrophotometric method following Grashoff et al. (Citation1992). Dissolved oxygen (DO) was measured using Winkler's titration method of Carritt and Carpenter (Citation1966) with a potentiometric end-point detection technique. The analytical precision, expressed as standard deviation, was 0.07% for DO and ±0.2 µM for ammonium, nitrite and nitrate. Dissolved N2O in the water was determined by a multiphase head space equilibration technique (McAuliffe, Citation1971) coupled with Gas Chromatographic analysis. Briefly, predetermined volume (25 ml) of sample was equilibrated with an equal volume of helium in a gas tight syringe by vigorously shaking the syringe at room temperature for 5 minutes using a wrist action shaker. After equilibrium, the head space was dried over drierite and then injected through a 5-ml sampling loop into a gas chromatograph (Agilent- 6820, USA) and separated over a chromosorb column (80/100 mesh) at 35°C, and N2O peak was detected with a 63Ni Electron Capture Detector (ECD). Wind speed data were obtained from the Indian Meteorological Department (IMD) from the stations close to the respective estuaries. The air-to-sea fluxes of N2O were estimated using the following equation:
where F (gas) is flux of N2O (µmol m−2 d−1), K is the gas transfer or piston velocity (m d−1; Wanninkhof, Citation1992), Sgas is the solubility coefficient of N2O (mol m−3 atm−1) (Weiss and Price, Citation1980) and Δgas is the difference between N2O in water and air (nM).
Fig. 1 Station locations map where major rivers are shown with larger font letters. The main course of the river is shown as a dark line while tributaries are shown in grey.
Hourly measured wind speed was averaged to obtain seasonal mean and was used for piston velocity calculations. The piston velocity at the Schmidt number of 660 (Sc 660) was computed following Wanninkhof (Citation1992):where Sc is the Schmidt number for N2O, which was calculated from temperature (t) according to the polynomial fit given and u10 is the measured wind speed at the height of 10 m.
Several investigators found that flux estimates based on the Wanninkhof (Citation1992) coefficients may provide under-estimates due to the tidal enhancement of turbulence (Zappa et al., Citation2003; Borges et al., Citation2004); hence caution is warranted. Nitrification rates were measured using the Schell (Citation1978) method. Briefly, 250 ml of surface sample was incubated in dark for 24 hours by adding 2 µmol of N15 labelled ammonium chloride solution (99 atom% excess). After incubation, the nitrate in the water was extracted with aniline and β-napthol, and the resultant Azo-dye was filtered on pre-combusted Whatman GF/F filter. The filter was then dried, packed in the tin cups and combusted in elemental analyser (Flash EA 1112 Series, Thermo Electron, Germany) for content, and the atomic ratio of N14/N15 was measured using isotopic ratio mass spectrometer (IRMS; Delta V Plus, Thermo Electron, Germany).
Nitrification rates were measured following uptake rates of substrate (nitrate) enriched with 15N (Dugdale and Goering, Citation1967). Specific nitrate uptake rates (µmolN l−1 d−1) were calculated as:where 15Np is the concentration of 15N (atom%) in the particulate phase after incubation, 15No is the concentration of 15N (atom%) in the particulate phase at time zero (i.e. natural concentration in the particulate phase), 15Nd is the concentration of 15N in the dissolved phase at time zero (i.e. following the 15N enrichment) and T is the incubation time (h). N
1 is the concentration of particulate nitrogen (µmolN l−1).
River discharge data was obtained from dam authorities of respective rivers (Sarma et al., Citation2012).
3. Results and discussions
The Indian estuaries display a range of hydrological conditions driven by variable freshwater flows and flushing rates during the wet period and variable tidal amplitudes during the dry period. The mean river discharge from the Indian estuaries varied from ~28 to 3505 m3 s−1 (). The magnitude of discharge determines the amount of organic matter and nutrients entering the estuary and also the stability of water column that governs the interaction with the microbial processes (Sarma et al., Citation2011, Citation2012).
Table 1. Annual mean discharge, salinity, oxygen saturation, ammonium, N2O concentration, saturation, flux and nitrification rates. In the Indian estuaries. Nitrification rates were given only for the dry period
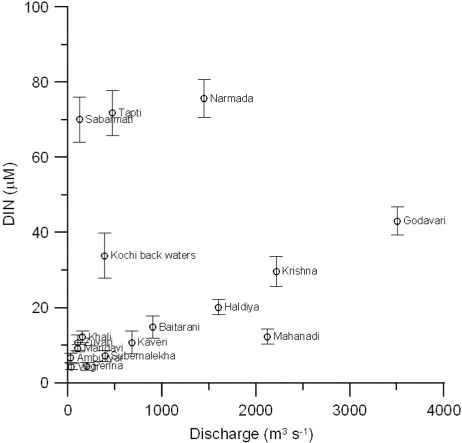
The water discharged by the monsoonal estuaries is significantly modified during storage in dam reservoirs. Several dams had been constructed across most rivers sampled in this study. The water is stored in the dam reservoirs for over 6 months during the dry period for irrigation and domestic usage. This storage leads to the formation of stagnant conditions that favour microbial degradation of organic matter and the release of nutrients. Formation of N2O is possible due to nitrification in the dam reservoir, and discharge of reservoir water into the estuary during the wet period may enhance its concentrations in the estuary. In addition to this, rivers also carry excess fertilizers used in the agricultural farms to the estuary during the wet period. India is ranked second globally in terms of consumption of nitrogen and phosphate as fertilizer (The Fertilizer Association of India, New Delhi) and consumes about 0.025 Tg per year (1 Tg=1012 g). On the other hand, seawater dominates during the dry period due to the closing of dam gates and increased seawater intrusion through tides, resulting in a significant decrease in nutrient levels (Sarma et al., Citation2010). The relationship between river discharge and DIN indicates that higher DIN concentrations were found in the rivers opened to the east coast compared to the west coast except Narmada, Tapti, Sabarmati and Cochin back waters, which are highly polluted due to local industrial activities (). This relationship is consistent with the fertilizer usage in India, which is higher (~65%) in the regions located along the east coast compared to the west coast (35%) and central India (Ministry of Agriculture, Government of India; http://eands.dacnet.nic.in/latest_2006.html).
Fig. 2 Relationship between river discharge and dissolved inorganic nitrogen (DIN) during the wet period in the Indian estuaries.
3.1. Spatial and temporal variations in N2O concentrations in the Indian estuaries
The N2O showed wide variations in the Indian estuaries (). The concentrations of N2O (mean±standard deviation) varied between ~3.5 and 14.6 (6.7±3.5) nM in the estuaries located along the east coast of India while between 6.8 and 47.6 (18.8±11.9) nM in the west coast of India during the wet period. During the dry period, the N2O concentrations ranged between 4.9 and 22.1 (11.4±5) nM in the estuaries located along the east coast of India, except at the Ponnayar estuary where exceptionally high N2O of 414 nM was recorded, and between 9.3 and 47.1 (21.0±13) nM in the west coast of India. The mean concentrations of N2O were slightly higher during the dry period (15.5±10 nM) than the wet period (12.0±10 nM) in the Indian estuaries. Super-saturation of N2O was noticed in the Indian estuaries with relatively lower values associated with estuaries located on the east coast (108±53%) than on the west coast of India (290±158%) during the wet period. On the other hand, comparatively higher saturation was observed in the estuaries located along the east coast of India (161±76%) during dry than the wet period and no significant seasonal variations being noticed in estuaries located along the west coast of India (292±150%).
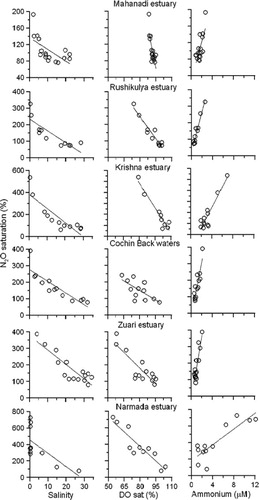
The N2O saturation showed weak inverse correlation with salinity (r 2=0.36; p<0.05) with large scatter, especially at the lower salinity region in the Indian estuaries (a). In order to examine the scatter in the relationship, we have plotted these relationships for selected estuaries from both the east and west coasts of India in . The strong correlation was observed when salinity and N2O data were plotted for individual estuaries. The slope of the relation was changed among estuaries and ranged between 2.8 and 16.1, whereas it ranged from 3.8 to 15.1 and 47.2 to 188.3 with DO saturation and ammonium, respectively, suggesting that the scatter in the relationship was the result of variations in the slopes. The variable slopes of the relationship suggest that the concentration of N2O in the freshwater received by the Indian estuaries is different. Though the relation between salinity and N2O was shown only for a few estuaries in , a similar relationship was found for other estuaries also. Nevertheless, the salinity to N2O relationship suggests that the estuaries which receive high freshwater inputs from upstream act as a stronger source of N2O than others (a and ). An increase in N2O saturation with a decrease in salinity was reported in several estuaries (Berounsky and Nixson, Citation1993; Bange, Citation2006; Silvennoinen et al., Citation2008; Zhang et al., Citation2010). Similarly, N2O saturation showed an inverse relation with dissolved oxygen saturation (r 2=0.30; p<0.05; b), whereas it showed a positive relation with ammonium (r 2=0.42; p<0.001; c) and with DIN (r 2=0.47; p<0.001; d), suggesting that nitrification is the possible mechanism for the production of N2O in the Indian estuaries. Berounsky and Nixson (Citation1993) observed an increase in nitrification rates with an increase in DIN in Narragansetti Bay, USA. Bange et al. (Citation1996) and Barnes and Upstill-Goddard (Citation2011) suggested that N2O in the European estuaries was contributed to by nitrification. Relatively higher N2O saturation in the west coast estuaries was associated with higher DIN concentrations (36±26 µM) than east coast estuaries (15.8±22 µM; ). In addition to this, dissolved oxygen saturation was also lower in the west coast estuaries (83±8%) than east coast estuaries (94±6%) (). The east–west gradients in the nutrients load could possibly be due to either over-consumption of fertilizers or intense remineralization of organic matter in the estuary. The state-wise fertilizer consumption in India suggests that ~65% of the fertilizers are consumed in states located along the east coast of Indian and ~28% in states located along the west coast and the remaining (~7%) in the central India (Indian Agricultural department, http://indiastat.com/agriculture/2/stats.aspx). On the other hand, lower mean values of pH were found in the west coast estuaries (6.82±0.52) than the east coast estuaries (7.65±0.57), suggesting that further higher nutrients in the former are caused by higher rates of organic matter decomposition and it is consistent with DO saturation. Recently Sarma et al. (Citation2012) found higher pCO2 levels in the Indian estuaries, which were attributed to organic matter decomposition. Nevertheless, the annual mean N2O saturation in the Indian estuaries (204±137%) was significantly less than the European (465%; Bange, Citation2006 and 271% Barnes and Upstill-Goddard, Citation2011) and the American estuaries (165–618%; Table S1; supplementary information).
Fig. 3 Relationship of N2O saturation with (a) salinity, (b) dissolved oxygen saturation (DOsat;%), (c) ammonium concentration (µM) and (d) dissolved inorganic nitrogen (DIN; µM). The points circled in (b) and (d) were excluded in constructing the regression equation, which comes from the polluted estuaries, Narmada and Mahisagar.
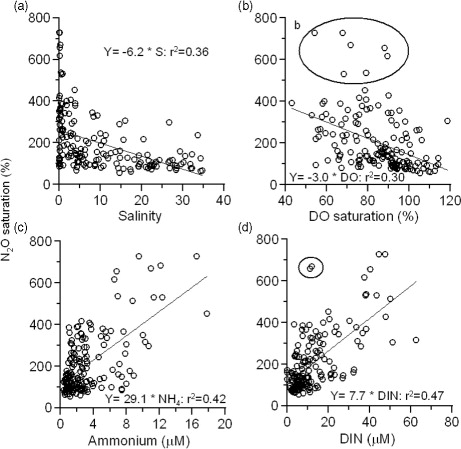
Fig. 4 Relationship of N2O saturation with salinity, dissolved oxygen saturation and ammonium in selected estuaries.
3.2. N2O emissions from Indian estuaries
The hourly mean wind speed (u10) ranged between 0.31 and 2.66 m s−1 during the study period. The seasonal mean wind speed data, prepared from the hourly mean data, were used to compute fluxes. The N2O efflux from the Indian estuaries ranged between −1.1 and 12.1 µmol m−2 d−1 during the wet period and between −0.01 and 14.1 µmol m−2 d−1 during the dry period (). Higher fluxes were noticed in the Baitharini, Godavari, Ponnayar, Cochin Black waters, Tapti, Nethravathi, Khali and Mondovi estuaries (0.2–14.2 µmol N2O m−2 d−1), while lower fluxes were found in other estuaries (−1.12–5.36 µmol N2O m−2 d−1; ). Such high fluxes in the former estuaries were driven not only by high N2O levels but also by winds. The mean flux from the Indian estuaries amounts to 1.07 and 1.65 µmol m−2 d−1 during the wet and dry periods, respectively, with an annual mean of 1.34 µmol m−2 d−1.
The annual mean emissions from the Indian estuaries were significantly less than the European estuaries (~2.7 µmol m−2 d−1), and they contribute to 0.6% to the world estuaries. Such significant difference might have been caused by variations in DIN loading and nitrification rates. The DIN concentrations in the European and American estuaries were in the range of 5–500 µM (Table S2, supplementary information) with nitrification rates of 0.2–336 µmol N l−1 d−1. Higher ammonium concentrations were found in the Shelde estuary, and higher nitrification rates in the Girode estuary (Table S3, supplementary information). On the other hand, ammonium concentrations in the Indian estuaries were 0.6–16.6 µM during the wet period, whereas they were 0.6–13.5 µM during the dry period and these concentrations are significantly less than the world estuaries (Table 1, S3). Sarma et al. (Citation2009, Citation2010) showed that monsoonal estuaries received significant amount of nutrients during the peak discharge period. However, nutrients are not utilized in the estuary due to high flushing rates and high suspended load (Sarma et al., Citation2009; Acharyya et al., Citation2012). As a result, nutrients are flushed to the coastal regions where they support primary production. Hence, low nitrification rates were found during the dry period in the Indian estuaries (0.007 and 0.87 µmol N l−1 d−1) compared to world estuaries (0.2–336 µmol N l−1 d−1; Table S3).
India houses a total of 14 major, 44 medium and 162 minor estuaries, and the total surface area of Indian estuaries comes to 27 000 km2 calculated from the mouth of the estuary to the region where tidal oscillations are almost negligible (Qasim, Citation2003). The weight averaged net annual emission of N2O from the Indian estuaries amounts to 0.71×10⁻³ and 0.46×10⁻³ Tg N2O during dry and wet periods, respectively (each of 6 months), and the annual emission amounts to 0.0006 Tg N2O y−1 covering an area of 0.027×10⁶ km2, which is about half of the revised emission estimate from European estuaries (0.012 Tg N2O y−1; Barnes and Upstil-Goddard, Citation2011) covering an almost similar area (0.03×10⁶ km2). The fluxes from the Indian estuaries were much smaller (0.01%) compared to world estuaries (4.7 Tg N2O y−1). Mangroves are a strong source of trace gases to the atmosphere (Chauhan et al., Citation2008; Krithika et al., Citation2008; Fernandes et al., Citation2012). Mangroves are located close to several Indian estuaries. Chauhan et al. (Citation2008) estimated N2O fluxes from the mangrove located along the east coast of India to be 5.8×10³ gN2O y−1. Assuming a similar emission from the west coast, the N2O emission from the mangrove amounts to an insignificant fraction compared to the fluxes from Indian estuaries.
3.3. Sources of errors on water–air fluxes of N2O estimations
The errors arise from various sources such as scaling errors arise from the consideration of studied 28 estuaries representing Indian estuaries as a whole, uncertainties from transfer velocity, bias in mean dissolved N2O values due to low spatial and temporal data resolution. Estimating fluxes to the area representing all estuaries in India may be prone to significant error. We have calculated the flux budget for individual estuaries, where samples were collected, and the mean saturation was used to apply to other Indian estuaries where data were not available. Since other Indian estuaries were mainly minor estuaries and unpolluted, being situated away from the human settlements, their mean N2O was computed from the data measured in non-polluted estuaries, given in . However, the calculated areas of Indian estuaries can have an error of up to 15% (Qasim, Citation2003). The transfer velocity versus wind speed relations carry low errors at the lower wind speeds (up to 20%), which are normally encountered in our study region (<2 m s−1). Based on our 28 Indian estuaries study, the uncertainty in Indian estuarine N2O saturations can be 25% (1σ of the estuarine mean) including the uncertainty in N2O analysis. Using these individual errors, the maximum uncertainty in our N2O emission estimate for Indian estuaries was up to ±62%.
4. Summary and conclusions
The present study reveals that Indian estuaries are a source for atmospheric N2O. A wide range of N2O saturation levels were observed in the Indian estuaries varying from 70 to 631% and from 75 to 567% during the wet and dry periods, respectively. Exceptionally high saturation (5902%) was observed only in the Ponnayar estuary during the wet period. The annual mean N2O saturation in the Indian estuaries (204±137%) was significantly less than European (271–465%) and American estuaries (165–618%). The mean flux of N2O from the Indian estuaries amounts to 1.07 and 1.65 µmol N2O m−2 d−1 during the wet and dry periods, respectively, with annual mean of 1.34 µmol N2O m−2 d−1, which is significantly less than European estuaries (~2.7 µmol N2O m−2 d−1). Such low saturation and fluxes of N2O in the Indian estuaries were related to mean low concentrations of DIN and nitrification rates compared to world estuaries. Despite the high amount of artificial fertilizers, in terms of nitrogen and phosphorus, used in India which are expected to end up in the estuaries, however, they are little modified within the estuary, due to high flushing rates during the wet period. Sarma et al. (Citation2012) calculated the mean flushing time for the Indian estuaries to be <10 d, whereas it is >40 d for the estuaries from Europe and USA. Hence, microbes are not able to oxidize ammonium efficiently resulting in low nitrification rates in the Indian estuaries. In addition to this, Indian estuaries due to less human settlements along the banks of Indian estuaries receive less domestic and industrial pollution. As a result, Indian estuaries contribute less N2O to the atmosphere than elsewhere in the world.
Table: S1 Nitrous oxide saturation and fluxes in various estuaries in the world
Download PDF (139.8 KB)5. Acknowledgements
We would like to thank Director, National Institute of Oceanography and Scientist-in-charge, Regional Centre for constant encouragement and support. We appreciate the Council of Scientific and Industrial Research (CSIR) for financial support through Supra Institutional Project (SIP 1308). We appreciate Drs. R. Rengarajan and P. Parameswaran for their help during sampling along the west coast of India. We would also like to thank two anonymous reviewers for their constructive comments and suggestions to improve the clarity of the manuscript. This is NIO contribution number: 5333.
Notes
To access the supplementary material to this article, please see Supplementary files under Article Tools online.
Related Research Data
References
- Acharyya T , Sarma V. V. S. S , Sridevi B , Venkataramana V , Bharati M. D , co-authors . Reduced river discharge intensifies phytoplankton bloom in Godavari estuary, India. Mar. Chem. 2012; 132–133: 15–22.
- Bange H. W . Nitrous oxide and methane in European Coastal waters. Estuar. Coast. Shelf. Sci. 2006; 70: 367–374.
- Bange H. W , Capone D. G , Bronk D. A , Mulholland M. R , Carpenter E. J . Gaseous nitrogen compounds (NO, N2O, N2, NH3) in the ocean. Nitrogen in the Marine Environment. 2008; Amsterdam: Elsevier. 51–94. 2nd ed..
- Bange H. W , Rapsomaniks S , Andreae M. O . Nitrous oxide in Coastal waters. Global. Biogeochem. Cycles. 1996; 10: 197–207.
- Barnes J , Upstill Goddard R. C . N2O seasonal distributions and air sea exchange in UK estuaries: implications for the tropospheric N2O source from European coastal waters. J. Geophys. Res. 2011; 116: G01006.
- Berounsky V. M , Nixson S. W . Rates of nitrification along an estuarine gradient in Narragansett Bay. Estuaries. 1993; 16: 718–730.
- Borges A. V , Delille B , Schiettecatte L. S , Gazeau F , Abril G , co-authors . Gas transfer velocities of CO2 in three European estuaries (Randers Fjord, Scheldt, and Thames). Limnol. Oceanogr. 2004; 49(5): 1630–1641.
- Carritt D. E , Carpenter J. H . Comparison and evaluation of currently employed modifications of Winkler method for determining dissolved oxygen in seawater – a Nasco report. J. Mar. Res. 1966; 24: 286–292.
- Chauhan R , Ramanathan A. L , Adhya T. K . Assessment of methane and nitrous oxide flux from mangrove along Eastern coast of India. Geofluids. 2008; 8: 321–332.
- Codispoti L , Yoshinari T , Devol A , del Giorgio P.A , LeB Williams P.J . Suboxic respiration in the oceanic water column. Respiration in Aquatic Ecosystems. 2005; Oxford: Oxford University Press. 225–247.
- De Bie M. J. M , Strink M , Boschker H. T. S , Peene J. J , Laanbroek H. J . Nitrification in the Schelde estuary: methodological aspects and factors influencing its activity. FEMS. Microbiol. Ecol. 2002; 42(1): 99–107.
- Dugdale R. C , Goering J. J . Uptake of new and regenerated forms of nitrogen in primary productivity. Limnol. Oceanogr. 1967; 12: 196–206.
- Fernandes S. O , Michotey V. D , Guasco S , Bonin P. C , Loka Bharathi P. A . Denitrification prevails over anammox in tropical mangrove sediments (Goa, India). Mar. Environ. Res. 2012; 74: 9–19.
- Forster P , Ramaswamy V , Artaxo P , Berntsen T , Betts R , co-authors . Solomon S , etal. Changes in atmospheric constituents and in radiative forcing. Climate Change 2007: The Physical Science Basis. Contribution of Working Group I to the Fourth Assessment Report of the Intergovernmental Panel on Climate Change. 2007; Cambridge, UK: Cambridge University Press. 129–234.
- Goreau T. J , Kaplan W. A , Wofsy S. C , McElroy M. B , Valois F. W , co-authors . Production of NO2 and N2O by nitrifying bacteria at reduced concentrations of oxygen. Appl. Environ. Microbiol. 1980; 40(3): 526–532.
- Grashoff K , Ehrhardt M , Kremling K . Methods of Seawater Analysis.
- IPCC. Solomon S , Qin D , Manning M , etal. Contribution of working group I to the fourth assessment report of the intergovernmental panel on climate change. Climate Change. 2007. The Physical Science Basis. 2007; Cambridge, UK: Cambridge University Press. 996.
- Krithika K , Purvaja R , Ramesh R . Fluxes of methane and nitrous oxide from an Indian mangrove. Curr. Sci. 2008; 94: 218–224.
- McAuliffe C . GC determination of solutes by multiple phase equilibrations. Chem. Technol. 1971; 1: 46–50.
- Nevison C. D , Butler J. H , Elkins J. W . Global distribution of N2O and delta N2O-AOU yield in the subsurface ocean. Global. Biogeochem. Cycles. 2003; 17(4): 1119.
- Qasim S. Z , Qasim S. Z . Cochin black waters and Vembanad. Indian Estuaries. 2003; Mumbai: Allied. 305–382. ISBN: 81-7764.369-X.
- Rajkumar N. A , Barnes J , Ramesh R , Purvaja R , Upstill-Goddard R. C . Methane and nitrous oxide fluxes in the polluted Adyar River and estuary, SE India. Mar. Pollut. Bull. 2008; 56: 2043–2051.
- Sarma V. V. S. S , Gupta S. N. M , Babu P. V. R , Acharyya T , Harikrishnachari N . Influence of river discharge on plankton metabolic rates in the tropical monsoon driven Godavari estuary, India. Estuar. Coast. Shelf. Sci. 2009; 85: 515–524.
- Sarma V. V. S. S , Kumar N. A , Prasad V. R , Venkataramana V , Naidu S. A , co-authors . High CO2 emissions from the tropical Godavari estuary (India) associated with monsoon river discharges. Geophys. Res. Lett. 2011; 38
- Sarma V. V. S. S , Prasad V. R , Kumar B. S. K , Rajeev K , Devi B. M. M , co-authors . Intra-annual variability in nutrients in the Godavari estuary, India. Cont. Shelf. Res. 2010; 30: 2005–2014.
- Sarma V. V. S. S , Viswanadham R , Rao G. D , Kumar B. S. K , Prasad V. R , co-authors . Carbon dioxide emissions from Indian monsoonal estuaries. Geophys. Res. Lett. 2012; 39
- Schell D. M , Schlessinger D . Chemical and isotopic methods in nitrification studies. Microbiology 1978. 1978; Washington, DC: American Society of Microbiology. 292–295.
- Seitzinger S. P , Kroeze C , Styles R. V . Global distribution of N 2 O emissions from aquatic systems: natural emissions and anthropogenic effects. Chemosphere. Global. Change. Sci. 2000; 2: 267–279.
- Silvennoinen H , Liikanen A , Torssonen J , Stange C. F , Martikainen P. J . Denitrification and nitrous oxide effluxes in boreal, eutrophic river sediments under increasing nitrate load: a laboratory microcosm study. Biogeochemistry. 2008; 91: 105–116.
- Vijith V , Sundar D , Shetye S. R . Time-dependence of salinity in monsoonal estuaries. Estuar. Coast. Shelf. Sci. 2009; 85: 601–608.
- Wanninkhof R . Relationship between wind speed and gas exchange over the ocean. J. Geophys. Res. 1992; 97: 7373–7382.
- Weiss R. F , Price B. A . Nitrous oxide solubility in water and seawater. Mar. Chem. 1980; 8: 347–359.
- Zappa C. J , Raymond P. A , Terray E. A , McGillis W. R . Variation in surface turbulence and the gas transfer velocity over a tidal cycle in a macro tidal estuary. Estuaries. 2003; 26: 1401–1415.
- Zhang G. L , Zhang J , Liu S. M , Ren J. L , Zhao Y. C . Nitrous oxide in the changing estuary and its adjacent marine area: riverine input, sediment release and atmospheric fluxes. Biogeosciences. 2010; 7: 3505–3167.