Abstract
Direct radiative forcing by mineral dust is important as it significantly affects the climate system by scattering and absorbing short-wave and long-wave radiation. The multi-angle imaging spectro radiometer (MISR) and cloud–aerosol lidar with orthogonal polarisation (CALIOP) aerosol data are used to observe mineral dust distribution over Australia. In addition, the weather research and forecasting with chemistry (WRF/Chem) model is used to estimate direct radiative forcing by dust. At the surface, the model domain clear-sky short-wave and long-wave direct radiative forcing by dust averaged for a 6-month period (austral spring and summer) was estimated to be −0.67 W m−2 and 0.13 W m−2, respectively. The long-wave warming effect of dust therefore offsets 19.4% of its short-wave cooling effect. However, over Lake Eyre Basin where coarse particles are more abundant, the long-wave warming effect of dust offsets 60.9% of the short-wave cooling effect. At the top of the atmosphere (TOA), clear-sky short-wave and long-wave direct radiative forcing was estimated to be −0.26 W m−2 and −0.01 W m−2, respectively. This leads to a net negative direct radiative forcing of dust at the TOA, indicating cooling of the atmosphere by an increase in outgoing radiation. Short-wave and long-wave direct radiative forcing by dust is shown to have a diurnal variation due to changes in solar zenith angle and in the intensity of infrared radiation. Atmospheric heating due to absorption of short-wave radiation was simulated, while the interaction of dust with long-wave radiation was associated with atmospheric cooling. The net effect was cooling of the atmosphere near the surface (below 0.2 km), with warming of the atmosphere at higher altitudes.
1. Introduction
Mineral dust aerosols contribute more than half of the total global aerosol burden (Textor et al., Citation2006) and have a significant influence on the climate system directly through scattering and absorption of solar and infrared radiation (McCormick and Ludwig, Citation1967; Miller and Tegen, Citation1998), semi-directly through changes in atmospheric temperature structure and the evaporation rate of cloud droplets (i.e. the cloud burning effect; Hansen et al., Citation1997; Ackerman et al., Citation2000; Koren et al., Citation2004), and indirectly in a complex way through impact on optical properties of clouds (i.e. enhancing cloud reflectance by increasing total droplet cross-sectional area; Gunn and Phillips, Citation1957; Liou and Ou, Citation1989) and suppression (Ferek et al., Citation2000; Rosenfeld, Citation2000) or enhancement (Andreae et al., Citation2004) of precipitation formation. The direct radiative effect of dust has been investigated extensively using general circulation models (e.g. Tegen et al., Citation1996) and more recently by applying regional and global models, which incorporate a more physically based dust emission scheme (e.g. Darmenova et al., Citation2009; Zhao et al., Citation2010; Huneeus et al., Citation2011). These studies highlight the cooling effect of dust aerosols near the surface due to backscattering and absorption of short-wave radiation, and heating of the atmosphere above due to absorption of both short-wave and long-wave radiation (Alizadeh Choobari et al., Citation2012b, Citation2013).
Australia is the major source of mineral dust in the Southern Hemisphere (Prospero et al., Citation2002), with an estimated annual emission of 100 Tg (Mitchell et al., Citation2010). It is believed that there will be drier conditions over most of Australia in response to future climate change (McCarthy et al., Citation2001), leading to an increase in its natural dust emission (Tegen et al., Citation2004). As such, there is a critical need to understand optical properties of dust aerosols in this region. Yet, climate impacts of Australian dust remain largely unknown, partly because until recently aerosol processes have been treated independent from meteorology (Grell et al., Citation2005). Also because unlike the major Northern Hemisphere sources of dust, such as the Sahara, Australian dust appears not to be important in modifying climate on a global scale, as it is believed that it only accounts for about 5% of the global total dust emission (Mitchell et al., Citation2010). However, mineral dust from Australia is an important component of the atmosphere that affects regional climate through radiative impacts. A number of factors have improved our ability to better monitor dust aerosol distribution and understand its radiative properties over Australia. These include the rapid development of online and coupled aerosol–atmosphere models (Grell et al., Citation2005), as well as the advent of satellites with the ability to measure mineral dust aerosols over bright land surfaces (Kahn et al., Citation2005) and to identify their vertical distribution (Leon et al., Citation2003). Recent field campaigns for identifying mineral composition of Australian dust (e.g. Qin and Mitchell, Citation2009; Radhi et al., Citation2010) have also contributed.
Lake Eyre Basin of central eastern Australia is the most important source of mineral dust in the Southern Hemisphere, with an average of 82 dusty days per year (Bullard and McTainsh, Citation2003). Dust storms in the basin occur throughout the year, but they are more frequent during spring (SON) and summer (DJF) (Ekstrom et al., Citation2004). Dust emission within the basin is often associated with the passage of dry cold fronts (Ekstrom et al., Citation2004; Alizadeh Choobari et al., Citation2012a) in spring and summer. Note that, although the passage of cold frontal systems across central Australia is more frequent during winter, the winter fronts are often associated with precipitation, thereby reducing the potential for dust entrainment (Ekstrom et al., Citation2004). Mineral dust can be transported long distances to south-eastern Australia in association with the eastward propagating frontal systems, reaching as far as New Zealand and beyond. It can also be transported to northern tropical Australia by postfrontal southerly winds and, subsequently, to north-western Australia and the Indian Ocean by south-easterly trade winds (Alizadeh Choobari et al., Citation2012a).
Australian dust particle size and colour is different from the Northern Hemisphere ‘dust belt’ (Kiefert et al., Citation1996; Qin and Mitchell, Citation2009; Radhi et al., Citation2010). For example, a greater fraction of larger particles has been found for Australian dust compared to African dust (Kiefert et al., Citation1996), suggesting that the optical properties of dust from Australia are different from the Sahara. Observations over Australia for identifying optical properties of mineral dust are rare, but a few field campaigns have been conducted over recent years. Using a cluster analysis of AErosol RObotic NETwork (AERONET) retrievals, Qin and Mitchell (Citation2009) identified strong absorption of radiation by Australian dust compared to the ‘dust belt’ of the Northern Hemisphere. By conducting a field experiment, Radhi et al. (Citation2010) investigated optical, physical and chemical characteristics of Australian dust. Their mineralogical analysis indicates that the iron content of Australian dust is higher than other major sources of dust in the Northern Hemisphere, similar to the results of Qin and Mitchell (Citation2009). The results of these earlier studies have been used to set the refractive index of Australian dust for short-wave radiation.
To our knowledge, there have been few modelling studies that have investigated radiative forcing by mineral dust aerosols over Australia. Using the CSIRO (the Commonwealth Scientific and Industrial Research Organisation) global climate model, Rotstayn et al. (Citation2010) showed that inclusion of radiative forcing by dust leads to better simulation of the spatial distribution of El Niño Southern Oscillation (ENSO) rainfall over Australia. Rotstayn et al. (Citation2011) found that radiative forcing by mineral dust reduces precipitation over Australia in dry El Niño years but increases it in wet La Niña years. Although these studies have provided an insight into the dust-induced changes of precipitation over Australia, estimates of the direct radiative effect of Australian dust are scarce. By investigating short-wave direct radiative forcing of Australian mineral dust, Alizadeh Choobari et al. (Citation2012b) found that suspended dust modifies the boundary layer profile and stabilises the lower atmosphere, leading to an overall reduction of wind speed near the surface, and its increase within the upper boundary layer and lower free atmosphere. However, this earlier study focused on an individual severe dust event during September 2009, leaving long-term effects of Australian dust radiative forcing still an open question. Furthermore, the direct effect of dust aerosols in the thermal infrared range over Australia remains unexplored.
This study therefore aims to improve understanding of the direct radiative effect of mineral dust over Australia by using the Weather Research and Forecasting with Chemistry (WRF/Chem) regional model. The objective of the study is two-fold: (1) to observe and simulate monthly variation of mineral dust over Australia during the drought period of austral spring and summer when dust outbreaks over central-eastern Australia are most frequent; and (2) to simulate short-wave and long-wave direct radiative forcing of mineral dust at the surface and top of the atmosphere (TOA) over the region. While long-term averaged observation data were used to investigate monthly to seasonal variation of mineral dust distribution over the region, due to computational constraints model simulations were only conducted from September 2009 to the end of February 2010 during a dry El Niño year when dust outbreaks over central-eastern Australia were significant.
The paper is organised as follows. Sections 2 and 3 describe observations and the model set up used in this study. Monthly variation of mineral dust distribution, as observed by satellites and simulated by the WRF/Chem model, is discussed in Section 4. Simulated short-wave and long-wave direct radiative forcing of mineral dust is the subject of Section 5. The atmospheric heating and cooling rates due to the interaction of mineral dust aerosols with short-wave and long-wave radiation are discussed in Section 6, while Section 7 presents a discussion and an overall conclusion.
2. Observations
2.1. MISR
The multi-angle imaging spectro radiometer (MISR) instrument on board the sun-synchronised polar orbiting NASA Terra satellite has been used to measure aerosol optical depth (AOD) since February 2000. The MISR cloud/plume fraction and height product has a vertical resolution of 500 m. MISR observes at nine distinct zenith angles ranging from 70° afterward to 70° forward in four spectral bands centred at 446, 558, 672, and 866 nm. As a result, MISR can retrieve aerosol properties over both land and ocean including highly reflective land surfaces such as deserts (Martonchik et al., Citation2004). The data used here are available daily and monthly AOD at 0.55 µm wavelength at a 0.5°×0.5° horizontal resolution retrieved from the MISR satellite instrument for the Australian region.
2.2. CALIOP
The cloud–aerosol lidar with orthogonal polarisation (CALIOP) was launched on board the Cloud–Aerosol Lidar and Infrared Pathfinder Satellite Observations (CALIPSO) spacecraft in April 2006 (Winker et al., Citation2007). CALIPSO is a sun-synchronised polar orbiting satellite which orbits the globe about 15 times a day, providing both day and night measurements. The data utilised here are dust extinction coefficients at 0.532 µm available from the CALIOP Level 3 aerosol profile monthly products with a horizontal resolution of 2°×5° (latitude/longitude) and a vertical resolution of 60 m, and both daytime and nighttime CALIOP data are taken into consideration. A constant lidar ratio value of 40 sr at 0.532 µm is used in the CALIOP algorithm to retrieve mineral dust, which is lower than the lidar ratio of 55±10 sr obtained from ground-based lidar observations. Furthermore, multiple scattering is ignored in the CALIOP retrievals (Wandinger et al., Citation2010). Cloud–aerosol discrimination (CAD), an indicator to discriminate between clouds (positive CAD) and aerosols (negative CAD), is used to exclude extinction caused by clouds. Only aerosol layers having CAD scores between −100 and −20 are used in the CALIOP algorithm because layers with CAD scores between 20 and −20 are often the result of erroneous layer detection triggered by noise.
3. Model description
The WRF/Chem regional model was applied to simulate mineral dust distribution and its optical properties over Australia. WRF is a non-hydrostatic, primitive equation model using terrain following coordinates (Janjic, Citation2003) that has been coupled with a chemistry module to integrate atmospheric chemistry and aerosols with the meteorological model (Grell et al., Citation2005). As a result, the influence of meteorology on aerosol diffusion, transport and deposition, and the influence of aerosols on the state of the atmosphere are both considered.
The GOCART (Goddard Global Ozone Chemistry Aerosol Radiation and Transport) simple aerosol scheme was used, as this study only focuses on the simulation of dust particles. The GOCART dust scheme considers preferential sources based on erodible fraction (Cavazos Guerra, Citation2011) and calculates the vertical dust flux from the surface as (Ginoux et al., Citation2001, Citation2004):1 where C is an empirical proportionality constant and tuned to 1.9 µg s2 m−5, u10 is the horizontal wind speed at 10 m, utp is the threshold velocity for wind erosion of particle size p, below which there is no dust emission, sp is the fraction of each size class of dust and S is the fraction of sediments accumulated in the topographic depression regions having bare surfaces that are available for wind erosion (Chin et al., Citation2003). The threshold velocity is believed to be the major source of uncertainty for dust emission (Ginoux et al., Citation2012). It depends on surface properties and is a function of particle size, air and particle density, and the bonding effect of soil moisture. Dust particles can be blown into the atmosphere when wind speed at 10 m (u10) exceeds the threshold velocity for a given particle size and density (utp) and surface wetness is smaller than the threshold value of 0.5. Surface wetness is taken into consideration because soil moisture increases the cohesion forces between soil particles (Tegen, Citation2003). Five discrete size bins of dust particles were considered, with idealised spherical shapes whose radii range from 0.1 to 10 µm. The five dust bins in the model are 0.1–1, 1–2, 2–3, 3–6 and 6–10 µm, with corresponding effective radii of 0.73, 1.4, 2.4, 4.5, and 8.0 µm. Consequently, direct radiative forcing of dust particles greater than 10 µm in radius is not considered in the current study. This implies that the radiative effect of dust may be underestimated over and near the source of dust where coarse particles are more abundant. The bin scheme adopted in this study is more realistic than the modal aerosol scheme that assumes that the shape of the size distribution does not change during transport (Tegen, Citation2003).
Dust particles can be transported by advection and eddy diffusion, while dry and wet deposition are removal processes. Dry deposition includes gravitational settling as a function of particle size and air viscosity, and surface deposition as a function of surface type and atmospheric stability conditions (Wesely, Citation1989). The wet deposition scheme considers stratiform and convective precipitation (Balkanski et al., Citation1993).
The Yonsei University (YSU) planetary boundary layer (PBL) parameterisation (Hong et al., Citation2006; Hong, Citation2010), the Noah land-surface model (Chen and Dudhia, Citation2001; Ek et al., Citation2003) and the Monin-Obukhov surface layer scheme (Obukhov, Citation1971) were used in the simulation. The Morrison (Morrison et al., Citation2009) and Grell 3D (Grell, Citation1993) schemes were used to represent cloud microphysics and convection processes. The rapid radiative transfer model for general circulation models (RRTMG) (Mlawer et al., Citation1997) was used for both short-wave and long-wave radiation to include the direct radiative effect of aerosols, while the indirect effects of mineral dust were not investigated in this study. The refractive index was calculated by volume averaging for each size bin, and Mie theory was used to estimate the extinction efficiency, the scattering efficiency and the asymmetry factor. Optical properties were then calculated by summation over all the size bins. The refractive index of mineral dust for short-wave radiation was considered to be wavelength independent and its real part was set to 1.58, following the work of Qin and Mitchell (Citation2009) over Australia. The imaginary part is uncertain and values ranging from 0.0004i to 0.006i have been suggested (e.g. Dubovik et al., Citation2002). The value of 0.003i was used by Zhao et al. (Citation2010) over the Sahara. However, the study by Radhi et al. (2010) indicates that Australian dust is rich in iron, with the iron content identified to be around 1.8 times larger than the Saharan dust. Accordingly, the imaginary part of the refractive index for short-wave radiation was considered to be 1.8 times greater than the value obtained over the Sahara, and set to 0.0054i. Due to insufficient information to constrain the refractive index of mineral dust for long-wave radiation, the default setting of the WRF/Chem model was used, with the real and imaginary parts considered to be wavelength dependent and to vary for 16 long-wave spectral bands ().
>Table 1 Refractive index of mineral dust for 16 long-wave spectral bands used in the WRF/Chem model
The model domain covers Australia and New Zealand using 335×250 grid points at 20 km horizontal resolution, with 27 vertical layers. Two simulations with and without dust were performed in a way that the two-way interaction between atmospheric processes and aerosols was included in the simulations. Direct radiative forcing of dust was calculated from the differences between the results of the two simulations. The simulation covers the period from 1 September 2009 to 28 February 2010 (referred to as the simulation period). Meteorological initial and boundary conditions were obtained from the National Centres for Environmental Prediction (NCEP) Final Analysis (FNL) re-analysis data at 1° resolution. The simulation was conducted by re-initializing meteorological conditions every 10 days with the FNL re-analysis data, and the boundary conditions were updated every 6 hours. The chemical boundary conditions are from the default profiles in the WRF/Chem model.
4. Observed and simulated dust
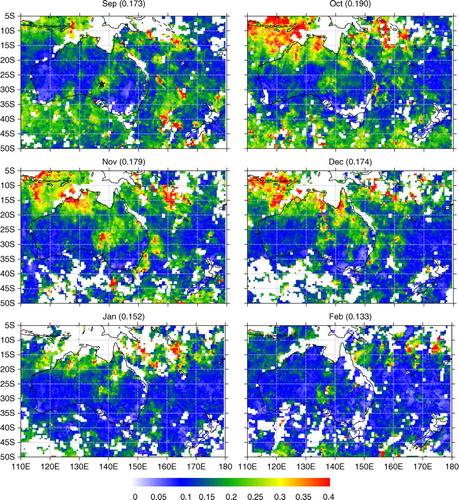
shows monthly mean AOD at 0.55 µm over Australia from September 2009 to February 2010 retrieved from the MISR satellite instrument. High AOD values reaching 0.4 are present over central-eastern Australia in all months, with peak values in November, although dust storm activity decreased substantially during January and February. There is also high aerosol loading over the tropical regions of northern Australia from September 2009 to January 2010 due to extensive biomass burning over the region (Edwards et al., 2006). The peak AOD due to biomass burning is in October, both over the tropical regions of northern Australia and Indonesia, with a pronounced decrease in February, reflecting rainfall increases associated with complete establishment of the Australian summer monsoon season. Note that generally biomass burning takes place during the August–September dry season over Indonesia, but its relatively high aerosol loading during October to December is due to the El Niño warm phase (Edwards et al., Citation2006) which caused significant drying in 2009 (Zhao and Running, Citation2010). The maximum and minimum domain averaged (50–5°S and 110–180°E) monthly mean AOD during the observed period was estimated to occur in October with 0.19 and February with 0.133, respectively ().
Fig. 1 Aerosol optical depth (AOD) at 0.55 µm from September 2009 to February 2010 retrieved from the MISR instrument. Domain averaged (5–50°S and 110–180°E) monthly mean AOD is indicated in brackets for each panel. The location of Lake Eyre Basin is shown by the star.
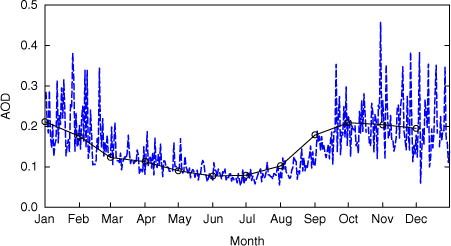
Available daily and monthly mean variation of AOD values over the Lake Eyre Basin region (26–29°S and 137–139°E) retrieved from the MISR satellite instrument for the period 2001 to 2011 is shown in . It is clear that dust activity over the basin started to increase in September, reached a peak in January, and began to decrease in March. Seasonally averaged AOD values were found to be 0.197 and 0.194 during spring (SON) and summer (DJF), respectively. In contrast, dust activity was substantially reduced over the region during autumn (MAM) and winter (JJA), with AOD values of 0.109 and 0.086, respectively. The maximum and minimum dust storm activity occurred in January and June with monthly mean AOD values of 0.212 and 0.077, respectively.
Fig. 2 Daily (blue) and monthly mean (black) variation of AOD over Lake Eyre Basin (26–29°S and 137–139°E) retrieved from the MISR satellite instrument and averaged for the period 2001 to 2011.
shows dust extinction coefficient (attenuation of light passing through the atmosphere by dust aerosols) profiles at 0.532 µm over Lake Eyre Basin (28°S and 137.5°E) for September 2009 to February 2010 retrieved from CALIOP. Dust extinction coefficients generally decrease with altitude (except in October when there is a second peak value of 0.043 km−1 at around 1.2 km height) and the peak values are located close to the surface in all months, indicating that Australian dust aerosols are mostly transported in the lower atmosphere and therefore expected to be mostly deposited near the dust source regions. The maximum dust extinction coefficients were observed in October 2009 and January 2010, with peak values reaching around 0.06 km−1 close to the surface. In contrast, the lowest dust extinction coefficient was observed in February 2010 when it reached a peak value of 0.017 km−1 near the surface. Seasonally averaged dust extinction coefficient profiles over Lake Eyre Basin from March 2009 to February 2010 are also compared in g. Dust aerosols reach higher altitudes and have greater concentrations in spring than other seasons, with substantially reduced values in winter. However, the longer time (2006–2011) seasonally averaged dust extinction coefficient profiles (which provide typical dust profiles) indicate that dust activity is greater over Lake Eyre Basin during summer relative to spring (h). This is in contrast to the results from long-term MISR data (2001–2011) that indicate slightly higher dust activity during spring.
Fig. 3 Dust extinction coefficient (km−1) profiles at 0.532 µm from (a–f) September 2009 to February 2010, (g) in different seasons from March 2009 to February 2010 and (h) seasonally averaged for the 6-yr period (2006–2011) over Lake Eyre Basin (28°S and 137.5°E), retrieved from CALIOP satellite lidar.
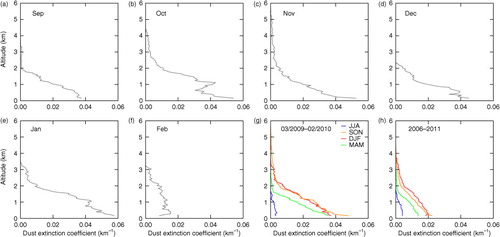
A dust aerosol layer extends from the surface to a height of around 4 km in spring and summer, which is higher than autumn and winter when the top of the dust layer reaches a height of around 2.5 and 1.5 km, respectively (h). This is due to the fact that more dust particles are entrained into the atmosphere during spring and summer (see ) and they can be carried to higher altitudes as a result of a deep mixed layer created by intense solar heating during warmer seasons. Note that indicates that seasonal mean aerosol extinction coefficients were significantly higher in 2009–2010 than the averaged values for the 6-yr period from 2006 to 2011 (except for similar patterns in winter) as there was severe drought over the region during 2009 and early 2010 (Zhao and Running, Citation2010).
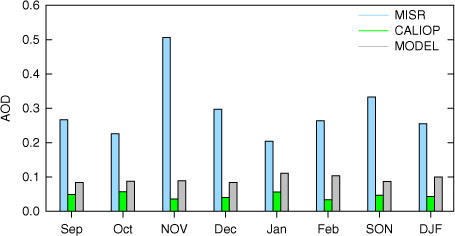
Monthly mean AOD over Lake Eyre Basin retrieved from the MISR and CALIOP instruments and the WRF/Chem model for September 2009 to February 2010 is shown in . The MISR data show that the maximum and minimum AOD occurred in November 2009 (0.506) and January 2010 (0.204) respectively, while CALIOP data indicate that peaks occurred in October 2009 (0.057) and January 2010 (0.056), with minimum values observed in February 2010 (0.034). The maximum AOD in October and January retrieved from CALIOP was caused by large amounts of elevated dust compared to other months, while the minimum value in February is due to both less near-surface and elevated dust aerosols, as shown in . Note that monthly mean AOD values from CALIOP are substantially less than those from MISR. The underestimation of AOD by CALIOP is due to the fact that a low lidar ratio is used in the CALIOP algorithm to retrieve mineral dust, multiple scattering is not taken into account in the CALIOP retrievals for dense dust layers (Wandinger et al., Citation2010), and dense dust plumes can be misclassified as clouds (Tsamalis and Chedin, Citation2012). Furthermore, regions that are identified as clear air by the CALIOP feature finder are assumed to have an aerosol extinction coefficient of 0.0 km−1 in the CALIOP algorithm. Differences in the timing of maximum and minimum AOD values obtained from the MISR and CALIOP datasets are caused by differences between their sensors and their different spatial and temporal resolution (Petrenko et al., Citation2012). Monthly mean simulated AOD values are greater than AOD values retrieved from CALIOP, but less than those from MISR. The minimum AOD (0.084) is simulated in September and December 2009, while the maximum AOD (0.111) is predicted to be in January 2010. The WRF/Chem model simulated higher AOD during summer than spring, primarily due to drier land surfaces in summer.
Fig. 4 Monthly average AOD observed by the MISR and CALIOP satellite instruments and simulated by the WRF/Chem model over Lake Eyre Basin (28°S and 137.5°E) from September 2009 to February 2010.
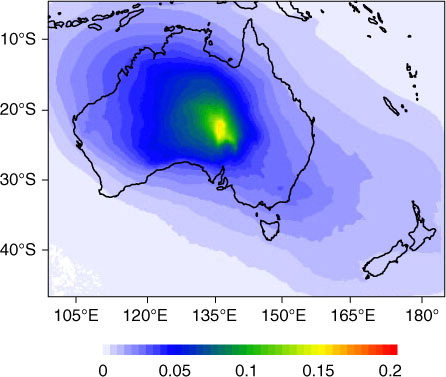
Dust optical depth (DOD) at 0.55 µm over Australia averaged over the simulation period from September 2009 to February 2010 is shown in . It clearly indicates that the most important source of dust is located over Lake Eyre Basin, with the averaged DOD reaching less than 0.2. Australian dust plumes are mostly carried through the north-western corridor towards the Timor Sea and Indian Ocean. Transport of dust in a northward direction to tropical northern Australia and in an east to south-eastward direction to the Coral and Tasman Seas and the Southern Ocean is also simulated by the model (). It is also evident that dust from Lake Eyre Basin affects New Zealand during spring and summer.
Fig. 5 Simulated dust optical depth (DOD) at 0.55 µm averaged for a 6-month period from September 2009 to February 2010.
5. Short-wave and long-wave radiative forcing by dust
shows simulated clear-sky short-wave, long-wave, and net (short-wave + long-wave) direct radiative forcing by mineral dust aerosols at the surface and TOA averaged for a 6-month period from September 2009 to February 2010. Short-wave radiative forcing is negative at the surface due to scattering and absorption of solar radiation by dust aerosols. Similarly, it is generally negative at the TOA, indicating an increase of outgoing short-wave radiation by dust aerosols. In contrast, mineral dust aerosols trap long-wave radiation, thereby inducing positive long-wave radiative forcing at the surface. At the TOA, both positive and negative long-wave radiative forcing are simulated, and the domain averaged (over the entire domain shown in ) long-wave radiative forcing is nearly zero. The net direct radiative forcing is negative at the surface as the short-wave cooling effect of dust outweighs the long-wave warming effect. The net radiative forcing is also negative at the TOA, corresponding to a cooling of the atmosphere by an increase of outgoing radiation (increased reflection of radiation to space).
Fig. 6 Simulated clear-sky short-wave, long-wave and net (short-wave + long-wave) direct radiative forcing (W m−2) by dust aerosols at the surface and TOA averaged from September 2009 to February 2010. The domain averaged radiative forcing by dust averaged over the simulation period is indicated in brackets for each panel.
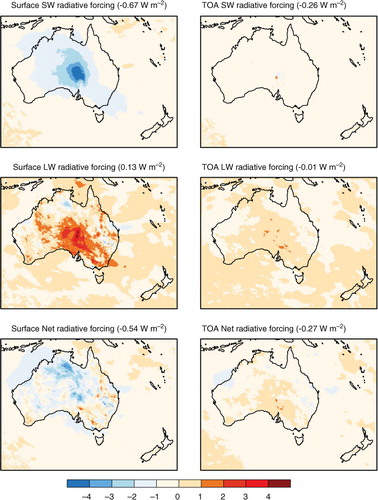
The domain averaged radiative forcing by mineral dust aerosols over the simulation period indicates that the long-wave warming effect of dust (0.13 W m−2) offsets 19.4% of its short-wave cooling effect (−0.67 W m−2) at the surface (). As a result, the net direct radiative forcing of dust has the negative value of −0.54 W m−2 at the surface because scattering and absorption of solar radiation dominates over the trapping of infrared radiation. Similarly, the net direct radiative forcing of mineral dust has a negative value of −0.27 W m−2 at the TOA. The difference between surface and TOA net radiative forcing is a value of 0.27 W m−2 which represents the amount of radiation that is absorbed by mineral dust. Note that both short-wave and long-wave radiative forcing of dust is higher over the dust source regions in central-eastern Australia (as shown in ) because of higher AOD (). The higher long-wave radiative forcing over central-eastern Australia is also due to a stronger interaction between long-wave radiation and coarse dust particles that are more abundant over and near the source regions.
shows simulated clear-sky monthly mean and a 6-month averaged direct radiative forcing of dust at the surface and TOA over Lake Eyre Basin. Over the simulation period, the long-wave warming effect of dust (4.41 W m−2) offsets 60.9% of its short-wave cooling effect (−7.24 W m−2) at the surface. At the TOA, the long-wave warming effect of dust (0.94 W m−2) accounts for 61% of its short-wave cooling effect (−1.54 W m−2). Consequently, the net impact of dust is a negative forcing both at the surface and TOA, with values of −2.83 W m−2 and −0.6 W m−2, respectively. The net negative forcing at the surface and TOA demonstrates a reduction of radiation reaching the surface and an increase of reflection of radiation to space, respectively. The difference between net radiative forcing at the surface and TOA is 2.23 W m−2, representing the amount of radiation that is absorbed by mineral dust. Note that over Lake Eyre Basin, the long-wave warming effect has a larger contribution to countering the short-wave cooling effect of dust (reaching 60.9% at the surface) compared to the domain averaged contribution (reaching 19.4% at the surface). This is because larger dust particles are more abundant over dust source regions, which therefore have a stronger interaction with long-wave radiation.
Table 2 Simulated clear-sky monthly averaged shortwave, long-wave and net (short-wave + long-wave) direct radiative forcing (W m−2) by dust aerosols at the surface and TOA over Lake Eyre Baisn (28°S and 137.5°E)
Diurnal cycles of downward and upward short-wave and long-wave fluxes at the surface and TOA over Lake Eyre Basin averaged over the simulation period for both dust and dust-free conditions are shown in , and the corresponding daily averages are given in brackets. At the surface, downward short-wave radiative forcing is negative due to absorption and backscattering of solar radiation by dust. It varies with solar zenith angle during daytime with stronger forcing in the early afternoon because the Sun's rays are near vertical and have their strongest intensity, but also because aerosol absorption decreases with increasing solar zenith angle (Yu et al., Citation2006). In contrast, downward long-wave radiative forcing by mineral dust is positive during both day and night. Daily average downward short-wave radiative forcing has a negative value of −8.9 W m−2, while daily average downward long-wave radiative forcing has a positive value of 3.7 W m−2.
Fig. 7 Clear-sky diurnal cycle of (a) downward short-wave and long-wave radiation (W m−2) at the surface and (b) upward short-wave and long-wave radiation (W m−2) at the TOA over Lake Eyre Basin (28°S and 137.5°E) averaged for a 6-month period from September 2009 to February 2010. The daily average short-wave and long-wave radiative forcing by dust at the surface and TOA is indicated for each panel.
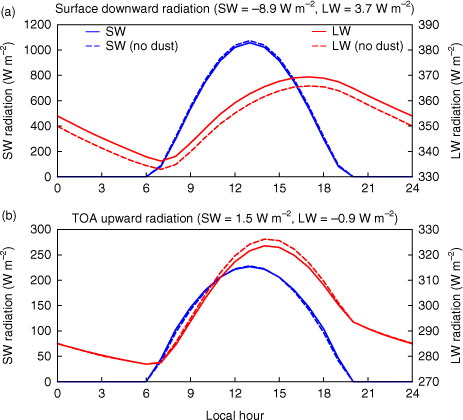
At the TOA, upward short-wave radiative forcing by dust is positive, with a daily average value of 1.5 W m−2. In contrast, upward long-wave radiative forcing overall is negative, with a daily average value of −0.9 W m−2. This leads to a net upward daily mean radiative forcing of 0.4 W m−2, meaning that mineral dust increases reflection of radiation to space, corresponding to a cooling of the atmosphere. Upward long-wave radiative forcing by dust at the TOA is negative during daytime. This implies that during daytime mineral dust decreases scattering of long-wave radiation to space. Upward short-wave direct radiative forcing at the TOA has its lowest value at noon and in the early afternoon when the Sun's rays are near vertical and passing through fewer dust aerosols. This implies that the fraction of short-wave radiation scattered back to space is a function of solar zenith angle. Note that there is a lag between the maximum incoming long-wave radiation at the surface and the maximum outgoing long-wave radiation at the TOA in . The reason for this is that the incoming long-wave radiation at the surface is a function of the weighted average temperature of the column of atmosphere above Lake Eyre Basin and it takes a long time for the column of air to heat up, while the outgoing long-wave radiation at the TOA is predominantly a function of land surface temperature that heats up very quickly in the early afternoon.
6. Atmospheric heating and cooling rates
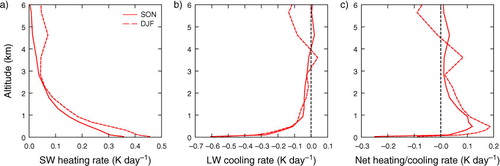
Atmospheric heating and cooling profiles due to the interaction of short-wave and long-wave radiation with dust aerosols over Lake Eyre Basin averaged for spring and summer are shown in . Due to absorption of radiation by dust, the short-wave heating effect of dust is simulated with a maximum rate of around 0.35 K d−1 and 0.45 K d−1 near the surface in spring and summer, respectively (a). The short-wave heating effect has a decreasing trend with altitude, reflecting fewer and smaller dust particles at higher levels (as smaller dust particles are less absorbing). The short-wave heating of the atmosphere is a unique characteristic of absorbing aerosols such as mineral dust. In contrast, the long-wave effect of dust in the atmosphere is negative with a rate reaching a value of around −0.6 K d−1 and −0.5 K d−1 near the surface in spring and summer, respectively, and a decreasing trend with altitude (b). The long-wave effect of dust cools the atmosphere because absorption of long-wave radiation by mineral dust is less than its emission to the surface and TOA. Near the surface, large dust particles are generally present (particularly over dust source areas) that have a stronger interaction with long-wave radiation, and because this interaction is present both during day and night, the long-wave cooling rate of the atmosphere by dust dominates over the short-wave warming effect. In contrast, short-wave atmospheric heating dominates at higher altitudes where there is less interaction between dust particles and long-wave radiation due to presence of smaller size particles at higher altitudes. As a result, the net direct radiative impact of mineral dust produces cooling of the atmosphere near the surface (below around 0.2 km) with maximum rates of around −0.25 and −0.09 K d−1 in spring and summer, respectively. In contrast, warming of the atmosphere aloft (above 0.2 km) is simulated with maximum rates of around 0.12 and 0.18 K d−1 at 0.5 km height in spring and summer, respectively (c). The cooling at the surface () and in the lower atmosphere (below around 0.2 km height), and warming the atmosphere aloft (c) contributes to stabilising the atmosphere over central-eastern Australia.
Fig. 8 Simulated atmospheric heating and cooling profiles (K d−1) due to the interaction of (a) short-wave, (b) long-wave, and (c) net (short-wave + long-wave) radiation with dust aerosols averaged for austral spring (solid red line) and summer (dashed red line) over Lake Eyre Basin (28°S and 137.5°E).
It should be noted that although the net direct radiative effect of dust for the entire day is cooling the lower atmosphere and warming the layers above (c), its impact on the vertical profile of potential temperature and subsequent impact on the stability of the atmosphere is different during day and night. During daytime, a reduction of short-wave radiation reaching the surface is associated with a decrease of potential temperature in the lower atmosphere and its increase in layers above, leading to an increase of atmospheric stability. During nighttime, on the other hand, trapping of the long-wave radiation results in an increase of potential temperature in the lower atmosphere, and a decrease in atmospheric layers above, which in turn destabilises the atmosphere.
7. Discussion and conclusions
Short-wave and long-wave direct radiative forcing by mineral dust aerosols over Australia has been investigated in a dry El Niño year during austral spring and summer when dust outbreaks over central-eastern Australia are most frequent using the WRF/Chem regional model with the GOCART simple aerosol scheme. The model results are complemented by satellite data to investigate monthly variation of mineral dust distribution. There are some differences between the simulated and satellite retrievals of AOD which mainly arise from using the simplified GOCART dust emission scheme that considers preferential sources based on erodible fraction rather than individual soil particle properties (Cavazos Guerra, Citation2011). However, there are some uncertainties in the retrieved AOD from satellites, most notably associated with cloud contamination and variability of surface albedo over land (Yu et al., Citation2006).
Mineral dust from interior Australia is simulated to be mainly transported in a north to northwest direction towards the tropical regions of northern Australia and the Indian Ocean, and an east to south-eastward direction towards the Coral and Tasman Seas and the Southern Ocean. These transport pathways are consistent with the results of Alizadeh Choobari et al. (Citation2012a) using the dust transport (DUSTRAN) module embedded within the WRF/Chem model for a single severe dust event over Australia during 22–23 September 2009. Retrieved dust extinction coefficient profiles from CALIOP indicate that on a long-term basis (2006–2011) the peak dust activity over Australia occurs during summer, followed by spring. The maximum dust activity in the spring-summer period is in agreement with the results of Radhi et al. (Citation2010) using AERONET observations, who identified maximum aerosol content with coarse mode at this time of the year. The spring-summer peak is caused by strong winds associated with the passage of non-precipitating cold fronts (Ekstrom et al., Citation2004) and dry conditions. The summer peak dust load simulated by the model and observed by CALIOP (for the period 2006–2011) is consistent with the results of Ekstrom et al. (Citation2004) using ground-based measurements for the period 1960 to 1999, and Mitchell et al. (2010) using the AERONET observations at Tinga Tingana (29°S and 139.5°E), Lake Eyre Basin for the period 2003 to 2007.
Mineral dust aerosols reach a maximum height of around 4 km over Lake Eyre Basin in spring and summer, which is lower than the dust layer over North Africa (Liu et al., Citation2008) and the Taklimakan desert (Huang et al., Citation2008). Dust concentrations over Lake Eyre Basin decrease substantially in autumn and winter when the top of the dust layer only reaches a height of around 2.5 and 1.5 km, respectively. The lower elevation of Australian dust aerosols implies that they have a lower surface radiative cooling effect than ‘dust belts’ of the Northern Hemisphere because there is little vertical exchange of the heat absorbed by mineral dust and the surface when the dust layer is located well above the boundary layer (Chung and Zhang, Citation2004).
Clear-sky domain averaged short-wave direct radiative forcing by dust averaged over the simulation period is estimated to be −0.67 W m−2 and −0.26 W m−2 at the surface and TOA, respectively. The short-wave surface cooling effect of dust is about 2.6 times larger than the TOA cooling effect because of dust aerosol absorption. The simulated short-wave cooling at the surface (−0.67 W m−2) is less than the observed annual average global short-wave direct forcing over land and ocean (−10.3 W m−2) (Yu et al., Citation2006). The lower estimates of short-wave radiative forcing by dust over Australia simulated by the WRF/Chem model are expected because the model-based estimates of direct radiative forcing are generally smaller than the satellite-based estimates (Yu et al., Citation2006). Such discrepancy partly arises because satellite-based direct radiative effect estimates are contaminated by clouds and are poorly constrained over land due to variability of surface albedo. Indeed, as outlined by Yu et al. (Citation2006), the satellite-based direct radiative effect estimates are reduced and become more consistent with the model-based estimates after considering cloud contamination.
The domain averaged short-wave and long-wave direct radiative forcing by mineral dust over Australia is substantially lower than model-based estimates over West Africa. For example, a −12.37 W m−2 short-wave cooling and 6.26 W m−2 long-wave warming effect of mineral dust was simulated at the surface over West Africa during 1 May to 30 September 2006 using the WRF/Chem model (Zhao et al., Citation2011), which is significantly higher than the −0.67 W m−2 short-wave cooling and 0.13 W m−2 long-wave warming estimates obtained in the present study. This suggests a lesser impact of Australian dust on the Earth's climate system compared to other major dust sources in the Northern Hemisphere.
The atmospheric heating rate due to the interaction of short-wave radiation with dust aerosols is simulated because mineral dust absorbs both incoming and outgoing short-wave radiation. The maximum short-wave heating rate over Lake Eyre Basin occurred near the surface with a maximum value of about 0.4 K d−1 averaged over the simulation period and a decreasing trend with altitude. The short-wave heating of the atmosphere is similar to the results of Zhao et al. (Citation2010), who identified a maximum short-wave heating rate of around 0.8 K d−1 but at 0.5 km height at Niamey Airport during 13 January to 3 February 2006. In contrast, the effect of dust on long-wave radiation in the atmosphere is found to be negative with a maximum rate of around −0.55 K d−1 near the surface averaged over the simulation period, and a rapid decrease with altitude. The cooling of the atmosphere due to interaction of suspended dust with long-wave radiation is similar to the results of Zhao et al. (Citation2011) over West Africa who attributed such cooling to the increased atmospheric outgoing long-wave radiation by dust aerosols. Therefore, dust induces contrasting long-wave cooling and short-wave warming of the atmosphere. Near the surface (below 0.2 km) where larger dust particles are more abundant, the long-wave cooling effect of the atmosphere by dust is greater than the short-wave warming effect of the atmosphere. In contrast, at higher altitudes (above 0.2 km) where smaller dust particles are more abundant, the opposite is true. This leads to a net cooling of the atmosphere near the surface (below 0.2 km), and warming of the atmosphere above, which has consequences for increasing the stability of the atmosphere. This increased stability due to direct radiative forcing of mineral dust is consistent with previous studies (e.g. Miller et al., Citation2004).
This study only examined the direct radiative forcing by mineral dust over Australia during a 6-month period of austral spring and summer in a dry El Niño year, while such forcing is expected to have lower values in neutral or wet La Niña years. Therefore, the results do not necessarily provide a comprehensive climatology of the direct radiative forcing by dust aerosols over Australia. To fully understand the regional climate impact of mineral dust over Australia, long-term multi-year simulations that include both direct and indirect effects need to be conducted.
8. Acknowledgments
The authors would like to thank the Foundation for Research, Science and Technology and the National Institute for Water and Atmospheric Research (New Zealand) for their ongoing financial support. This work has also benefited from access to the Bluefern Supercomputer facilities at the University of Canterbury, New Zealand.
Related Research Data
References
- Ackerman A. S , Toon O. B , Stevens D. E , Heymsfield A. J , Ramanathan V , Welton E. J . Reduction of tropical cloudiness by soot. Science. 2000; 288(5468): 1042–1047.
- Alizadeh Choobari O , Zawar-Reza P , Sturman A . Atmospheric forcing of the three-dimensional distribution of dust particles over Australia: a case study. J. Geophys. Res. 2012a; 117: D11206.
- Alizadeh Choobari O , Zawar-Reza P , Sturman A . Feedback between windblown dust and planetary boundary-layer characteristics: sensitivity to boundary and surface layer parameterizations. Atmos. Environ. 2012b; 61: 294–304.
- Alizadeh Choobari O , Zawar-Reza P , Sturman A . Low level jet intensification by mineral dust aerosols. Ann. Geophys. 2013; 31: 625–632.
- Andreae M. O , Rosenfeld D , Artaxo P , Costa A. A , Frank G. P , co-authors . Smoking rain clouds over the Amazon. Science. 2004; 303(5662): 1337–1342.
- Balkanski Y. J , Jacob D. J , Gardner G. M , Graustein W. C , Turekian K. K . Transport and residence times of tropospheric aerosols inferred from a global three-dimensional simulation of 210Pb. J. Geophys. Res. 1993; 98(D11): 20573–20586.
- Bullard J. E , McTainsh G. H . Aeolian-fluvial interactions in dryland environments: examples, concepts and Australia case study. Prog. Phys. Geog. 2003; 27(4): 471–501.
- Cavazos Guerra C. D. C . Modelling the Atmospheric Controls and Climate Impact of Mineral Dust in the Sahara Desert. 2011; London: PhD Thesis. University College London.
- Chen F , Dudhia J . Coupling an advanced land surface-hydrology model with the Penn State-NCAR MM5 modeling system. Part I: model implementation and sensitivity. Mon. Weather. Rev. 2001; 129(4): 569–585.
- Chin M , Ginoux P , Lucchesi R , Huebert B , Weber R , co-authors . A global aerosol model forecast for the ACE-Asia field experiment. J. Geophys. Res. 2003; 108: D23.
- Chung C. E , Zhang G. J . Impact of absorbing aerosol on precipitation: dynamic aspects in association with convective available potential energy and convective parameterization closure and dependence on aerosol heating profile. J. Geophys. Res. 2004; 109: D22103.
- Darmenova K , Sokolik I. N , Shao Y , Marticorena B , Bergametti G . Development of a physically based dust emission module within the Weather Research and Forecasting (WRF) model: assessment of dust emission parameterizations and input parameters for source regions in Central and East Asia. J. Geophys. Res. 2009; 114: D14201.
- Dubovik O , Holben B , Eck T. F , Smirnov A , Kaufman Y. J , co-authors . Variability of absorption and optical properties of key aerosol types observed in worldwide locations. J. Atmos. Sci. 2002; 59(3): 590–608.
- Edwards D. P , Emmons L. K , Gille J. C , Chu A , Attie J.-L , co-authors . Satellite-observed pollution from Southern Hemisphere biomass burning. J. Geophys. Res. 2006; 111: D14312.
- Ek M. B , Mitchell K. E , Lin Y , Rogers E , Grunmann P , co-authors . Implementation of Noah land surface model advances in the National Centers for Environmental Prediction operational mesoscale Eta model. J. Geophys. Res. 2003; 108(D22): 8851.
- Ekstrom M , McTainsh G. H , Chappell A . Australian dust storms: temporal trends and relationships with synoptic pressure distributions (1960–99). Int. J. Climatol. 2004; 24(12): 1581–1599.
- Ferek R. J , Liu Q. F , Albrecht B. A , Babb D , Garrett T , co-aothors . Drizzle suppression in ship tracks. J. Atmos. Sci. 2000; 57(16): 2707–2728.
- Ginoux P , Chin M , Tegen I , Prospero J , Holben B , co-authors . Sources and distributions of dust aerosols simulated with the GOCART model. J. Geophys. Res. 2001; 106(D17): 20255–20273.
- Ginoux P , Prospero J. M , Torres O , Chin M . Long-term simulation of global dust distribution with the GOCART model: correlation with North Atlantic Oscillation. Environ. Model. Software. 2004; 19(2): 113–128.
- Ginoux P. A , Prospero J. M , Gill T. E , Hsu C , Zhao M . Global-scale attribution of anthropogenic and natural dust sources and their emission rates based on MODIS Deep Blue aerosol products. Rev. Geophys. 2012; 50: RG3005.
- Grell G. A . Prognostic evaluation of assumptions used by cumulus parameterizations. Mon. Weather. Rev. 1993; 121(3): 764–787.
- Grell G. A , Peckham S. E , Schmitz R , McKeen S. A , Frost G , co-authors . Fully coupled “online” chemistry within the WRF model. Atmos. Environ. 2005; 39(37): 6957–6975.
- Gunn R , Phillips B. B . An experimental investigation of the effect of air pollution on the initiation of rain. J. Meteorol. 1957; 14(3): 272–280.
- Hansen J , Sato M , Ruedy R . Radiative forcing and climate response. J. Geophys. Res. 1997; 102(D6): 6831–6864.
- Hong S. Y . A new stable boundary-layer mixing scheme and its impact on the simulated East Asian summer monsoon. Q. J. R. Meteorol. Soc. 2010; 136(651): 1481–1496.
- Hong S. Y , Noh Y , Dudhia J . A new vertical diffusion package with an explicit treatment of entrainment processes. Mon. Weather. Rev. 2006; 134(9): 2318–2341.
- Huang J , Minnis P , Chen B , Huang Z , Liu Z , co-authors . Long-range transport and vertical structure of Asian dust from CALIPSO and surface measurements during PACDEX. J. Geophys. Res. 2008; 113: D23212.
- Huneeus N , Dentener F , Diehl T , Easter R , Fillmore D , co-authors . Global dust model intercomparison in AeroCom phase I. Atmos. Chem. Phys. 2011; 11(15): 7781–7816.
- Janjic Z. I . A nonhydrostatic model based on a new approach. Meteorol. Atmos. Phys. 2003; 82(1): 271–285.
- Kahn R , Gaitley R , Martonchik J , Diner D , Crean K , co-authors . MISR global aerosol optical depth validation based on two years of coincident AERONET observations. J. Geophys. Res. 2005; 110: D10S04.
- Kiefert L , McTainsh G. H , Nickling W. G , Guerzoni S , Chester R . Sedimentological characteristics of Saharan and Australian dusts. The Impact of Desert Dust Across the Mediterranean. 1996; 183–190. Environmental Science and Technology Library, 11.
- Koren I , Kaufman Y. J , Remer L. A , Martins J. V . Measurement of the effect of Amazon smoke on inhibition of cloud formation. Science. 2004; 303(5662): 1342–1345.
- Leon J.-F , Tanre D , Pelon J , Kaufman Y. J , Haywood J. M , co-authors . Profiling of a Saharan dust outbreak based on a synergy between active and passive remote sensing. J. Geophys. Res. 2003; 108(D18): 8575.
- Liou K , Ou S . The role of cloud microphysical processes in climate: an assessment from a one-dimensional perspective. J. Geophys. Res. 1989; 94(D6): 8599–8607.
- Liu Z , Omar A , Vaughan M , Hair J , Kittaka C , co-authors . CALIPSO lidar observations of the optical properties of Saharan dust: a case study of long-range transport. J. Geophys. Res. 2008; 113: D07207.
- Martonchik J. V , Diner D. J , Kahn R , Gaitley B , Holben B. N . Comparison of MISR and AERONET aerosol optical depths over desert sites. Geophys. Res. Lett. 2004; 31: L16102.
- McCarthy J. J , Canziani O. F , Leary N. A , Dokken D. J , White K. S. e . Climate Change 2001: Impacts, Adaptations, and Vulnerability. 2001; Cambridge University Press: Cambridge, UK.
- McCormick R. A , Ludwig J. H . Climate modification by atmospheric aerosols. Science. 1967; 156(3780): 1358–1359.
- Miller R , Perlwitz J , Tegen I . Feedback upon dust emission by dust radiative forcing through the planetary boundary layer. J. Geophys. Res. 2004; 109: D24.
- Miller R , Tegen I . Climate response to soil dust aerosols. J. Clim. 1998; 11(12): 3247–3267.
- Mitchell R. M , Campbell S. K , Qin Y . Recent increase in aerosol loading over the Australian arid zone. Atmos. Chem. Phys. 2010; 10(4): 1689–1699.
- Mlawer E. J , Taubman S. J , Brown P. D , Iacono M. J , Clough S. A . Radiative transfer for inhomogeneous atmospheres: RRTM, a validated correlated-k model for the longwave. J. Geophys. Res. 1997; 102(D14): 16663–16682.
- Morrison H , Thompson G , Tatarskii V . Impact of cloud microphysics on the development of trailing stratiform precipitation in a simulated squall line: comparison of one- and two-moment schemes. Mon. Weather. Rev. 2009; 137(3): 991–1007.
- Obukhov A. M . Turbulence in an atmosphere with a non-uniform temperature. Boundary-Layer Meteorol. 1971; 2(1): 7–29.
- Petrenko M , Ichoku C , Leptoukh G . Multi-sensor aerosol products sampling system (MAPSS). Atmos. Measur. Tech. 2012; 5: 913–926.
- Prospero J , Ginoux P , Torres O , Nicholson S , Gill T . Environmental characterization of global sources of atmospheric soil dust identified with the Nimbus 7 Total Ozone Mapping Spectrometer (TOMS) absorbing aerosol product. Rev. Geophys. 2002; 40(1): 1002.
- Qin Y , Mitchell R. M . Characterisation of episodic aerosol types over the Australian continent. Atmos. Chem. Phys. 2009; 9(6): 1943–1956.
- Radhi M , Box M. A , Box G. P , Mitchell R. M , Cohen D. D , co-authors . Optical, physical and chemical characteristics of Australian continental aerosols: results from a field experiment. Atmos. Chem. Phys. 2010; 10(13): 5925–5942.
- Rosenfeld D . Suppression of rain and snow by urban and industrial air pollution. Science. 2000; 287(5459): 1793–1796.
- Rotstayn L. D , Collier M. A , Dix M. R , Feng Y , Gordon H. B , co-authors . Improved simulation of Australian climate and ENSO-related rainfall variability in a global climate model with an interactive aerosol treatment. Int. J. Climatol. 2010; 30(7): 1067–1088.
- Rotstayn L. D , Collier M. A , Mitchell R. M , Qin Y , Campbell S. K , co-aothors . Simulated enhancement of ENSO-related rainfall variability due to Australian dust. Atmos. Chemis. Phys. 2011; 11(13): 6575–6592.
- Tegen I . Modeling the mineral dust aerosol cycle in the climate system. Q. Sci. Rev. 2003; 22(18): 1821–1834.
- Tegen I , Lacis A , Fung I . The influence on climate forcing of mineral aerosols from disturbed soils. Nature. 1996; 380(6573): 419–422.
- Tegen I , Werner M , Harrison S , Kohfeld K. E . Relative importance of climate and land use in determining present and future global soil dust emission. Geophys. Res. Lett. 2004; 31: L05105.
- Textor C , Schulz M , Guibert S , Kinne S , Balkanski Y , co-authors . Analysis and quantification of the diversities of aerosol life cycles within Aerocom. Atmos. Chem. Phys. 2006; 6(7): 1777–1813.
- Tsamalis C , Chedin A . Dust aerosol optical depth above Sahara and Arabian Peninsula from CALIOP: comparison with MODIS and MISR, paper presented at CALIPSO, CloudSat, EarthCARE J. Work . 2012; France: Paris. 18–22.
- Wandinger U , Tesche M , Seifert P , Ansmann A , Muller D , co-authors . Size matters: influence of multiple scattering on CALIPSO light-extinction profiling in desert dust. Geophys. Res. Lett. 2010; 37(L10801):
- Wesely M. L . Parameterization of surface resistances to gaseous dry deposition in regional-scale numerical models. Atmos. Environ. 1989; 41: 52–63.
- Winker D. M , Hunt W. H , McGill M. J . Initial performance assessment of CALIOP. Geophys. Res. Lett. 2007; 34: L19803.
- Yu H , Kaufman Y , Chin M , Feingold G , Remer L , co-authors . A review of measurement-based assessments of the aerosol direct radiative effect and forcing. Atmos. Chem. Phys. 2006; 6(3): 613–666.
- Zhao C , Liu X , Leung L. R , Hagos S . Radiative impact of mineral dust on monsoon precipitation variability over West Africa. Atmos. Chem. Phys. 2011; 11(5): 1879–1893.
- Zhao C , Liu X , Leung L. R , Johnson B , McFarlane S , co-authors . The spatial distribution of mineral dust and its shortwave radiative forcing over North Africa: modeling sensitivities to dust emissions and aerosol size treatments. Atmos. Chem. Phys. 2010; 10(18): 8821–8838.
- Zhao M , Running S. W . Drought-induced reduction in global terrestrial net primary production from 2000 through 2009. Science. 2010; 329(5994): 940–943.