Abstract
Regional haze episodes have been frequently reported in east China since 2000. In the present study, two regional haze episodes over east China in the spring of 2011 were examined by observations and simulations conducted by a three-dimensional regional chemical transport model (NAQPMS) with an on-line tracer-tagged module. The model reproduced accurately the observed PM2.5 with correlation coefficient ranging from 0.52 to 0.76 and root mean square error (RMSE) of 20–50µg/m3 in four city clusters (Yangtze River Delta, Shandong Peninsula, Huabei Plain and Central Liaoning) over east China. Our results indicate that a northward cross-border transport from the Yangtze River Delta to Central Liaoning below 2 km above ground played an important role in the formation of these regional high PM2.5 episodes. Contributions of regional transport from outside city clusters presented an increasing trend from south to north. In the northernmost cluster (Central Liaoning), the contribution from other city clusters reached 40–50% during the two episodes. In contrast, it was below 10% in the Yangtze River Delta (southernmost cluster). Mixing accumulation of pollutants from various city clusters during transport was responsible for this trend. Furthermore, a preliminary estimate shows that cross-border transport of PM2.5 might increase 0.5–3% daily mortality during the high PM2.5 episodes.
1. Introduction
Over the last few decades, China has experienced urbanisation on an unprecedented scale. By the end of 2011, the urban population made up 51.3% of the total population, up from 26% in 1990 (Juan, Citation2011). The high population concentrations could bring a variety of atmospheric environmental problems. Regional haze is the most serious of these air pollution problems (He et al., Citation2002). In particular, over the rapidly developed city clusters [e.g. Hua Bei Plain (HBP), Shandong peninsula (SD), Yangtze River Delta (YRD)] and the old industrial base [in Central Liaoning (CL)] (Fig. S1 in the supplement), regional haze pollution is common and occurs on more than 10 d per month (Tao et al., Citation2012; Zhang et al., Citation2012). Even worse, a rapid increase in haze days has continued since the 1980s (from ~50 d in the 1980s to ~100 d in the 2000s) (Zhang et al., Citation2012). Aerosols released by anthropogenic emission and their cross-border transport between cities are thought to be responsible for regional low visibility and human health. Observations at 16 urban and rural stations show that urban annual PM10 (particles on the order of ~10 µm or less) in China has reached ~200 µg/m3, which greatly exceeds the National Grade II: 70 µg/m3 (Zhang et al., Citation2012). Even annual PM10 at rural sites has exceeded ~100 µg/m3. This indicates that aerosol concentrations are becoming more uniform among urban and rural regions in China. Recently, policymakers have realised that cross-border transport in one city cluster has contributed significantly to this uniform PM10 level. As one of megacities with a 12 million population, Beijing received 20–50% of PM10 from other cities in the Hua Bei Plain cluster (Beijing, Tianjin, and Hebei province) (Wang et al., Citation2008). The Yangtze River Delta (Shanghai, Jiangsu and Zhejiang provinces) shows a similar situation (Wang et al., Citation2007). The effect of cross-border transport on rural aerosols is more significant. The study of Ge et al. (Citation2012) revealed that the contribution of regional transport of urban plumes to rural secondary pollutants was three times higher than that of local emissions in HBP. Taking into account the key role of cross-border transport, the national-level policymakers (the State Council of China) pushed forward a joint prevention and control strategy to reduce atmospheric pollution and improve regional air quality. This strategy dictates that cities in a city cluster take control measures under unified planning and coordination for effectively preventing cross-border transport of pollutants. Thirteen city clusters (e.g. HBP, YRD, CL, SD, and Pearl River Delta Region) are targeted as key city clusters.
However, recent satellite observations have shown that the haze coverage has already extended from one city cluster to two or three others (Tao et al., Citation2012). Using a regional chemical transport model and observations at two high-mountain stations, Wang et al. (Citation2006) and Li et al. (Citation2008) found that trans-boundary transport in YRD resulted in regional secondary pollution over YRD, SD, and HBP. Furthermore, Wang et al. (Citation2011) and Yang et al. (Citation2012) found clear trans-boundary transports between HBP and CL clusters during haze episodes. These studies indicate that control of emissions in one city cluster is not sufficient to reduce regional haze events, and joint efforts among city clusters are essential.
To study air-pollutant chemistry/transport in the YRD, HBP, SD, and CL city clusters, Peking University (PKU), the Chinese Research Academy of Environmental Sciences (CRAES) and the Institute of Atmospheric Physics, Chinese Academy of Sciences (IAP/CAS) conducted a field campaign (Campaign of Air Pollution at Typical Coastal Areas In Eastern China, CAPTAIN) at two remote/rural stations [Chaodao (120.7°E, 37.96°N, 0 m a.s.l.) and Hongze Lake (118.46°E, 33.33°N, 13 m a.s.l), shown in ] in March 25–April 15 2011. Two regional haze episodes covering HBP, SD, and CL city clusters were observed in which regional visibility decreased to 4–8 km and PM2.5 and PM10 concentrations exceeded 100 and 200 µg/m3 in both rural and urban regions. These episodes provided an excellent opportunity to investigate the effects of trans-city-cluster transport on the formation of regional haze in China.
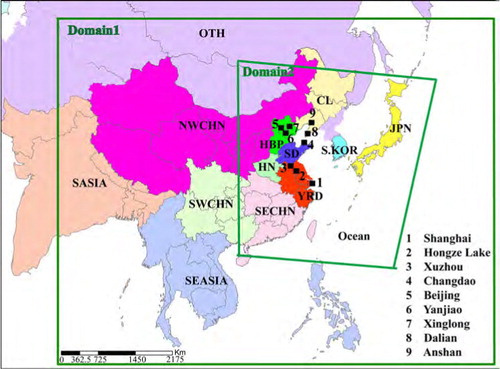
Fig. 1 Two nested model domain for NAQPMS used in this study. Also shown are regional separations for on-line tracer-tagged (capital characters) which are described in . The marked solid squares represent the locations of nine observation stations.
The goal of the present study was to quantify the effects of trans-city-cluster transport on regional haze episodes over the YRD, HBP, SD, and CL regions in a regional context. We utilised a regional chemical transport model (NAQPMS) with an on-line tracer-tagged module and evaluated its performance by comparison with metrological and chemical observations at urban, rural, and remote stations. In this paper, the description and validation of NAQPMS is presented in Sections 2 and 3. Section 4 provides quantitative estimations of contributions of trans-city-cluster transport to regional PM concentrations. The effects of trans-city-cluster transport on human health are estimated in Section 5.
2. Model and observations
2.1. Model description
Nested Air Quality Prediction Modeling System (NAQPMS) is a fully-modularised, three-dimensional regional Eulerian chemical transport model. The metrological fields were provided by the mesoscale meteorological model WRF-ARW 3.0. The physical and chemical evolution of reactive air pollutants (gaseous species, inorganic and organic anthropogenic and biogenic aerosols, sea salts and mineral dust) were reproduced by solving the mass balance equation in terrain-following coordinates (Li et al., Citation2007, Citation2008, Citation2011). The carbon-bond mechanism Z (CBM-Z) with 53 species and 133 reactions is implemented in the gas-chemistry section in NAQPMS (Zaveri and Peters, Citation1999). NAQPMS employs an aerosol thermodynamic model (ISORROPIAI1.7) to calculate the composition and phase state of an ammonia-sulfate-nitrate-chloride-sodium-water inorganic aerosol (Nenes et al., Citation1998). Six SOAs, of which two are from anthropogenic precursors (toluene and higher aromatics) and four are from biogenic precursors (monoterpene and isoprene), are explicitly treated. A modal representation is used to assign the size ranges of anthropogenic PM10 in this study, with two modes below 2.5 µm (Aitken and accumulation modes). Sea salt emissions ranging from 0.43 to 10 µm with four bins are calculated following Athanasopoulou et al. (Citation2008). A size-segregated dust deflation module (four bins in 0.43–10 µm) is applied to simulate long-range transport of Asian dust (Wang et al., Citation2000). The mixing process between aerosol and gaseous pollutants is also simulated by a heterogeneous chemistry module (Li et al., Citation2011).
A special feature of NAQPMS is the quantitative identification of the contribution from our defined pollutant production regions to the spatial distribution of air pollutant concentration during one simulation using an on-line tagged tracer module. In this module, pollutants are tagged by the geographical locations in which they are formed, and the contribution of each defined source region is strictly positive. This is different from the classic sensitivity approach in which the contribution of any source region is likely to be negative because of the non-linearity of chemistry. Grewe et al. (Citation2004) suggested that the tagged tracer approach is more appropriate for assessing the contribution of source regions. A detailed description can be found elsewhere (Li et al., Citation2008).
Referring to the locations of city clusters shown in Fig. S1 in the supplement, we tagged 14 aerosol production regions ( and ). As shown in , four city clusters (YRD, HBP, SD and CL) cover 55% of the national GDP and 38% of the national population with 16% of the national land. Their NOx emissions in 2007 reached 6.8 Tg/year, which accounted for 45% of total emissions in China. Among all city clusters, YRD has the greatest emission rate (2.7 Tg/year). The distance between the YRD and CL clusters is ~1000–2000 km, which indicates that the trans-boundary transport between them may have an impact on air quality in large areas in China.
Table 1 Tagged aerosol production regions in East Asiaa
2.2. Model setup
shows the model domain of the NAQPMS used in this study; it is composed of two nested domains. The coarse domain is divided into 97×77 horizontal grids with 80 km resolution, covering most of East Asia. The fine domain covers eastern China with 20 km resolution. The vertical grid structure consists of 20 layers from the surface to 20 km above sea level, with the lowest 10 layers below 2 km.
The latest anthropogenic emission inventory (fossil fuels, biofuels, industry, transportation, and power plants) (the year of 2007) was obtained from the bottom-up Regional Emission inventory in ASia (REAS 2.0) data with 0.25°×0.25° resolution (approximately 30×25 km in central eastern China) (Ohara et al., Citation2007). The biogenic emission inventory was from a biogenic emission model (Meganv2, 0.5°×0.5°, approximately 30×25 km in central eastern China) provided by NCAR (National Center for Atmospheric Research) within the framework of the ACCENT-GEIA data portal (http://accent.aero.jussieu.fr/database_table_inventories.php), which includes carbon monoxide, formaldehyde, alkanes, alkenes, aromatics, isoprene, and other volatile organic compounds (VOCs).
A 3-D simulation was conducted from 10 March to 10 April 2011. The first 15 d were regarded as the spin-up period to reduce the impact of initial conditions. The meteorological field was provided by the WRF-ARW3.0. The initial and lateral boundary conditions were provided by a global transport model (MOZART-V2.4) with 2.8° resolution.
2.3. Observations
In this study, observations at seven stations including two remote stations (Changdao and Xinglong), three rural stations (Shanghai, Hongze Lake, and Yanjiao) and two urban stations were collected (). PM2.5 observations at Hongze Lake and Changdao were made by Peking University, whose details about the procedures will be provided by Hu et al. (Citation2013). The Chinese Ecosystem Research Network (CERN), maintained by the Chinese Academy of Sciences (CAS), provided hourly PM2.5 observations at the Yanjiao and Xinglong stations (Ji et al., Citation2012). Hourly PM2.5 at Shanghai was provided by the local Environmental Monitoring Centre. Surface mass PM10 concentrations at two urban stations (Dalian and Anshan) were determined by the Chinese air pollution index (API), which is officially reported for the principal pollutants SO2, NO2 and PM10. A polynomial regression was used to derive the PM10 mass loading from the Chinese API as suggested by Lasserre et al. (Citation2008). The polynomial used is:1
3. Observations and model evaluation
presents the time series of observed and simulated hourly (or daily) PM2.5 (or PM10) from 25 March to 6 April 2011 at seven stations covering the YRD, SD, HBP, and CL city clusters. In general, the model satisfactorily reproduced the temporal variation of the hourly and daily mean concentrations with correlation coefficient ranging from 0.52 to 0.76 (). The simulated NMBs of 8–30% and NMEs of 23–65% met the criteria recommended by Boylan and Russell (Citation2006), where the values of NMB and NME for a good performance of particulate matter are ±60 and 75% when the observed concentrations are above 2.25 µg/m3. The simulated RMSEs (20–50 µg/m3) covered 30–75% of simulated mean PM10/PM2.5 concentrations, which were similar as simulated results of other models in Europe (15–20 µg/m3 and 90% of simulate mean PM10) (Basart et al., Citation2012).
Fig. 2 Time profile of the model simulated (black) and observed (red) hourly and daily PM10 (or PM2.5) during 25 March–7 April 2011 at Shanghai, Hongze Lake, Changdao, Xinglong, Yanjiao, Dalian and Anshan. Two high polluted cases (Case I and II) and one clear case (Case III) are marked by the semi-transparent shaded.
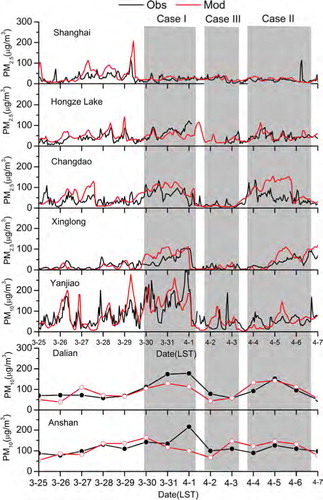
Table 2 Statistical summary of comparisons of simulated particulate matter with observationsa
In particular, two high-pollution episodes were reproduced well by the simulation. In 30–31 March (Case I), four city clusters covering 1000×1000 km2 experienced high particle-matter loadings at the same time. Both observed and simulated maxima of PM2.5 concentrations at Xinglong, Changdao, and Hongze Lake exceeded 70 µg/m3 (Nation Grade II). In 4–6 April (Case II), simulated aerosol concentrations were 50.3 (PM2.5, Hongze Lake), 84.3 (PM2.5, Changdao), 62.1 (PM2.5, Xinglong), 129.8 (PM10, Dalian,) and 138.1 µg/m3 (PM10, Anshan), which were close to observations (47.5, 49.7, 45.3, 113.3, 108.7, and 113.3 µg/m3, respectively). Importantly, high aerosol concentrations at Anshan, Dalian, Changdao, and Hongze Lake (4–5 April) were 1 d earlier than they were at Xinglong and Yanjiao (5–6 April). This pattern was reproduced by the simulation. The model also shows a good performance in clear conditions. The observed low PM concentrations in 1–3 April (Case III; 29.8, 17.4, 11.6, 38.9, 68 and 105µg/m3 at Hongze Lake, Changdao, Xinglong, Yanjiao, Dalian and Anshan, respectively) were reproduced by the simulated values of 28.3, 18.6, 7.7, 34.0, 50.9, and 83.6 µg/m3.
The good performance of the aerosol simulation is partly due to the successful simulation of the wind vectors, which enabled the model to reproduce the trans-city-cluster transport over eastern China. Figure S2 in the supplement shows the comparison between simulated and observed wind vectors at five stations during the study period. It is clear that the model captured the prevailing southerly winds during high-pollution episodes (Cases I and II) and northerly winds during the clear episode (Case III), notably the change of wind direction from northward to southward during the shift from Case I to Case III (1 April).
4. Simulated cross-border transport between city clusters
illustrates the contributions to PM2.5 from selected aerosol production regions at seven stations. Clearly, cross-city-cluster transports among different city clusters played a significant role in creating the regional high PM2.5 concentration (Cases I and II). From south to north, contributions of cross-border transport from outside city clusters presented an increasing trend. In Case I, PM10 regional transport from YRD, SD, and HBP reached 12.1, 17.3, and 18.6 µg/m3 at Anshan in the CL cluster. PM10 produced in the ocean (Bohai Bay, whose location is shown in ) contributed 14.6 µg/m3. The PM10 transported from outside city clusters at Anshan reached 62.6 µg/m3 (45.2%), which was almost equal to that from its own city cluster (CL) (65.8 µg/m3, 47.5%). In the HBP city cluster (Xinglong), cross-city-cluster transport of PM2.5 from YRD, HN, and SD reached Xinglong on 30–31 March and contributed 7.8 (10.6%), 5.0 (6.8%), and 9.3 µg/m3 (12.7%), respectively. In the SD city cluster (Changdao), the source region of cross-city-cluster transport was only the YRD city cluster, which is located on the south of SD. PM2.5 from YRD reached 18.6 µg/m3 (20.7%) at Changdao. In contrast with the CL, HBP, and SD clusters, the local cluster dominated PM2.5 levels in the north of the YRD cluster, with a contribution of more than 90%. This indicates that YRD was the source cluster of this cross-border episode.
Fig. 3 Time series of contributions (µg/m3) to surface PM10 at Anshan, Dalian and Yanjiao, and PM25 at Xinglong, Changdao, Hongze Lake and Shanghai from selected city clusters.
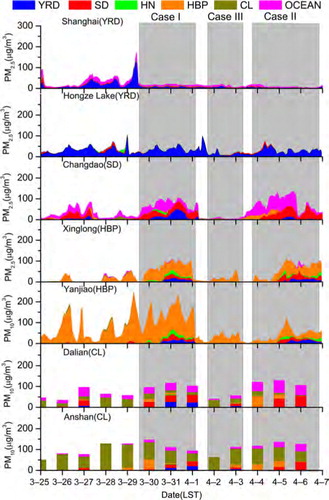
In Case II, cross-border transport from outside city clusters reached 69.5 (50.1%), 23.7 (38.2%), 8.2 (9.8%), and 3.2 µg/m3 (6.3%) at Anshan (PM10), Xinglong (PM2.5), Changdao (PM2.5) and Hongze Lake (PM2.5), respectively. This decreasing trend from north to south was similar to that in Case I.
To better understand the trans-boundary transport among the four city clusters, we selected Case III (1–3 April) as representative of a clear period, during most of which concentrations of hourly PM2.5 and PM10 at all stations were below 50 µg/m3 and 100 µg/m3, respectively. In contrast with high polluted episodes (Cases I and II), aerosols produced in local city clusters dominated the polluted levels at all stations in the clear case, indirectly suggesting an important role of cross-border transport in regional hazes over east China. The episode features in these cases will be discussed in detail in the following sections.
4.1. Case I (30–31 March)
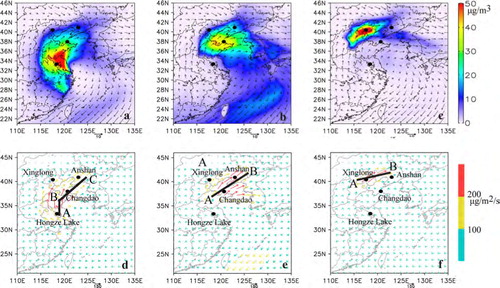
As shown in , four city clusters in east China experienced a significant cross-city-cluster transport of PM2.5 during 30–31 March. A strong southerly aerosol flux of 300–600 µg/m2/s appeared in highly polluted regions, which caused more aerosols produced in southern city clusters to be transported into their northern regions (d and e). presents the simulated spatial distributions of contributions to near-ground (below 1 km) PM2.5 in Case I from YRD, SD + OCEAN, and HBP and their transport fluxes. It can be found that pollutants produced in the YRD city cluster clearly covered all of eastern China, contributing 20–40 µg/m3, 10–20 µg/m3, and 10–20 µg/m3 to PM2.5 in the SD, HBP, and CL city clusters, respectively (a). Its transport pathway appeared along the YRD-SD-Bohai Bay-CL line, with a transport flux of 100–300 µg/m2/s (d). Hongze Lake (YRD), Changdao (SD) and Anshan (CL) are located along the major transport pathway as the starting, middle and stopping point, respectively. Contributions from SD and the ocean reached 10–50 µg/m3, covering the SD, HBP, and CL clusters (b). A strong northward transport flux appeared at Bohai Bay and the CL city cluster with a magnitude of 300 µg/m2/s (e). The regions impacted by HBP were only itself and the CL city cluster, in which its contribution ranged from 10 to 20 µg/m3 (c). The transport pathway lay to the north of the pathways of YRD and SD (f).
Fig. 4 Simulated spatial distributions of mean near-ground (<1.5 km) PM2.5 (µg/m3) and wind vectors (m/s, arrows) during a) Case I, b) Case II and c) Case III. Also shown are the transport fluxes of PM2.5 (µg/m2/s) during d) Case I, e) Case II and f) Case III. Locations of Anshan, Xinglong, Changdao and Hongze Lake are marked by the dark solid cycles.
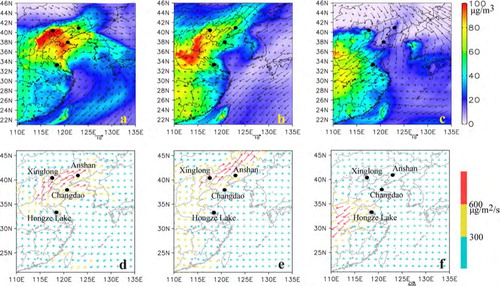
Fig. 5 Spatial distributions of contributions (shaded, µg/m3) to mean near-ground (<1.5 km) PM2.5 from a) YRD; b) SD + OCEAN and c) HBP in Case I. Also shown are the transport fluxes of these contributions d) YRD; e) SD + OCEAN and f) HBP. The thick black lines in d), e), and f) represents the transport pathways, and the capital letters ‘A’, ‘B’ and ‘C’ means the key points along the pathways. Locations of Anshan, Xinglong, Changdao and Hongze Lake are marked by the dark solid cycles.
It is noteworthy that mixing accumulation of pollutants from different city clusters appeared in the cross-border transport. When air masses left one city cluster, they continuously picked up pollutants in the next adjacent cluster. This could have led to the accumulation of pollutants as the air masses moved. So aerosol concentrations and transport fluxes in receptor regions (i.e. northern parts) were greater than in source regions (i.e. southern parts), as shown in d and e.
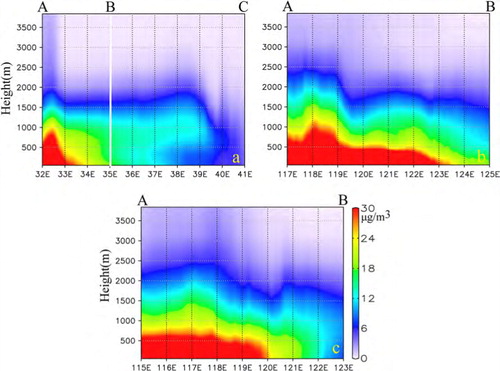
shows the vertical profile of PM2.5 produced in YRD, SD + Ocean and HBP along the transport pathway. The transport of PM2.5 from YRD, SD + Ocean was constrained in the near-ground atmosphere (below 0–1 km) (a and b). Different from the YRD and SD clusters (0–1 km), the impact of HBT on the CL city cluster was at 1–2 km (c). This simulated vertical structure of cross-border transport of PM2.5 were consistent with back trajectories calculated by Hybrid Single-Particle Lagrangian Integrated Trajectory (HYSPLITv4) model with an hourly output of 80 km from WRF-ARWv3.0, which indicated air masses arriving at four city clusters were in 0–2 km ().
Fig. 6 Vertical profiles of contributions (µg/m3) of regional transport from a) YRD; b) SD+OCEAN and c) HBP to PM2.5 along the transport pathway in Case I (shown in ). The capital letters ‘A’, ‘B’ and ‘C’ represent the locations of key points along the pathways shown in .
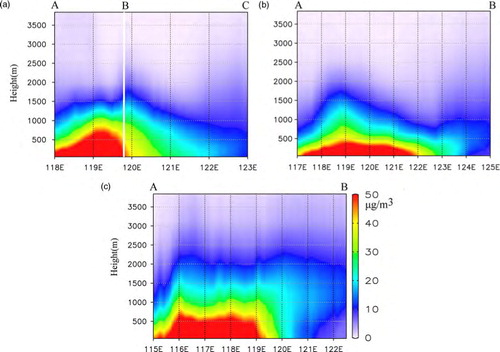
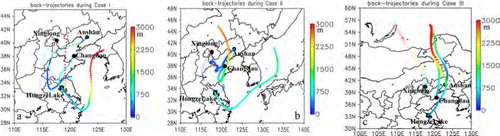
Fig. 7 Locations and height (meter, colors) above ground of 3-day back-trajectories initiated from at Anshan, Xinglong, Changdao and Hongze Lake at 100 m above ground level for the period (a) Case I, (b) II and (c) III. Two successive points represents a three hour interval. The four city clusters (CL, HBP, SD and YRD) are as explained in .
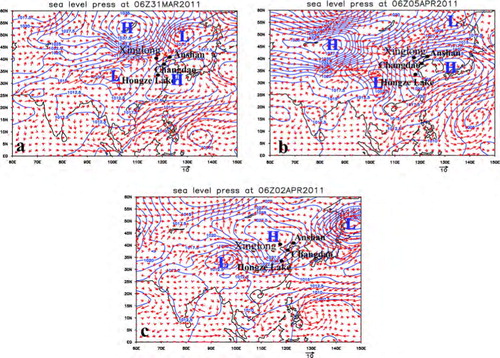
This cross-city clusters transport of PM2.5 from YRD to CL in Case I was related to the saddle filed in central north China (). As shown in a, a saddle field came into existence over the HBP and CL city clusters (110–130°E and 40°N), due to four clearly identifiable systems, namely, two high-pressure systems over Lake Baikal and the East China Sea and two low-pressure systems over north-eastern China and western China. In the saddle field, a weak southerly jet occurred on its southern side (SD and YRD), which was closely related to the anticyclone on the south side. The southerly jet brought pollutants to the YRD, SD, and HBP city clusters in the north and enabled the pollutants to accumulate easily on the south side of the saddle field. This provided particularly favorable conditions for the regional-scale haze over the four city clusters.
Fig. 8 Sea level pressure (hpa) (black contours) and wind vectors (m/s) (red arrows) during a) Case I; b) Case II and c) Case III. Also shown are locations of Anshan, Xinglong, Changdao and Hongze Lake stations. The character ‘H’ and ‘L’ represent the center of high pressure and low pressure systems, respectively.
4.2. Case II (4–6 April)
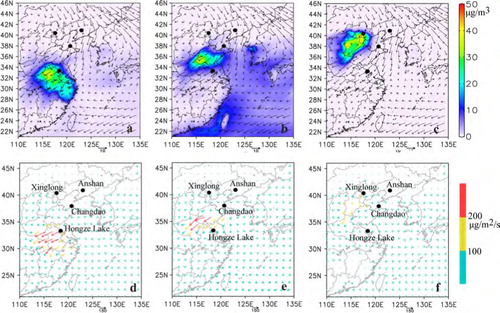
During 4–6 April, east China experienced a regional haze episode in which CL, HBP, SD, and north of YRD were covered air masses with high PM2.5 concentrations (60–100 µg/m3) (b). A northward transport flux extended from YRD to CL city clusters, with a magnitude of 300–600 µg/m2/s (e). The contributions from outside city clusters ranged from 6 to 50% at Anshan (CL), Xinglong (HBP), Changdao (SD), and Hongze Lake (YRD) (). A saddle field on the north of CL city (45–50°N) cluster was the major cause of cross-border transports. Similar as Case I, four city clusters (YRD, HBP, SD, and CL) lay in the south of saddle field, so southerly jet blow pollutants in southern city clusters northwardly (b). the simulated spatial distributions of contributions to near-ground (below 1 km) PM2.5 from YRD, SD + OCEAN, and HBP and their transport flux in this case. Compared with Case I, the transport pathway of pollutants produced in YRD moved westwardly to 115°N (HBP) from 120–125°N in Case I, which caused SD and CL city clusters to be beyond the impact region of YRD. Unlike YRD, PM2.5 produced in SD and HBP showed similar pathways as Case I. Vertically, the transport height upshifted from 0–1 km in Case I to 1–1.5 km in Case II after the pollutants left the YRD cluster (a). PM2.5 produced in SD and HBP were constrained in the boundary layer (below 2 m) (b and c).
Fig. 9 The same as , but for Case II.
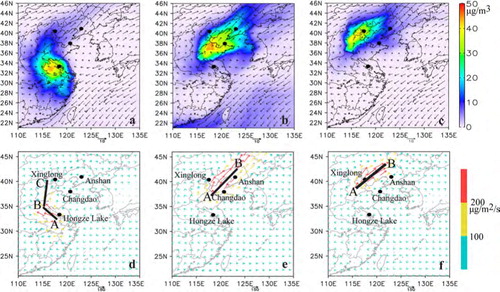
Fig. 10 The same as , but for Case II.
4.3. Case III (1–3 April)
Following Case I, aerosols in all four city clusters (CL, HBP, SD and YRD) kept a low level (below 50 µg/m3) during 1–3 April. In contrast with high polluted episodes (Cases I and II), aerosols in the four city clusters were carried away to the southwest by the northerly wind and kept a low transport flux in this case (f). Pollutants produced in each city cluster mostly constrained within its own cluster and the contributions from outside city clusters were within 15% ( and ).
Fig. 11 The same as , but for Case III.
The low aerosol transport flux was related to the synoptic condition. In this case, the saddle field in Case I has been destroyed, and the high-pressure system over Lake Baikal has moved to the HBP, SD, and YRD city clusters. Under the high-pressure system, strong northerly winds from eastern Siberia dominated over the four city clusters. Back-trajectory analysis shows that air parcels arriving at all sites tended to follow a path from eastern Siberia, where fewer sources are located (c). As a result, low aerosol levels would be expected in this case.
Finally, based on above analysis on two high polluted episodes and one clear episode, we may conclude that the northward cross-border transport significantly contributed to the region haze days in YRD, SD, HBP, and CL city clusters covering 1000×1000 m2. The CL and YRD city clusters were usually the receptor and source clusters, respectively. The SD and HBP clusters stayed on the transport pathway from YRD to CL, which suggests both could affect CL pollutants and be affected by YRD.
5. Implications of cross-border transport for human health
The adverse health effects of severe polluted episodes have been of interest since London 1952. Recent numerous works have confirmed the association between ambient aerosols and daily mortality outcomes. Under short and long term exposure, particular matters can increase mortality by its biological mechanism, impairment of lung defence and physiological disturbances of gas transfer (Katsouyanni et al., Citation1997). By analysing time series data on daily number of deaths from all causes and concentration of PM10 and potential confounders, Katsouyanni et al. (Citation1997) found an increase of 50 µg/m3 was associated with a 2% increase in daily mortality in Western Europe cities.
As shown in , the cross-border transport between city clusters contributed a lot to the regional high PM concentrations. At Anshan (CL), the PM10 contribution from outside city clusters reached 62.6 and 69.5 µg/m3 in Case I and II. This suggested that this cross-border transport caused a 2.5 and 2.8% increase of daily mortality if we used the relationship between PM10 and daily mortality in western Europe cities. At Xinglong (HBP), the PM2.5 contributions from outside city clusters were 22.1 and 23.7 µg/m3 in Case I and II, which increased 1.4 and 1.5% daily mortality (PM25 were converted to PM10 by the formula PM25=PM10×0.65). At Changdao (SD), the increase of daily mortality from transported PM10 exposure was 1.2 and 0.5% in Cases I and II, respectively.
This study finds that cross-city cluster transport have an unnegligible impact on human health over four city clusters. Therefore, joint controls in one city cluster in current system are not sufficient to reduce some certain regional haze episode, and more scientific studies on cross-city cluster transport in China are recommended.
6. Summary
In this study, effects of cross-border transport between city clusters in eastern China on regional haze episodes in spring 2011 was quantitatively investigated by the nested air quality prediction modelling system (NAQPMS) with an on-line tracer-tagged module. The major findings are summarised as follows:
The model was capable of reproducing the PM pattern in the four city clusters (YRD, SD, HBP, and CL) in east China during the study period with correlation coefficient ranging from 0.52 to 0.76. In particular, the model captured well two regional haze episodes on 30–31 March (Case I) and 4–6 April 2011 (Case II) and one clear case on 1–3 April 2011 (Case III).
The results of on-line tagged module implemented into NAQPMS indicated that the cross-city-cluster transport associated with a weak saddle field over 110–130°E and 40°N played a significant role in two high polluted cases over east China with high PM2.5 concentrations of 60–100 µg/m3. Usually, the YRD city cluster was the source, while the CL city cluster was the receptor. The SD and HBP clusters stayed on the transport pathway from YRD to CL. In Case I, cross-city-cluster transport from outside city clusters contributed 45% of PM10 and 30.1, 20.7 and 10% of PM2.5 to Anshan (CL), Xinglong (HBP), Changdao (SD) and Hongze Lake (YRD), respectively. In Case II, these contributions reached 50.1, 38.2, 9.8, and 6.3%. In both cases, contributions of cross-city-cluster transport from outside city clusters presented an increasing trend from south to north caused by the accumulation in various city clusters during the transport of pollutants. In contrast, the small amounts of transport in Case III resulted in a decrease of regional PM in eastern China.
The transport pathway of each individual city cluster was investigated in the simulation. In Case I, the northward transport pathway of pollutants produced in YRD appeared along the YRD-SD-Bohai Bay-CL line, with a transport flux of 100–300 µg/m2/s. Vertically, the transport was constrained in the near-ground atmosphere (below 1 km). PM2.5 in the SD cluster was transported to HBP and CL by passing over Bohai Bay in the atmosphere at 0–1 km. Unlike YRD and SD, the impact region of HBP was only the CL cluster, and the transport height upshifted to 1–2 km. In Case II, the impacts of YRD, SD, and HBP were weaker than they were in Case I. The transport pathway of YRD PM2.5 moved to the west of that in Case I. The transport height shifted from 0–1 km in Case I to 1–1.5 km in Case II after the air left the YRD cluster. The PM2.5 produced in SD and HBP showed similar pathways as Case I.
Finally, the effects of transported PM on human health were roughly estimated. The results showed cross-border transport of PM2.5 might increase 0.5–3% daily mortality during the high PM2.5 episodes, which inducted more effective control measures should be taken. Research to investigate seasonal cycles and interannual variability of cross-city-cluster transport among city clusters is being conducted and will be the subject of a future paper.
7. Supplement
Supplement 1 describes the spatial distribution of key city clusters in China determined by the General Office of the State Council of China Supplement 2 presents the observed and simulated surface wind vectors at five sites in four city clusters.
8. Acknowledgements
This work is funded by China Ministry of Environmental Protection's Special Funds for Scientific Research on Public Welfare (201009002), the CAS Strategic Priority Research Program (Grant Nos. XDB05030200 and XDA05100501) and NSFC (40805051).
Notes
Related Research Data
References
- Athanasopoulou E , Tombrou M , Pandis S. N , Russell A. G . The role of sea-salt emissions and heterogeneous chemistry in the air quality of polluted coastal areas. Atmos. Chem. Phys. 2008; 8: 5755–5769.
- Basart S , Pay M. T , Jorba O , Perez C , Jimenez-Guerrero P , co-authors . Aerosols in the CALIOPE air quality modelling system: evaluation and analysis of PM levels, optical depths and chemical composition over Europe. Atmos. Chem. Phys. 2012; 12: 3363–3392.
- Boylan J. W , Russell A. G . PM and light extinction model performance metrics, goals, and criteria for three-dimensional air quality models. Atmos. Environ. 2006; 40: 4946–4959.
- Ge B. Z , Xu X. B , Lin W. L , Li J , Wang Z. F . Impact of the regional transport of urban Beijing pollutants on downwind areas in summer: ozone production efficiency analysis. Tellus B. 2012; 64
- Grewe V . Technical note: a diagnostic for ozone contributions of various NOx emissions in multi-decadel chemistry-climate model simulations. Atmos. Chem. Phys. 2004; 4: 729–736.
- He K. B , Huo H , Zhang Q . Urban air pollution in China: current status, characteristics, and progress. Annu. Rev. Energy Env. 2002; 27: 397–431.
- Hu W. W , Hu M , Yuan B , Jimenez J. L , Tang Q , co-authors . Insights on organic aerosol aging and the influence of coal combustion at a regional receptor site of Central Eastern China. Atmos. Chem. Phys. Discuss. 2013; 13: 1–50.
- Ji D. S , Wang Y. S , Wang L. L , Chen L. F , Hu B , co-authors . Analysis of heavy pollution episodes in selected cities of northern China. Atmos. Environ. 2012; 50: 338–348.
- Juan, S. Census: Population hits 1.37b. China Daily-Europe, 29 April. 2011. [Online] Available at: http://europe.chinadaily.com.cn/china/2011-04/29/content_12418282.htm (Accessed: 30 April 2011).
- Katsouyanni K , Touloumi G , Spix C , Schwartz J , Balducci F , co-authors . Short term effects of ambient sulphur dioxide and particulate matter on mortality in 12 European cities: results from time series data from the APHEA project. Brit. Med. J. 1997; 314: 1658–1663.
- Lasserre F , Cautenet G , Bouet C , Dong X , Kim Y. J , co-authors . A model tool for assessing real-time mixing of mineral and anthropogenic pollutants in east Asia: a case study of April 2005. Atmos. Chem. Phys. 2008; 8: 3603–3622.
- Li J , Wang Z. F , Akimoto H , Gao C , Pochanart P , co-authors . Modeling study of ozone seasonal cycle in lower troposphere over east Asia. J. Geophys. Res-Atmos. 2007; 112: 22S25.
- Li J , Wang Z , Akimoto H , Yamaji K , Takigawa M , co-authors . Near-ground ozone source attributions and outflow in central eastern China during MTX2006. Atmos. Chem. Phys. 2008; 8: 7335–7351.
- Li J , Wang Z. F , Xiang W. L . Daytime atmospheric oxidation capacity of urban Beijing under polluted conditions during the 2008 Beijing olympic games and the impact of aerosols. Sola. 2011; 7: 73–76.
- Nenes A , Pandis S. N , Pilinis C . ISORROPIA: a new thermodynamic equilibrium model for multiphase multicomponent inorganic aerosols. Aquat. Geochem. 1998; 4: 123–152.
- Ohara T , Akimoto H , Kurokawa J , Horii N , Yamaji K , co-authors . An Asian emission inventory of anthropogenic emission sources for the period 1980–2020. Atmos. Chem. Phys. 2007; 7: 4419–4444.
- Tao M. H , Chen L. F , Su L , Tao J. H . Satellite observation of regional haze pollution over the north China plain. J. Geophys. Res. Atmos. 2012; 117
- Wang L. T , Hao J. M , He K. B , Wang S. X , Li J. H , co-authors . A modeling study of coarse particulate matter pollution in Beijing: regional source contributions and control implications for the 2008 summer olympics. J. Air Waste Manage. 2008; 58: 1057–1069.
- Wang T. J , Jiang F , Li S , Liu Q . Trends in air pollution during 1996–2003 and cross-border transport in city clusters over the Yangtze River Delta region of China. Terr. Atmos. Ocean. Sci. 2007; 18: 995–1009.
- Wang X. Q , Yang T , Wang Z. F . Impact of dust-haze episode from one air pollution control region to the other-one case study (in Chinese). Climatic Environ. Res. 2011; 16: 690–696.
- Wang Z. F , Li J , Wang X. Q , Pochanart P , Akimoto H . Modeling of regional high ozone episode observed at two mountain sites (Mt. Tai and Huang) in east China. J. Atmos. Chem. 2006; 55: 253–272.
- Wang Z. F , Ueda H , Huang M. Y . A deflation module for use in modeling long-range transport of yellow sand over East Asia. J. Geophys. Res. Atmos. 2000; 105: 26947–26959.
- Yang T , Wang X. Q , Wang Z. F , Sun Y. L , Zhang W , co-authors . Gravity-current driven transport of haze from north China plain to northeast China in winter 2010-part I: observations. Sola. 2012; 8: 13–16.
- Zaveri R. A , Peters L. K . A new lumped structure photochemical mechanism for large-scale applications. J. Geophys. Res. Atmos. 1999; 104: 30387–30415.
- Zhang X. Y , Wang Y. Q , Niu T , Zhang X. C , Gong S. L , co-authors . Atmospheric aerosol compositions in China: spatial/temporal variability, chemical signature, regional haze distribution and comparisons with global aerosols. Atmos. Chem. Phys. 2012; 12: 779–799.