Abstract
The present study covers more than 5 yr corresponding to more than 40 000 hours of particle and gas data measured at the Siberian tall tower Zotino Tall Tower (ZOTTO) (60.8°N; 89.35°E). Extrapolated along 10-d back trajectories, the ZOTTO measurements cover large parts of the Eurasian land mass. Mapping the extrapolated ZOTTO data points to major anthropogenic source regions and Siberian fire regions, consistent with emission data for CO and vegetation fires. Middle East mid-latitude sources stand out strongly and possibly emissions from Northern China may be seen at times from ZOTTO. The maps of measured light scattering and absorption characteristics support the interpretation of different source types. Three clusters of substantially different submicrometer particle size distributions were found, the maps of which also could be related to major aerosol source regions.
1. Introduction
Siberia is one of the hot spots of climate change in the Earth system (Steffen et al., Citation2004). The enormous Siberian forest ecosystem is globally relevant for the atmospheric budget of carbonaceous greenhouse gases (amongst others, CO2 and CH4) (Schulze et al., Citation1999; Lloyd et al., Citation2002). Besides its wetlands (Worthy et al., Citation2000), the large Siberian permafrost regions are high-risk areas in the global climate system (Zimov et al., Citation2006). The large boreal forests are also an important source of biogenic volatile organic gases (Rinne et al., Citation2009; Timkovsky et al., Citation2010), which are connected with the formation of natural aerosol particles over the forests (Tunved et al., Citation2006; Dal Maso et al., Citation2008). Every year, extensive forest fires occur in Siberia, the smoke of which is distributed globally (e.g. Mattis et al., Citation2003; Müller et al., Citation2005).
The atmospheric aerosol is an essential driver of Earth's climate system (IPCC, Citation2007), and it poses one of the biggest challenges to climate science (e.g. Heintzenberg, Citation2012). The scarcity of aerosol data over Siberia and the urgent need for more comprehensive regional aerosol information had been recognised in the planning of the Siberian Zotino Tall Tower (ZOTTO) research facility (Heimann, Citation2008) and was underlined in the recent review by Kulmala et al. (Citation2011). The aerosol issue over Siberia is complicated by the fact that – despite its remote location in the north-easterly corner of the Eurasian continent – simple air mass statistics over ZOTTO have shown that air arriving over the ZOTTO tower may come from large parts of Russia, Republic of Kazakhstan and Eastern Europe (Heintzenberg et al., Citation2008).
Consequently, starting in September 2006, aerosol measurements have been taken from the 300 m high tower at ZOTTO at 60.8°N; 89.35°E. The tower lies about 20 km west of the Yenisey river in a vast region of forests and bogs, still relatively undisturbed by anthropogenic influences and rather inhospitable because of its pronounced continental climate. Kozlova et al. (Citation2008) give a detailed description of the facility. The representativeness of the ZOTTO facility and first overviews and analyses of the data have been reported by Heintzenberg et al. (Citation2008) and Heintzenberg and Birmili (Citation2010). Particle number size distributions and particulate light absorption for the period 2006–2009 have been analyzed in Heintzenberg et al. (Citation2011a). The present study extends the data set by two more years until the beginning of 2012. We now substantiate the indication in Heintzenberg et al. (Citation2008) that the air from large parts of Eurasia could be monitored from the ZOTTO tower by connecting hourly back trajectories to related particle and gas data taken at ZOTTO for a period of more than 5 yr aimed at mapping the aerosol over much of Eurasia. The resulting maps cover integral particle parameters such as total number (and partial integrals over the particle number size distribution), surface, volume concentrations, and scattering and absorption coefficients. Heintzenberg et al. (Citation2011a) performed a cluster analysis of back trajectories and vertical profiles of the pseudo-potential temperature yielding clusters with different levels of particle number concentration. For the larger present data set we followed the opposite approach. After clustering the number size distributions into three groups, these clusters were connected to back trajectories yielding maps of dominant shapes of size distributions.
2. Methods and data
As all instrumental details have been given in the previous article (Heintzenberg et al., Citation2011a) we restrict the information here to major features of the experimental setup. The air samples discussed in the present article have been taken from the 300 m inlet at the ZOTTO tower. The details of the setup as well as the inlet calibration for particle losses are described in a technical article (Birmili et al., Citation2007) and in Heintzenberg et al. (Citation2008). Particles with diameter (D p ) >50 nm and smaller than 800 nm are nearly perfectly transmitted through the pipe, and 10 nm particles are transmitted with an efficiency of 20%. Here transmission-corrected particle size distributions from 12.6 to 835 nm were utilised.
A differential mobility particle sizer (DMPS) at about 6-minute intervals counts aerosol particle number size distributions in 19 logarithmically equal size bins. After inversion of the mobility distributions according to Stratmann and Wiedensohler (Citation1996), the number size distributions were corrected for transmission losses with the inlet calibration described in Birmili et al. (Citation2007) and averaged over 1-hour periods.
From the number size distributions, several integral parameters were calculated for our mapping purposes: total number concentration (NTO, cm−3); number concentration below 26 nm (N26, cm−3), between 26 and 80 nm (NAI for number of Aitken particles in cm−3), between 80 and 835 nm (NAC for number of accumulation mode particles in cm−3); total surface (STO, µm2 cm−3); and total volume concentration (VTO, µm3 cm−3), for the latter two parameters assuming spherical particles.
Aerosol light scattering was measured with a three-wavelength TSI 3563 integrating nephelometer (TSI, St. Paul, MN, USA). Of the six measured channels, we utilise here particulate scattering coefficients (NEP; Mm−1) at 550 nm wavelength. The instrument is described in detail by Anderson et al. (Citation1996) and Anderson and Ogren (Citation1998). At the ZOTTO site, the nephelometer is working with a flow rate of 10 L/min. Calibration is carried out by using CO2 as high span gas and filtered air as low span gas. The averaging time was set to 300 seconds. The zero-signal is measured once every 2 hours using filtered ambient air. For 300 seconds averages the detection limit, which is defined as a signal-to-noise ratio of two, for scattering coefficients are 0.17 Mm−1. To correct for errors resulting from the illumination geometry, a truncation correction is applied to the measured values, which accounts both for the lack of illumination at extreme angles (near 0° and 180°) and for the slightly non-sinusoidal illumination function of the light source. Since submicrometer particles dominate scattering at our site due to intake selectivity, the submicrometer corrections presented in Table 4 of Anderson and Ogren (Citation1998) are used for the truncation corrections to the nephelometer in this study. Bond et al. (Citation2009) suggest that the Anderson and Ogren (Citation1998) correction is accurate to within 2% for a wide range of atmospheric aerosols, but that the error could be as high as 5% for highly absorbing aerosols.
With a single-wavelength Particle/Soot Absorption Photometer (PSAP; Radiance Research, Seattle, USA) particulate light absorption (PSA; Mm−1) was measured at a wavelength of 574 nm. This method is based on the integrating plate technique, in which the change in optical transmission through a filter caused by particle deposition on the filter is related to the light absorption coefficient of the deposited particles. The measurements were corrected by the method published by Virkkula et al. (Citation2005) for a single-wavelength PSAP. The minimum detection limit of the PSAP was estimated to be 0.025 Mm−1 for hourly average data, based on two times the standard deviation of 1-minute noise (with 60 seconds cycle time) reported in Virkkula et al. (Citation2005) and adjusting for our longer averaging time. The scattering coefficients measured by the integrating nephelometer were combined with the PSAP data yielding an estimate of dry particle single scattering albedo (SSA)=NEP/(NEP+PSA) in the mid-visible wavelength region.
CO mixing ratios were measured by UV resonance fluorescence, using a Fast-CO-Monitor (Model AL 5002, Aerolaser GmbH, Germany). Prior to the measurement, the air was dried using a Nafion drier. Automated periodic zero and span calibrations were made to account for instrumental drift. The original CO data, measured with a frequency of 3 seconds, was converted to 1-hour averages termed COM (ppb).
Maintaining state-of-the-art atmospheric instrumentation at a remote Siberian site poses major technical and logistic challenges. During the presently evaluated time period these problems resulted in the following longer downtimes of our instruments given as Year-Month(s) during most of which no data are available: DMPS: 2006-12, 2007-01, 2007-06, 2010-02 through 2010-09; Nephelometer: 2006-09, 2007-06; CO: 2007-02 through 2007-04, 2007-06, 2007-09 through 2008-01, 2008-06 through 2009-09, 2010-12 through 2011-03, 2011-07 through 2011-12. Unfortunately the DMPS downtimes include the time period with widespread peat fires in Russia in summer 2010. In the present study all instrumental records end by the end of February 2012.
Fortunately, the downtimes of the different instruments did not always coincide. Consequently, in order to increase the geographic coverage the following relative sum variable (SU4) was formed. For that purpose the hourly averages of STO, NEP, PSA and COM were normalised by dividing the individual values by their respective grand arithmetic averages taken over the whole time period 2006 until February 2012, yielding the normalised parameters . Then for each hour of operation an average was formed of the available values of
. The resulting average dimensionless parameter SU4 thus comprised information from one to four of the ZOTTO instruments relative to their respective grand average. Replacing
by total number
or volume
in the average relative parameter SU4 (not shown here) gave practically the same results. Formation and evaluation of the relative SU4 parameter increased the number of hourly records from 32 626 to 44 059.
3. Ancillary data and methods
3.1. Aerosol mapping
For our mapping purposes, three-dimensional back trajectories ending at 300 m over ZOTTO (corresponding to the sampling height at the top of the tower) were calculated with the HYSPLIT model (Draxler and Hess, Citation1997; http://ready.arl.noaa.gov/HYSPLIT.php). For every hour with any measured data these back trajectories were calculated 10 d back in time. The input data for the trajectory calculations is based on the Global Data Analysis System (GDAS; http://www.arl.noaa.gov/gdas.php) that provides the assimilated observational data for the initialisation of weather forecast models run by the National Centre for Environmental Prediction (NCEP). The utilised dataset gdas1 (http://ready.arl.noaa.gov/gdas1.php) has a horizontal resolution of 1°, a vertical resolution of 25 layers, and a temporal resolution of 3 hours.
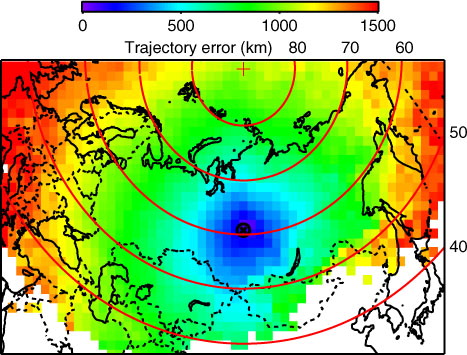
It is well known that the uncertainty in trajectory position increases with calculated travel time (or distance). In the review by Stohl (Citation1998) the author gives a typical figure of 20% of the distance travelled for trajectories computed from analyzed wind fields and cites slightly smaller errors for trajectories calculated from high-quality analysis fields in data-rich regions. We consider the continental regions of the former Soviet Union and Europe as such data-rich regions and adopt a 20% value for the present study. The trajectories were mapped on an x-y-grid of a stereographic projection of Eurasia and adjacent regions with ZOTTO being the pole of the projection according to formulae given in Snyder (Citation1987). For a total of 45 511 back trajectories, hourly data were available from at least one of the four instruments. Data from all four instruments were available for 14 303 hours. The measured data were then extrapolated along the trajectories and average values were calculated in each of the geographic grid boxes similar to the approach described in Heintzenberg et al. (Citation2011b). The maps of average cell values were plotted with the software IGOR 6.2 (Wavemetrics, Inc. Lake Oswego, OR, USA). Only grid cells with at least 25 extrapolated data points were evaluated. If we neglect meteorological persistence and apply Poisson statistics to the trajectory distribution over our grid cells, 25 cases per cell would correspond to a 20% Poisson error. We combined this Poisson cell statistics with the uncertainty in trajectory distance. For each time step of each trajectory a 20% distance uncertainty in kilometres was calculated and distributed over the geographical x-y-grid. shows average distance uncertainties in each grid cell that has at least 25 cases. For this figure, all 54 988 hourly back trajectories from 24 September 2006 until the end of December 2012 were utilised, irrespective of the availability of measured data. Average trajectory uncertainties increase from zero to 1500 km and larger at the western and eastern rims of the geo-grid. Towards south and southwest and towards the North Pole uncertainties stay mostly below 1000 km or even below 500 km, indicating relatively short trajectories in the northern and southern sectors about ZOTTO.
Fig. 1 Average geographical distribution of uncertainties in km of 54 988 10-d back trajectories starting at 300 m of the ZOTTO facility (89.35E, 60.8N), marked with the symbol cross in circle. National boundaries are drawn as thin dotted lines. Only grid cells with at least 25 cases are shown. Parallels and North Pole are drawn in red.
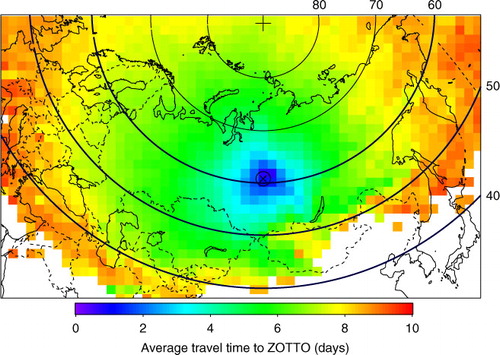
For the interpretation of trajectory-extrapolated aerosol data, the travel time to the receptor site is an essential parameter. Thus, gives average travel times in days to ZOTTO based on statistics of all 54 988 hourly back trajectories. For most of Russia, Republic of Kazakhstan, Eastern Europe and up to the North Pole travel times stay below a week. However, Western Europe, the Middle- and Far East, including easternmost parts of Siberia are only touched after about 10 d.
Fig. 2 Average geographical distribution of travel times to ZOTTO in days of 54 988 10-d back trajectories starting at 300 m of the ZOTTO facility (89.35E, 60.8N), marked with the symbol cross in circle. National boundaries are drawn as thin dotted lines. Only grid cells with at least 25 cases are shown. Parallels and North Pole are drawn in red.
3.2. Clustering of size distributions
A clustering algorithm was programmed in Fortran similar to the k-means methods described in Hartigan and Wong (Citation1979) and Jain et al. (Citation1999). Charron et al. (Citation2008) applied this method to rural particle size distributions. For the clustering the measured size distributions were normalised by their respective total numbers. Then a given number of clusters were searched for under the conditions: a) a given minimum number of cluster members, and b) an upper limit of the chi-squared goodness-of-fit of the cluster members to their respective cluster average.
The choice of parameters constraining the similarity of relative number size distributions in the clustering algorithm is arbitrary. With loose constraints all records easily could be grouped in a few clusters, maximising representativeness. However, the resulting high variability within each group would make the groups hard to distinguish in terms of statistics and aerosol physics and geographical distribution. Extremely tight constraints on the other hand only would leave a few members with very high similarity in each of the many clusters that could be distinguished, thus minimising representativeness. In particular over the very data-sparse Siberian region such very specific small cluster would be hard to evaluate. For the relatively narrow range of diameters of the measured size distributions three clusters were considered appropriate to cover three extreme cases:
Centred broad single mode distribution.
Major mode near lower end of diameter range.
Major mode near upper end of diameter range. The geographic distribution of these clusters will be discussed in section 4.2.
3.3. Emission and population data
For the interpretation of the aerosol and gas maps emission data were utilised from two databases. From the EDGAR database (EC-JRC/PBL. EDGAR version 4.2. http://edgar.jrc.ec.europa.eu/, 2011) we derived CO-emissions for the year 2008 in terms of kg of CO from combustion sources per year in 0.1×0.1 degree grid cells. Fire emissions in terms of grams of PM2.5 per month and 0.5×0.5 degree cells were taken from the GFED 3.1 database (http://www.globalfiredata.org/Data/index.html) for the years 2006 through 2011 (Mu et al., Citation2011).
As indicators of major anthropogenic emission centres symbols of cities were plotted on the maps. Cities with populations estimated for 2012 of 100 000 and more were taken from http://www.tageo.com/index.html. In order to indicate the size of the cities the area of their disc symbols on the maps was increased in proportion to their population relative to the disc size for a population of 100 000.
4. Results and discussion
Before presenting maps of trajectory-extrapolated data some general remarks and caveats are appropriate. In the planetary boundary layer, Jaenicke (Citation1988) gives atmospheric residence times of submicrometer aerosol particles increasing from 0.4 d at 10 nm to 7 d at 100 nm and 8 d at 835 nm. This estimate assumes a residence time due to wet removal of 8 d. Consequently, we cannot assume any trajectory-extrapolated sub-one-hundred nanometer aerosol data to be derived as particles from regions from which travel times are a week or longer. We explored the issue of potential wet removal by utilising the precipitation that HYSPLIT calculates along the trajectories. Statistics of this precipitation along all studied trajectories west of ZOTTO shows that most of the precipitation occurred more than 3000 km upwind of ZOTTO. On average 50% of the precipitation along these trajectories is accumulated beyond 5000 km upwind, which we take as indicating a decreasing wet scavenging in moist marine air masses on their way over Eurasia. Consequently, we expect that wet particle scavenging mostly took place over Eastern Europe or beyond that distance from ZOTTO.
As indicates positioning errors in geocells over Europe, the Near East and the Pacific Rim can be up to 1500 km. Thus, we will not claim to pinpoint specific parts of these distant source regions. Interestingly, travel times are relatively short southwest to south of ZOTTO, reducing positioning errors to less than 1000 km in related source regions. What does it mean then if high concentrations show up in specific geocells over pollution source regions from which average travel times to ZOTTO are longer than a week? We offer the following explanation. On one hand, in principle, back trajectories spread out over ever-increasing numbers of geocells with increasing distance from the receptor point. This means that very distant geocells represent relatively few measured data. On the other hand, all trajectories end at the receptor point, that is, with decreasing distance to the receptor point ever more trajectories pass through geocells levelling out much of the temporal variability of the measured data. If very distant geocells show high concentrations of extrapolated data, we interpret this finding with air coming from very far away in the rough direction of the related geocells being highly polluted. The aerosol particles that we analyze in such cases may have formed in this polluted air during air mass transport to ZOTTO. The low concentrations extrapolated to geocells in the inner Arctic (cf. , bottom, and 4, top) demonstrate that the methodology per se does not generate artefact high concentrations in all extremely distant geocells.
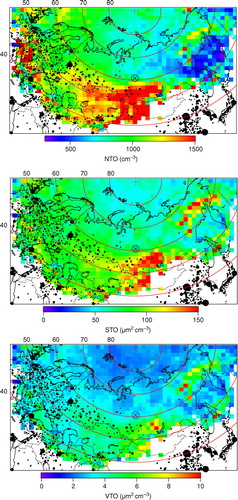
Fig. 3 Average trajectory-extrapolated distribution of total number (top, NTO, cm−3), total surface (centre, STO, µm2 cm−3) and total volume (bottom, VTO, µm3 cm−3) measured at ZOTTO 2006–2012. Values larger than the scale top are plotted in red. ZOTTO is marked as red symbol on the map. Cities with populations of 100 000 and larger are drawn as black discs, the areas of which are scaled in proportion to their population relative to 100 000.
4.1. Integral parameters
Total number (NTO), particulate surface (STO) and volume (VTO) are the basic integral parameters of the particle size distributions. Their maps of average trajectory-extrapolated values for the time period 2006–2012 are plotted in . The geographic patterns of the three parameters show strong similarities but also distinct differences. As far as the trajectories reach, the main Eurasian anthropogenic mid-latitude source regions are visible in the maps. Two main belts of high concentrations can be distinguished (most clearly in NTO), the most distant reaching around 40N from Western Europe to South Asia. The other one is located mainly north of 50N and most strongly is expressed within Russia. Within Russia, this distribution largely reflects the urban emission centres as shown, for example, in of Bityukova and Kasimov (Citation2012). For meteorological and geographic reasons the trajectories do not reach into the highly polluted northeastern Asian region. However, the trajectory ending closest to this region carries very high values of particle number, surface and volume.
Whereas much of Siberia and adjacent Arctic show lowest concentrations, there is a Siberian region east of ZOTTO and north of 60N that shows areas of high particle concentrations, in particular in STO. As there are no larger anthropogenic aerosol sources in this region other sources are more likely. The fire emission data of GFED have their boreal maxima in just that area between 90E and 160E, and 60N to 70N.
As all aerosol data have been measured at ZOTTO, it may seem counterintuitive to find the highest concentrations far away from the receptor point. This is simply due to the grid cell nearest ZOTTO attaining grand average concentration values whereas distant points on the maps are controlled by less data points with widely varying back trajectory paths leading from ZOTTO to them.
The maps of the fractional number integrals N26, NAI and NAC presented in basically show similar geographic patterns as in . As discussed in the introductory remarks to this section, the most distant high concentration regions in the map of N26 over Europe most likely do not reflect sources of N26 directly but of their precursor gases. The smaller area with high N26 values south of ZOTTO with high N26 vales may be close enough to the receptor point to bring regionally produced ultrafine particles to ZOTTO.
Fig. 4 As but for number concentration of particles <26 nm (top, N26, cm−3), between 26 and 80 nm (center, NAI, cm−3), and larger than 80 nm (bottom, NAC, cm−3) measured at ZOTTO 2006–2012.
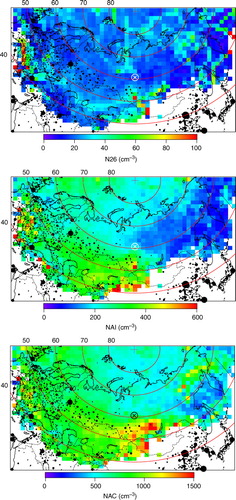
NAI can be interpreted as representing particles with longest atmospheric residence times. Consequently, we see a rather homogeneous map of NAI in . Again, in the map of NAC, the trajectory-extrapolated values strongly point towards a substantial European through Middle East source region, whereas Eastern Siberia in general shows rather low concentrations of accumulation mode particles.
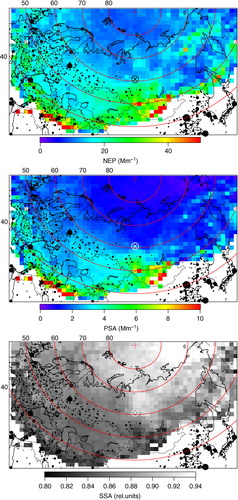
In the map of light scattering coefficients (NEP) in , the East Siberian source region shows up as in NAI and, more weakly, in NTO, together with Northern China and the Middle East. In the geographic distribution of the light absorption coefficient (PSA) and of the SSA in , the East Siberian source region does not stand out as strongly as in light scattering. Different source types emit particles with different SSA. Low temperature vegetation fires emit particles with low absorption and high scattering (Eck et al., Citation2009; Gyawali et al., Citation2009; Kondo et al., Citation2011), such as seen in aerosol data from Eastern Siberia as opposed to high temperature combustion sources with higher black carbon content (cf. Bond and Bergstrom, Citation2006) in the Middle East and China. Kozlov et al. (Citation2008) found similar results in Siberian smoke samples.
Fig. 5 As but for scattering coefficients at 550 nm wavelength (top, NEP, Mm−1), absorption coefficients at 574 nm wavelength (centre, PSA, Mm−1), and single scattering albedo (bottom, SSA) measured at ZOTTO 2006–2012.
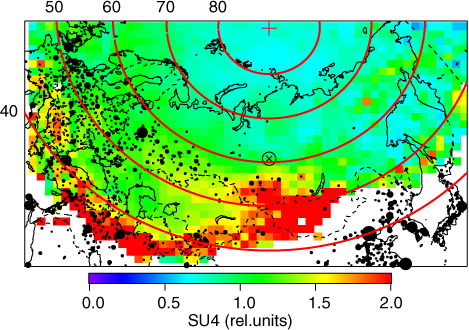
In , a map of the SU4 parameter introduced in section 2 is displayed. Because of complementary time series, the combination of DMPS, nephelometer, absorption and CO data yields the highest map coverage with trajectory-extrapolated data, that is, 45 511 hours of data instead of the 14 303 hours during which all four instruments were operational. plainly shows the distant major Eurasian source regions that have been discussed above. Interestingly, the Middle-East sources stand out more strongly than Europe. This may be due to the shorter travel times to ZOTTO and resulting smaller positioning uncertainties (cf. and 2). At the same time clearly indicates the least polluted sector northwest through northeast of the station.
Fig. 6 As but for the relative parameter SU4 formed from normalised measured data of NTO, NEP, PSA and COM (cf. section 2 for details).
The geographic distribution of CO emissions (not shown graphically) follows the distribution of larger cities in Europe, Middle East and Eastern Asia. Thus, the cities as plotted on the maps give a good indication as to where largest anthropogenic combustion regions are located. The average vegetation fire emissions in terms of PM2.5 clearly coincide with the Eastern Siberian source region that we see at ZOTTO in many measured parameters.
4.2. Particle size distribution
With the clustering algorithm the three major groups of number size distributions plotted on relative and absolute scales in were found. The error bars on the relative group-average size distributions and the shaded areas about the absolute group averages represent the standard deviations within each group. Group 1 has a symmetrical shape with single mode at 103 nm. Group 2 has a single broad mode at 64 nm with a steep concentration decrease towards smaller and a slow decrease towards larger diameters. Group 3 has a single mode around 160 nm and a shape that mirrors that of group 2. Group 1 comprises more than 5500 hours of measurements whereas groups two and three cover more than 3200 hours each (cf. ). Together the three groups comprise 37% of the total number of records (hours).
Fig. 7 Average relative (top) and absolute (bottom) number size distributions of three clusters (G1–G3) of ZOTTO size distributions. Error bars indicate the standard deviations of the relative group averages. Shaded areas in the colour of the averages indicate the ranges of one standard deviation about the absolute averages plotted as thick lines.
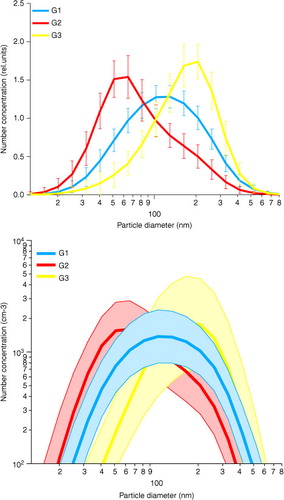
Table 1. Average integral properties of the three clusters of number size distributions: total number (NTO, cm−3), total surface (STO, µm2 cm−3), total volume (VTO, µm3 cm−3), light scattering coefficient (NEP, Mm−1), absorption coefficient (PSA, Mm−1), CO concentration (COM, ppb) and single scattering albedo (SSA)
As characteristics of the groups, the average integral parameters NTO, STO, VTO, NEP, PSA, COM and SSA are compared to their grand average values (GA) in . In Group 1 all integral parameters except SSA are raised above their grand average values. The most frequent month December of this group clearly indicates a winter-type aerosol. Group2 contains records with predominantly smaller particles with the second highest total number. Consequently, surface, volume, and light scattering and absorption are lower than grand average.
Interestingly, Group 3 is the only one with its most frequent month of occurrence in summer (July). Surface, volume and light scattering are about twice as high as grand average. Even light absorption is raised though SSA shows the highest average value as compared to the other groups, and highest average CO concentrations occurred.
Mapping the geographic distribution of occurrence of the clusters should shed some light on the cause of their characteristics. However, we need to keep in mind that the shape of the particle size distribution and many of its integral characteristics are not conservative properties that are maintained from particle source regions to receptor sites. After several days of travel aerosol dynamics, secondary particle formation and elimination processes are expected to have substantial effects on the measured aerosol properties.
Nevertheless we present in maps of occurrences (%) of the three groups of number size distributions shown in . Each geo-cell is covered with at least 25 trajectory points. Obviously the geographic distribution of clusters is not random. The most frequent Group 1 is dominating the heavily polluted eastern European, Russian and Middle East areas with a high-percentage tongue towards China. This distribution of Group 1 is consistent with its characteristics in . The single broad mode of Group 1 around 100 nm indicates a well-aged pollution aerosol in which coagulation and sedimentation have eliminated both tails towards smaller and larger particles (cf. Jaenicke, Citation1988), with diameters in the so-called Greenfield gap (Greenfield, Citation1957) remaining.
Fig. 8 Maps of occurrences (%) of the three groups of number size distributions shown in , top: group 1, centre: group 2, bottom: group 3. ZOTTO is marked as red symbol on the maps. Cities with populations of 100 000 and larger are drawn as black discs, the areas of which are scaled in proportion to their population relative to 100 000.
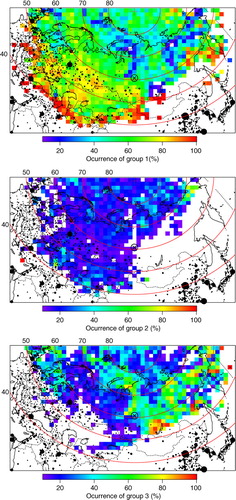
With significantly lower percentages, Group 2 is distributed more evenly over Eurasia, excluding the sector south through east of ZOTTO. Its dominating small sizes with low concentrations above 100 nm may indicate an aerosol from secondary gas phase processes that has not been through many cloud passages, that is, that has not acquired a so called Hoppel minimum (Hoppel et al., Citation1986).
Group 3 finally has regions of frequent occurrence southeast, east and north of ZOTTO, all mostly in low population areas. To a large extent, however, the high percentages of Group 3 coincide with the Siberian region of high fire emissions, (cf. –5). The high scattering and low absorption connected with this group, (cf. ), also is consistent with the interpretation of integral aerosol parameters for this region stated in section 4.1.
5. Conclusions
The large Siberian forest area is one of the key areas of the Earth system, in which global warming is expected to have dramatic consequences (Steffen et al., Citation2004; IPCC, Citation2007). Nevertheless, the coverage of Siberia with climate related data is very incomplete (Kulmala et al., Citation2011). With more than 5 yr corresponding to more than 40 000 hours of data measured at the ZOTTO tall tower (60.8°N; 89.35°E) and extrapolated along 10-d back trajectories the present study increases the data coverage substantially in time and space. Mapping the extrapolated ZOTTO aerosol data points towards major anthropogenic source regions and Siberian fire regions, consistent with emission data for CO and vegetation fires. Middle East mid-latitude sources stand out strongly and even emissions from Northern China may be seen at times ZOTTO. The maps of measured light scattering and absorption characteristics support the interpretation of different source types. Three clusters of substantially different submicrometer particle size distributions were identified in the data set. The most frequent Group 1 with a broad mode around 100 nm dominates the sector towards the major anthropogenic source regions from south of ZOTTO through west of the station. Group 2 with a mode around 50 nm is found in all regions except for the sector from south of ZOTTO through east. Finally, Group 3 with an accumulation mode around 200 nm covers the Siberian region of frequent forest fires from north of the station through east.
6. Acknowledgments
The ZOTTO facility was established after many years of preparatory fieldwork, planning and massive investments by the Max Planck Society in particular by the Max Planck Institute for Biogeochemistry in Jena. We thank Martin Heimann (MPI Biogeochemistry), A. A. Onuchin and S. Verchovetz (V.N. Sukachev Institute of Forest) for their contributions to the establishment and management of ZOTTO and A. Panov, A. Tsukanov (V.N. Sukachev Institute of Forest) and N. Jürgens (MPI Chemistry) for technical support. The ZOTTO project is funded by the Max Plank Society through the International Science and Technology Centre (ISTC) partner project #2757p within the framework of the proposal ‘Observing and Understanding Biogeochemical Responses to Rapid Climate Changes in Eurasia,’ and by the German Research Council (DFG). We gratefully acknowledge the support by the NOAA, Air Resources Laboratory in providing the HYSPLIT trajectory model and related meteorological fields. The European Commission, Joint Research Centre (JRC)/Netherlands Environmental Assessment Agency (PBL) kindly provided the Emission Database for Global Atmospheric Research (EDGAR), release version 4.2. Fire emission data were kindly provided by the Global Fire Emissions Database version 3 (GFED3) represented by G. van der Werf.
References
- Anderson T. L , Covert D. S , Marshall S. F , Waggoner A. P , Charlson R. J , co-authors . Performance characteristics of a high-sensitivity, three-wavelength, total scatter/backscatter nephelometer. J. Atmos. Ocean. Tech. 1996; 13: 967–986.
- Anderson T. L , Ogren J. A . Determining aerosol radiative properties using the Tsi 3563 Integrating Nephelometer. Aerosol Sci. Technol. 1998; 29: 57–69.
- Birmili W , Stopfkuchen K , Hermann M , Wiedensohler A , Heintzenberg J . Particle penetration through a 300 M Inlet pipe for sampling atmospheric aerosols from a tall meteorological tower. Aerosol Sci. Technol. 2007; 41: 811–817.
- Bityukova V , Kasimov N. S . Atmospheric pollution of Russia's cities: assessment of emissions and immissions based on statistical data. Geofizika. 2012; 29: 53–67.
- Bond T. C , Bergstrom R. W . Light absorption by carbonaceous particles: an investigative review. Aerosol Sci. Technol. 2006; 40: 27–67.
- Bond T. C , Covert D. S , Müller T . Truncation and angular-scattering corrections for absorbing aerosol in the Tsi 3563 nephelometer. Aerosol Sci. Technol. 2009; 43: 866–871.
- Charron A , Birmili W , Harrison R. M . Fingerprinting particle origins according to their size distribution at a UK rural site. J. Geophys. Res. 2008; 113: D07202.
- Dal Maso M , Sogacheva L , Anisimov M. P , Arshinov M , Baklanov A , co-authors . Aerosol particle formation events at two Siberian stations inside the Boreal forest. Boreal Environ. Res. 2008; 13: 81–92.
- Draxler R. R , Hess G. D . Description of the Hysplit_4 Modeling System. 1997; Air Resources Laboratory, Silver Spring, MD, 27.
- Eck T. F , Holben B. N , Reid J. S , Sinyuk A , Hyer E. J , co-authors . Optical properties of Boreal region biomass burning aerosols in central Alaska and seasonal variation of aerosol optical depth at an Arctic coastal site. J. Geophys. Res. 2009; 114: 2156–2202.
- Greenfield S . Rain scavenging of radioactive particulate matter from the atmosphere. J. Meteorol. 1957; 14: 115–125.
- Gyawali M , Arnott W. P , Lewis K , Moosmüller H . In situ aerosol optics in Reno, Nv, USA during and after the summer 2008 California wildfires and the influence of absorbing and non-absorbing organic coatings on spectral light absorption. Atmos. Chem. Phys. 2009; 9: 8007–8015.
- Hartigan J. A , Wong M. A. A . K-means clustering algorithm. App. Stat. 1979; 28: 100–108.
- Heimann M . The Zotino tall tower observatory (Zotto): a 300 m tall tower for long-term atmospheric monitoring of biogeochemical changes in central Siberia. Geophys. Res. Abstr. 2008; 10: 2156–2202.
- Heintzenberg J . The aerosol-cloud-climate conundrum. Int. J. Glob. Warm. 2012; 4: 219–241.
- Heintzenberg J , Birmili W . Aerosols over the Siberian forest: the Zotto project. J. Cryogenic Soc. Jpn. 2010; 68: 5–8.
- Heintzenberg J , Birmili W , Otto R , Andreae M. O , Mayer J.-C , co-authors . Aerosol particle number size distributions and particulate light absorption at the Zotto tall tower (Siberia), 2006–2009. Atmos. Chem. Phys. 2011a; 11: 8703–8871.
- Heintzenberg J , Birmili W , Theiss D , Kisilyakhov Y . The atmospheric aerosol over Siberia, as seen from the 300 meter Zotto tower. Tellus. 2008; 60B: 276–285.
- Heintzenberg J , Hermann M , Weigelt A , Clarke A , Kapustin V , co-authors . Near-global aerosol mapping in the upper troposphere and lowermost stratosphere with data from the caribic project. Tellus. 2011b; 63B: 875–890.
- Hoppel W. A , Frick G. M , Larson R. E . Effect of nonprecipitating clouds on the aerosol size distribution in the marine boundary layer. Geophys. Res. Lett. 1986; 13: 125–128.
- IPCC. Climate Change 2007: The Physical Science Basis. 2007; Cambridge University Press, Cambridge.
- Jaenicke R , Fischer G . Aerosol physics and chemistry. Numerical Data and Functional Relationships in Science and Technology. 1988; Heidelberg: Springer-Verlag. 391–457.
- Jain A. K , Murty M. N , Flynn P. J . Data clustering: a review. ACM Comp. Surv. 1999; 31: 264–323.
- Kondo Y , Oshima N , Kajino M , Mikami R , Moteki N , co-authors . Emissions of black carbon in east Asia estimated from observations at a remote site in the East China Sea. J. Geophys. Res. 2011; 116: 2156–2202.
- Kozlov V. S , Panchenko M. V , Yausheva E. P . Mass fraction of black carbon in submicron aerosol as an indicator of influence of smoke from remote forest fires in Siberia. Atmos. Environ. 2008; 42: 2611–2620.
- Kozlova E. A , Manning A. C , Kisilyakhov Y , Seifert T , Heimann M . Seasonal, synoptic, and diurnal-scale variability of biogeochemical trace gases and O2 from a 300-M tall tower in central Siberia. Global Biochem. Cycles. 2008; 22: GB4020.
- Kulmala M , Alekseychik P , Paramonov M , Laurila T , Asmi E , co-authors . On measurements of aerosol particles and greenhouse gases in Siberia and future research needs. Boreal Environ. Res. 2011; 16: 337–362.
- Lloyd J , Langenfelds R. L , Francey R. J , Gloor M , Tchebakova N. M , co-authors . A trace-gas climatology above Zotino, central Siberia. Tellus. 2002; 54B: 749–767.
- Mattis I , Ansmann A , Wandinger U , Müller D . Unexpectedly high aerosol load in the free troposphere over central Europe in Spring/Summer 2003. Geophys. Res. Lett. 2003; 30: 2178.
- Mu M , Randerson J. T , van der Werf G. R , Giglio L , Kasibhatla P , co-authors . Daily and 3-hourly variability in global fire emissions and consequences for atmospheric model predictions of Carbon Monoxide. J. Geophys. Res. 2011; 116: 2156–2202.
- Müller D , Mattis I , Wandinger U , Ansmann A , Althausen D , co-authors . Raman Lidar observations of aged Siberian and Canadian forest fire smoke in the free troposphere over Germany in 2003: microphysical particle characterization. J. Geophys. Res. 2005; 110: D17201.
- Rinne J , Bäck J , Hakola H . Biogenic volatile organic compound emissions from the Eurasian Taiga: current knowledge and future directions. Boreal Environ. Res. 2009; 14: 807–826.
- Schulze E.-D , Lloyd J , Kelliher F. M , Wirth C , Rebmann C , co-authors . Productivity of forests in the Eurosiberian Boreal region and their potential to act as a Carbon sink – a synthesis. Global Change Biol. 1999; 5: 703–722.
- Snyder J. P . Map Projections – a Working Manual. U.S. Government Printing Office. 1987; Washington, DC, U.S.G.S. Professional Paper 1395.
- Steffen W , Sanderson A , Tyson P. D , Jäger J , Matson P. A , Moore III B , co-authors . Global Change and the Earth System: A Planet under Pressure. 2004; Berlin, Springer.
- Stohl A . Computations, accuracy and applications of trajectories – a review and bibliography. Atmos. Environ. 1998; 32: 947–966.
- Stratmann F , Wiedensohler A . A new data inversion algorithm for Dmps-measurements. J. Aerosol Sci. 1996; 27: S339–S340.
- Timkovsky II , Elanskii N. F , Skorokhod A. I , Shumskii R. A . Studying of biogenic volatile organic compounds in the atmosphere over Russia. Izvestiya Atmos. Ocean. Phys. 2010; 46: 319–327.
- Tunved P , Hansson H.-C , Kerminen V.-M , Ström J , Dal Maso M , co-authors . High natural aerosol loading over Boreal forests. Science. 2006; 312: 261–263.
- Virkkula A , Ahlquist N. C , Covert D. S , Arnott W. P , Sheridan P. J , co-authors . Modification, calibration and a field test of an instrument for measuring light absorption by particles. Aerosol Sci. Technol. 2005; 39: 68–83.
- Worthy D. E. J , Levin I , Hopper F , Ernst M. K , Trivett N. B. A . Evidence for a link between climate and Northern Wetland Methane emissions. J. Geophys. Res. 2000; 105: 4031–4038.
- Zimov S. A , Schuur E. A. G , Chapin F. S . Permafrost and the global carbon budget. Science. 2006; 312: 1612–1613.