Abstract
Among Alpine ice core drilling sites, the Colle Gnifetti glacier saddle situated in the Monte Rosa summit range is the only one whose net snow accumulation rate is low enough to offer climate records back to some 1000 yr. It is demonstrated that the strong snow erosion at this site particularly hampers the interpretation of stable water isotope records δ18O, δD in terms of atmospheric temperature changes. We evaluate the δ18O records from four Colle Gnifetti cores for their common variability to extract a composite isotope record that may be compared with the instrumental temperature evidence. Time series analyses over the last 120 yr reveal that the common δ18O signal is mainly reflected in the low frequency variability, starting at the decadal scale. Comparing the correspondingly smoothed composite record to the high-elevation temperature time series (specifically adjusted to the seasonality of the net snow accumulation) reveals the following findings: On the decadal scale, the isotope variability correlates with the temperature record at around R=0.65 but is interrupted by three, ca. 10-yr long mismatch periods. The multidecadal isotope signal closely reflects the strong overall 20th century temperature increase, thereby showing an up to three-fold higher isotope temperature sensitivity than commonly assumed. Over the entire instrumental period back to 1760, five more such mismatch periods are embedded in the generally coherent pattern of the δ18O and instrumental temperature records (including the strong overestimate of the temperature around 1850 by the isotope temperature proxy). For the early instrumental period (1890–1760) characterized by a comparably weak long-term temperature trend, the isotope signal generally suggests warmer conditions of about 0.4°C compared to instrumental data.
To access the supplementary material to this article, please see Supplementary files under Article Tools online.
1. Introduction
Among climate proxy data needed to contrast the variability of present and past climate, records of water isotopologues (δ18O or δD) preserved in polar ice sheets provide one of the most straightforward atmospheric paleo-thermometers (Jouzel et al., Citation1997; Werner and Heimann, Citation2002). Greenland isotope records appear to be less useful, however, to infer the climate excursions of the recent past in Western Europe (i.e. the recent warming, Little Ice Age and the medieval climate optimum). Apart from the geographical situation of respective ice cores, this is also due to the relatively subdued isotope signals of the Greenland records (Fischer et al., Citation1998) during these recent periods. Accordingly, apart from the polar realm water isotope time series from Greenland and high Arctic ice cores played a relatively minor role in multiproxy based compilations of northern hemispheric temperature over the last millennia (Guiot et al., Citation2005; Moberg et al., Citation2005; Rutherford et al., Citation2005; Loehle, Citation2007; Mann et al., Citation2008; Jones et al., Citation2009; Christiansen, Citation2010; Ljungqvist, Citation2010).
Regarding the European climate history on the regional scale, investigations of long-term isotope records from cold Alpine drilling sites would be intriguing since they are immediately related to this target region. Here, the worldwide densest network of long-term instrumental climate observations exists (Auer et al., Citation2007; Böhm et al., Citation2010) which has already been extended backwards by various climate records. This concerns, among others, tree ring indices (Büentgen et al., Citation2006; Frank et al., Citation2007), historical evidences (Brazdil et al., Citation2005; Glaser and Riemann, Citation2009), speleothems (Spötl et al., Citation2004), lake sediments (von Grafenstein et al., Citation1999; Blass et al., Citation2007; Ilyashuk et al., Citation2011) and glacier lengths (Joerin, et al., Citation2008; Zemp et al., Citation2008). However, deploying isotope records from Alpine ice cores beyond the instrumental era is hampered by the small spatial extension of suitable cold drilling sites. This spatial limitation implies strong gradients in glacier flow, glacier geometry and net snow accumulation, leading to serious problems with respect to dating, upstream flow effects and, most notably, in view of snow scouring induced depositional noise. The latter leads to a strong and variable bias in the seasonal attribution of the net snow accumulation, which adds considerable noise, especially to the water isotope signal (Wagenbach, Citation1989; Wagenbach et al., Citation2012). As a consequence, the multi-annual isotope variability in Alpine ice core records may exceed by far the range that can be ascribed to temperature changes (Schöner et al., Citation2001).
The seasonal bias in the net snow accumulation is particularly large at the Colle Gnifetti glacier saddle, constituting the only Alpine drilling site where the net snow accumulation rate is low enough to offer useful ice core records over the last millennia and possibly beyond (Wagenbach, Citation1992; Jenk et al., Citation2009; May, Citation2009). Although small-scale mountain ice core sites outside the Alps might be subject to such depositional noise as well, related interpretation deficits of the water isotope signals are hardly addressed (e.g. Hardy et al. (Citation2003); Thompson et al. (Citation2003)). For the relatively flat and km-sized ice caps of the Canadian Arctic, Fisher et al. (Citation1983, Citation1985), Fisher and Koerner (Citation1994) thoroughly investigated the influence of wind scouring induced depositional noise on water isotope records and concluded that this effect needs to be carefully considered even at these relatively large snow fields.
Deploying our multicore array drilled to bedrock at Colle Gnifetti, we aim at exploring the extent that water isotope records from low accumulation alpine sites may reflect atmospheric temperature variability despite the strong depositional noise. To this end, we proceed along the reasoning that opposed to the very local depositional noise, atmospheric signals have to have a common imprint on the isotope variability of all cores. For glaciological reasons, we focus on the last 120 yr as ensuring adequate dating precision, relatively weak effects of upstream glacier flow and annual layer thinning. This temporal limitation allows as well referring to high-quality instrumental temperature and precipitation time series, most of which are closely related to the high Alpine realm (Auer et al., Citation2005; Auer et al., Citation2007; Böehm et al., Citation2010; Chimani et al., Citation2011).
Accordingly, in the present paper we first examine the depositional noise-related intercore variability of the four isotope records in order to assess the frequency threshold below which the isotope variability may become significant. This is followed by a section dealing with the problem obtaining adequate instrumental temperature records for comparison with the incompletely sampled isotope data. Comparing the master records obtained from the water isotope and instrumental temperature data, we finally assess the extent to which both time series share common variability. As our evaluation concentrates on the depositional noise influence, we do not specifically address the general caveat that only a certain fraction of the water isotope variability seen in precipitation is associated with local condensation temperature changes (Rozanski et al., Citation1992; Fricke and O'Neil, Citation1999; Hoffmann et al., 2006).
2. Site and ice core characteristics
2.1. Glaciological settings
Glaciological features of Colle Gnifetti (hereafter abbreviated as CG) are described thoroughly in the literature; see e.g. Haeberli et al. (Citation1988); Lüthi and Funk (Citation2000); Eisen et al. (Citation2003) for geometry and glacier flow, Hoelzle et al. (Citation2011) for the englacial temperature and Alean et al. (Citation1983) concerning the surface accumulation pattern. Here, we present only a brief overview relevant for assessing the significance of water isotope records.
With a horizontal scale of 400 m and a maximal ice thickness of around 140 m, the CG site forms a small firn saddle at around 4500 m asl between two summits of the Monte Rosa massif (). Geodetic observations suggest that the saddle geometry is near steady state (Lüthi and Funk, Citation2000) and has remained almost unchanged over the last century (Wagner, Citation1996). According to the firn facies scheme of Shumskii (Citation1964), the northern saddle flank where our core array has been drilled belongs to the cold recrystallisation-infiltration zone with melt percolation being confined to the uppermost annual layer. Showing here an englacial 20 m temperature close to −14°C, the glacier is cold throughout and frozen to bedrock at around −12°C (Haeberli and Funk, Citation1991).
Fig. 1 Geographical situation of the Colle Gnifetti saddle in the Monte Rosa summit range (45° 56′ N, 7° 52′ E, 4450 m asl) with the position of the four ice cores within the north flank area. Approximate surface flow lines are shown by black arrows along with the surface topography displayed by contour lines at 20 m altitude spacing.
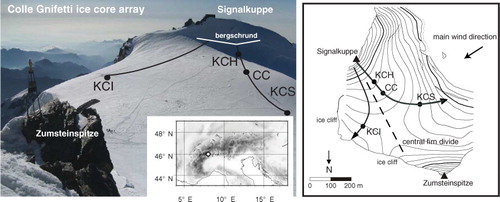
In addition to bedrock geometry and ice flow, the spatial pattern of wind induced snow erosion also significantly shapes the surface topography of CG. As shown in , the orientation of the convex, central saddle axis coincides with the main westerly wind direction making the downwind-situated ice cliff a perfect sink for drifting snow. Hence, the CG drilling site does not provide a closed system with respect to fresh snow precipitation. This prevents any link of the climatologic precipitation rate to the net snow accumulation rate. Indeed, this latter value ranges from 0.15 m water equivalent (w.e.) in the north-facing flank to about 1.2 m w.e. in the southern one, where the higher abundance of ice layers and ice crusts significantly reduces the snow erosion rate (Alean et al., Citation1983). Accordingly, the net accumulation in the north-facing flank is lower by up to a factor of nine than the climatologic precipitation rate being around 1.4 m/a as taken from the Monte Rosa grid cell of the HISTALP data base (Efthymiadis et al., Citation2006; Chimani et al., Citation2011). This particularly high snow erosion rate is unique among all explored Alpine drilling sites where the annual surface snow accumulation may reach up to 4 m w.e. (Preunkert et al., Citation2000).
2.2. Influence of snow preservation on water isotope levels
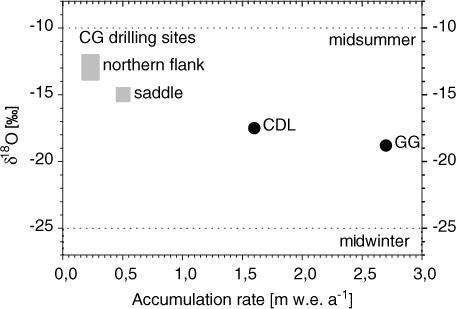
The snow erosion rate within the CG north flank shows a strong seasonality since during the summer half year fresh snow consolidation is faster and supported by refreezing surface melt. Thus, the mean net snow accumulation is mainly made up by precipitation of the warm seasons (Wagenbach, Citation1989). This seasonal asymmetry biases the mean water isotope level in the CG ice cores since a substantial fraction or even almost all of the more isotopically depleted winter precipitation is lost. Evidently, this seasonal effect strongly contributes to the depositional noise of the water isotope variability at CG. Note, that the maximum δ18O winter/summer contrast in high Alpine precipitation may reach 15‰ while the centennial scale δ18O trend related to temperature change should be limited to roughly 1‰ (Wagenbach et al., Citation2012). This peculiar snow-sampling situation also entails a pronounced spatial scatter of mean δ18O values. Even within the small CG drilling area in the north-facing flank, the typical net snow accumulation varies considerably (0.15–0.5 m w.e./a) depending on the mean, local wind field and surface energy balance. Since both glacio-meteorological parameters depend mainly on the slope (aspect) of the saddle surface, there is a systematic accumulation rate increase towards the central saddle point. This is inferred from various stake readings (Alean et al., Citation1983; Lüthi and Funk, Citation2000) and ground-penetrating radar (Eisen et al., Citation2003; Konrad et al., Citation2013) showing that net accumulation rates roughly double from the near bergschrund area down towards the saddle point. The mean δ18O levels (obtained from nine shallow ice cores covering about 20–30 yr) echo this spatial accumulation pattern in showing an overall decrease over the saddle flank of around 1‰. Mean isotope values from these shallow cores (not strictly covering a common time window) reveal considerable scatter with an average of −13.0±0.9 ‰ and a range of −11.6 to −14.5‰, underlying the rather irregular net snow deposition in space and time. In order to illustrate the strong, systematic decrease of the δ18O overall means with increasing net snow accumulation, compares the CG drilling sites with nearby Monte Rosa ice cores experiencing much less snow erosion.
Fig. 2 Mean δ18O levels in recent firn and ice records of the Monte Rosa region versus mean snow accumulation rate. Grey rectangles at Colle Gnifetti mark the δ18O and accumulation rate ranges within the north flank and near saddle areas. CDL and GG denote cores drilled at the relatively wind protected sites Colle del Lys (B. Stenni, pers. communication) and Grenzgletscher (Eichler et al., Citation2000). Mid-winter and summer levels indicate the typical overall range of the raw datasets.
2.3. Ice core array and chronologies
Our array comprises four cores drilled to bedrock within the CG north flank (see for the borehole locations and for core meta data). In addition to a relatively flat bedrock topography and substantial glacier thickness, we selected the ice core positions based on the following criteria: (i) to favour low net accumulation areas as found in the north flank region due to minimum surface melt, (ii) to avoid the highly complex 3D ice flow regime near the saddle point area (Wagner, Citation1996), (iii) to align cores broadly along a common flow line upwind to the ice divide (i.e. KCH, CC, KCS) and, (iv) to drill (KCI) within an island of minimum accumulation identified by ground penetrating radar (Böhlert, Citation2005) downwind of the ice divide.
Table 1 Glaciological features of the evaluated Colle Gnifetti ice cores
The ice core chronologies were basically established by annual layer counting and by five dated time horizons, comprising the 1963 bomb tritium maximum, outstanding Saharan dust layers (1977, 1947 and 1901) and the volcanic Katmai horizon of 1912, respectively. For annual layer counting, discrete major ions analyses, with the emphasis on ammonium as providing the largest summer/winter contrast, were deployed (Preunkert et al., Citation2001). For the very low accumulation core KCI, we used a combination of continuous flow analyses of insoluble (mineral) dust and electrolytic conductivity at approximately one cm depth resolution (Bohleber, Citation2011). The continuous analyses were supported by continuous density profiles at comparable resolution (Wilhelms, Citation1996). Within the upper core sections covering 120 yr, providing the main target for our study, annual layer thinning did not substantially hamper the core dating. Nevertheless, the rather irregular net snow deposition along with the relatively subdued winter snow layers complicated annual layer counting. Since the dating precision is thus dependant on the typical snow accumulation rate at the core position, we accordingly adjusted the depth resolution of the deployed seasonal signal analyses.
For all four cores, our estimates of the error in annual layer counting between the dated time horizons yielded typically ±1 yr within 10 yr. This value also appeared to be independent from the type of seasonal stratigraphy (i.e. ammonium, dust, total ion content, etc). For the last 120 yr, where annual layer counting is constrained by five absolute time horizons, the typical dating uncertainty is less than ±2.5 yr. Within the subsequent 120 yr (1880–1760), briefly addressed in the discussions, no useful time horizons are available. A potential accumulation of the counting uncertainty would result here in a dating uncertainty of maximal ±12 yr. In order to keep the isotope records as independent as possible, we applied no matching of the individual core chronologies via the numerous stratigraphical markers in this work. At least validation of the relative core dating was achieved by internal reflections obtained from ground-penetrating radar (GPR) profiles within the core array over the last 80 yr (Bohleber, Citation2011). Linking all four borehole positions by isochronous demonstrated age-consistency within the method-based uncertainty of typically ±4 yr (Konrad et al., Citation2013). This finding is in agreement with our dating error estimate above, since the latter age uncertainty includes a substantial error of the GPR mapping.
3. δ18O records of the ice core array
3.1. Data overview
Continuous subsampling for δ18O (and δD) analyses was adjusted to the annual surface snow accumulation and firn density at depth resolution typically ranging between 5 and 10 cm for the past 120 yr. This corresponds formally to subseasonal δ18O resolution within the top 20 m of the high accumulation KCS core, but may decrease to roughly annual values in case of the low accumulation KCI core. illustrates the outstanding diffusional smoothing experienced in the KCI core already in the top 15 m w.e. Note that isotope smoothing is much faster compared to polar sites with similar annual layer thickness due to the relatively high firn temperature at CG. Resampling most of the KCI section even at 1.5 cm depth resolution did not significantly restore the high-frequency isotope variability seen in the other cores. Noting this as a persistent natural sampling effect, the original coarse KCI resolution was deployed in the present evaluation. The section with the lowest temporal resolution of all cores within the past 120 yr is at 1880 in KCI (3-yr time step). For our analyses, we mainly used the four δ18O time series transformed into nominal annual resolution. We also down-sampled the time series according to the largest overall original time step (3 yr in KCI) and, where applicable, used the non-equidistant raw δ18O time series.
Fig. 3 Colle Gnifetti δ18O time series over the last 120 yr displayed in nominal annual resolution (see text) with trends highlighted by decadal Gaussian smoothing. Note the relatively small effect of this low pass filter on the KCI δ18O record having been smoothed strongly already by isotope diffusion.
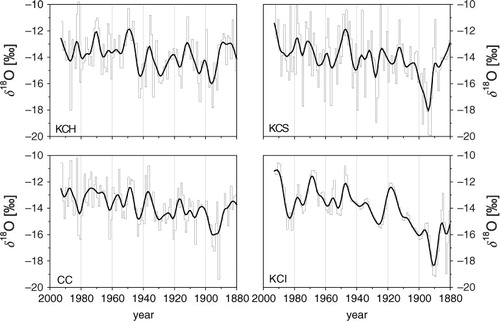
already reveals the following features of the δ18O records: (i) almost no intercore correspondence in the high interannual variability (ii) distinct, but only weakly coherent, multi-annual changes, (iii) different degrees of diffusional smoothing and, (iv) an overall increasing trend over the last 120 yr common to all records. Depending on the site specific mean accumulation rate, the mean δ18O values vary within this time period between –14.4‰ (KCS) up to –13.3‰ (KCI), while the KCH and CC cores show virtually the same levels of –13.9‰ and –13.8‰, respectively. Note that no corrections for upstream glacier flow effects are applied here, as only comparatively shallow depth sections are considered. As becoming steadily damped with depth, the subannual to annual δ18O oscillations constitute an individual, instationary part of each time series. Evidently, these high-frequency components cannot reflect a common external atmospheric signal since they are characterized by the site specific, local depositional regimes. Thus, the question arises: What is the likely frequency threshold below which we may expect an external atmospheric imprint on the δ18O variability common to all cores of the array?
3.2. Common isotope signal investigation
Performing a reliable common signal investigation of the raw CG δ18O time series is not straightforward due to their uneven temporal spacing as well as due to the inherent serial correlation by isotope diffusion. In this study, a combined approach was deployed, including time and frequency-domain based methods. For univariate spectral analysis of the raw δ18O time series, we used the Lomb-Scargle periodogram which revealed that the KCI spectrum contains no significant components with periods lower than 7–10 yr. Although multi-annual changes in the range of 3–5 yr contribute to the isotope variability of the KCH, CC and KCS records, periods shorter than 5–10 yr are not common among them. Note that part of these findings may be also attributed to the limited dating precision of ±1 yr per decade, a priori reducing the coherence on the multi-annual time scale.
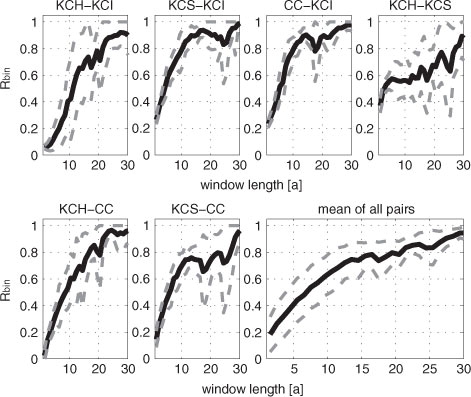
Focusing on the time domain for further cross-correlation analyses, the Pearson's correlation coefficient R bin was estimated by adapting the binned correlation method developed by Mudelsee (Citation2010). In spite of potential serial correlation of the data, this analysis allows to derive a quantitative correlation measure. To do so, R bin was calculated for all pairs of raw δ18O time series (see Supplementary Material). Since the δ18O time series of KCS stands out by large high-frequency content and subannual time resolution, the latter was reduced to a comparable order of magnitude as KCH and CC prior to calculating R bin. shows the binned correlation coefficient R bin versus time window length for each pair of the four δ18O time series. As an overall common tendency, represented by the mean R bin value in , the correlation remains low for the annual to bi-annual time scales and increases with increasing window length as the noise is reduced. This behaviour is expected due to the temporal trend present in all time series. For window lengths larger than 10–15 yr, the increase in R bin becomes more gradual, but R bin values remain larger than 0.6–0.7. These findings indicate a persistent covariation among the δ18O time series above the decadal time scale. Hence, we may conclude that isotope changes on periods significantly shorter than 10 yr are hardly common to all four ice cores. They are, thus, unlikely to represent an atmospheric signal related to the isotope signature of the precipitation. This implies that the comparison of the isotope signal with the respective temperature variability should be restricted to decadal and longer periods.
Fig. 4 Binned correlation coefficient R bin over the common period 1981 to 1880 of each pair of the Colle Gnifetti δ18O time series as a function of binning window length (black lines). The grey dashed lines indicate the 90% confidence intervals obtained from multiple runs with varying starting point of the binning. Lower panel, right side: The mean value calculated for R bin from all pairs of δ18O time series (1981–1880), plotted as a function of binning window length. Grey dashed curves indicate one standard deviation around the mean. For details on the binned correlation calculation, see Supplementary Material.
To eliminate the non-coherent high-frequency components from the δ18O time series, we applied different techniques for low pass filtering including Singular Spectrum Analysis (SSA), Gaussian-shaped moving windows as well as LOESS smoothing, all giving virtually the same results. To keep the data reduction transparent, Gaussian smoothing including appropriate damping of boundary artefacts was selected to suppress subdecadal variability while cross-checking with the alternative smoothing methods. Moreover, the Gaussian procedure was preferred since it basically prescribes natural smoothing of the isotope signal by diffusion (see e.g. Johnsen et al., Citation2000).
3.3. The isotope master record
In order to capture the common long-term variability of all four CG δ18O time series in a single, representative δ18O record with an improved signal-to-noise ratio, we considered various stacking methods. For a simple stack, the four time series were averaged in their formal annual resolution. Alternatively, the time series were down-sampled to 3-yr time steps prior to stacking. We also applied scaling the time series by their standard deviations prior to stacking as well as principal component analysis (for details, see Supplementary Material). The different versions of the final Gaussian smoothed stacks showed no distinct difference in their decadal features. Hence, we eventually selected the simple average of the nominal annual values to obtain the δ18O master record (denoted in the following simply as ‘the stack’) but checked all findings related to the composite record versus the alternative stacking methods.
The individual isotope records shown in dating back to 1880 comprise periods of clear alignment in the decadal trends (e.g. 1970–1930) as well as less coherent phases (e.g. 1930–1910). The uncertainty in the smoothed stack due to the variable degree of coherency among the cores was estimated by means of a specifically adapted bootstrap approach (see Supplementary Material). The result is displayed as an uncertainty band along with the smoothed isotope stack shown in .
Fig. 5 Upper panel: composite (stacked) δ18O record from four Colle Gnifetti cores smoothed by decadal Gaussian filter (black line) with bootstrap uncertainty estimate displayed as grey band. Lower panel: Same as upper panel but for the individual δ18O records.
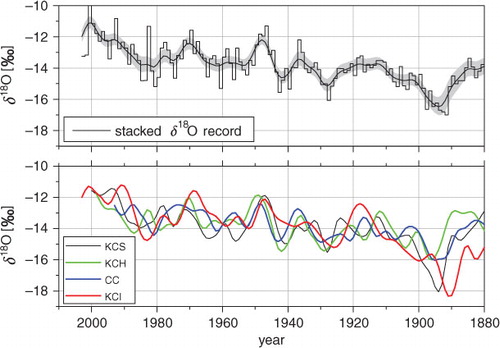
Inspecting the composite and individual isotope records in view of the subsequent comparison with instrumental temperature time series, we note two peculiarities which are worth mentioning already at this stage: The substantial negative δ18O excursion around 1890 and the surprisingly high isotope/temperature sensitivity. Note that both phenomena in principle deserve thorough separate investigations, which are, however, outside the frame of the present paper. The 1890 isotope dip is clearly seen in all cores and stands out, at least, within the last two centuries both in duration and isotope depletion. This feature would require preservation of winter precipitation in large amounts or over several consecutive winters. Since the isotope records are otherwise strongly biased towards summer half year precipitation, the probability for such a substantial event appears to be rather low. Inspecting the frequency distribution of annual means revealed the low values in question to lie well outside the 95% percentile range, around 99% percentile for KCI and KCS. Hence regarding the dip as an outlier we established a second δ18O-stack version that, later on, may be used alternatively. For this alternative stack, the singular 1890 event is damped by limiting five nominal annual δ18O values in KCI and KCS to a value of –16.5‰ (corresponding roughly to the 95% percentile range of KCI).
The extraordinary high isotope/temperature sensitivity becomes most evident in view of the robust δ18O trend over last 25 yr showing an increase by roughly 2.25‰. Referring to the isotope/temperature relationship of 0.65‰/°C reported by Rozanski et al. (Citation1992) for European temporal trends in precipitation would suggest a temperature increase over the last 25 yr in the range of 3.5°C. This is clearly at odds with the respective observed temperature increase of around 1.75°C (Auer et al., Citation2007). The phenomenon remains enigmatic, at this stage, since the seasonal change related isotope/temperature sensitivity we obtained from fresh snow sampling at CG (Keck, Citation2001) as well as from high accumulation Col du Dôme (Mont Blanc) ice core yields values well within the expected range of (0.6–0.7)‰/°C. Similar seasonal sensitivity values are seen in other high Alpine ice cores where an almost complete seasonal snow deposition cycle is preserved (i.e. Colle del Lys (B. Stenni, pers. communication), Fiescherhorn (Schotterer et al., Citation2001) and Grenzgletscher (Eichler et al., Citation2000)).
4. Instrumental temperature records
4.1. Data overview
In the ideal case, instrumental temperature changes to be compared with the isotope master record from CG should consider the fact that the water isotope information is confined to episodes where precipitation occurs and becomes preserved at the drilling sites. This demands, at least, an estimate of the seasonality of the net snow deposition as well as weighting of the instrumental temperature data by the time fraction of days with precipitation.
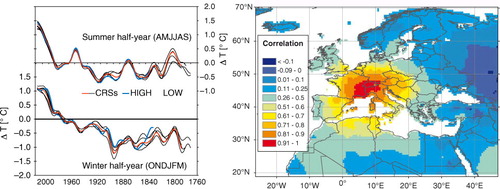
For the Alpine realm, HISTALP provides the most extensive dataset of carefully homogenized instrumental climate observation (Auer et al., Citation2007). This holds in view of its spatial and temporal coverage as well as the number of climate elements. Therein, the coarse resolution subregion dataset denoted HIGH (for altitudes ≥1500 m asl) covers high-elevation sites with temperature data going back to 1818. Gausssian-filtered subregional temperature series of HISTALP are displayed in (left panel) illustrating that the long-term temperature variability is highly coherent in the spatial domain within the entire Greater Alpine Region. This finding is also reflected in the spatial correlation map indicating clear coherence even within Central-Europe shown in (right panel) calculated as grid-point correlation (Pearson correlation coefficient for 1901–2002) of the Climatic Research Unit (University of East Anglia, UK) temperature series relative to the CG grid-point [CRU TS 2 (1901–2000) and CRU TS 2.10 (update to 2002) 0.5 degree high-resolution-gridded temperature data (www.cru.uea.ac.uk/cru/data/hrg/)] (Mitchell et al., Citation2004; Mitchell and Jones, Citation2005). Consequently, the subset HIGH could be extended with high reliability beyond 1818 by the subregions Northwest and Southwest where temperature time series from low elevation sites dating back to 1760 are available [for details see Auer et al. (Citation2007)]. This extended HISTALP dataset HIGHex serves as our genuine instrumental temperature data source. We transferred the HIGHex temperature dataset, given as anomalies relative to 1961–1990, to the geographical situation of CG by merging it with the 1×1 km monthly temperature climatology from Hiebl et al. (Citation2009) for the relevant CG pixel. Final corrections from the pixel elevation of 4225 m asl to the 4450 m asl site altitude were computed from local monthly mean vertical lapse rates derived from the 16 nearest 1×1 km pixels. The resulting monthly dataset, denoted hereafter ΔT inst, shows virtually identical decadal anomaly trends as the original HIGH data source. Here, and further on, temperature anomalies (ΔT) are used as denoting the deviations from a certain reference period. We estimated a time-dependent uncertainty for ΔT inst from the variability of summer temperatures of high-elevation stations using the same bootstrapping method as applied for ice core isotope data. The resulting uncertainty band reflects the general high temporal correlation of Alpine temperatures at the seasonal scale but also deviations arising from the different local topographies of the sites. We transferred this uncertainty estimate without further change to all versions of the temperature time series used for comparison with the isotope records. Such change particularly concerns modifications of ΔT inst with respect to the seasonality in the snow deposition rate outlined below.
Fig. 6 Left panel: 30-yr Gaussian low pass filter of the 1760–2007 instrumental temperature series compiled for the 5 subregions of the Greater Alpine Region HISTALP database (Auer et al., Citation2007). CRSs refers to the four low elevation subregions, LOW to low elevation mean and HIGH to high elevation mean. The slightly larger spatial heterogeneity in the early instrumental period (prior to 1850) than today is rather an artefact of still existing homogeneity problems than an expression of real climate patterns. Right panel: Spatial coherence of air temperature in Europe shown by the grid-point correlation (Pearson correlation coefficient) for 1901–2002 of the Climatic Research Unit (University of East Anglia, UK) temperature series versus the Colle Gnifetti grid-point (see text for data source).
4.2. Establishing the ice core relevant temperature series
Our attempt at adjusting the monthly resolved ΔT inst record to the ice core borne isotope signal is based on estimating the change in seasonal probability that precipitation events are preserved in the ice core. The validity of this approach relies on two assumptions:
the monthly precipitation totals are proportional to the frequency of precipitation events (i.e. with the time fraction of wet days) and thus with the probability for a potential snow input to the glacier archive, and
for each month, the net snow accumulation fraction versus total monthly precipitation is controlled by the potential solar insolation. For the respective rationale, see section 2.2.
Overall, our simple model implies that the preservation of fresh snow is simply proportional to the probability for the occurrence of local precipitation and the probability for insolation-driven snow consolidation. To obtain modified temperature series (denoted ΔT mod), we weighted ΔT inst serially by monthly values of the local precipitation rate p i as well as by an estimate of the mean seasonality of the (insolation controlled) likelihood for fresh snow preservation d i. The CG precipitation was inferred from Efthymiadis et al. (Citation2006), time series for grid-point 46°5′ N, 7°45′ E).
For the weighting factors with respect to fresh snow preservation, we assumed that their seasonal cycle obeys a Gaussian-shaped distribution centred at mid-summer as coinciding with the seasonal insolation maximum. The distribution width was adjusted so as to obtain the observed δ18O core mean from the typical seasonal δ18O cycle observed in the local precipitation. The latter input data are taken from the Colle del Lys (CDL) δ18O time series (B. Stenni, personal communication) assuming a sinusoidal cycle, i.e. no fresh snow loss at CDL. Since CDL lies 198 m lower than CG, the CDL δ18O values were corrected using an estimated isotope altitude effect of −0.09‰/100 m reported by Siegenthaler and Oeschger (Citation1980) for high Alpine elevations. The modified temperature time series ΔT
mod is eventually derived as weighted annual average by combining the monthly weighting factors p
i and d
i according to:Note that the monthly precipitation weighting factors p
i in this equation are different for each year while the snow conservation factors d
i remain the same.
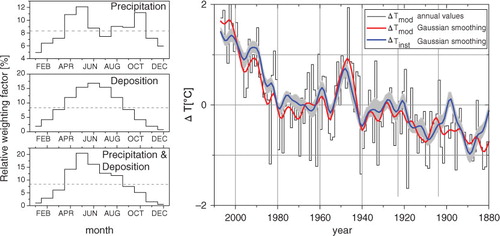
shows the mean seasonality of the weighting factors and contrasts the modified ΔT mod with the original temperature time series ΔT inst. According to , ΔT mod becomes associated mainly with late spring and early summer while the core winter period is clearly de-emphasized. This modification has almost no effect on the linear trend over the last century [calculated for the unsmoothed annual mean values and being (1.45±0.22) °C/100a and (1.49±0.18)°C/100a, respectively] but may become substantial regarding decadal periods. This is particularly evident for the recent warming, where the 1980–2007 linear trends suggest an increase of ΔT mod by (1.9±0.38)°C but only (1.3±0.35)°C in case of ΔT inst. On the decadal scale, the range of the Gaussian smoothed time series of ΔT inst is typically ±0.75°C, whereas the difference between ΔT mod and ΔT inst may account to ±0.5°C. Within the reference period 2007–1880, precipitation and snow preservation weightings contribute almost equally to the decadal modifications of ΔT inst (i.e. by ±0.15°C and ±0.14°C, respectively), though their individual impacts may vary largely and even at opposite signs. In conclusion, modification by precipitation and deposition weighting substantially alter the decadal trends of the instrumental temperature data and may not be disregarded for a detailed comparison with ice core derived isotope records on that scale.
Fig. 7 Left panel: Monthly weighting factors for precipitation (top), net snow deposition probability (middle) and both combined (bottom) used for establishing the modified instrumental temperature series ΔT mod with annual averages indicated by dashed lines. Right panel: Comparison of ΔT mod versus the original temperature record ΔT inst; both anomalies refer to the 2007–1880 mean. The uncertainty associated with the original instrumental temperature record is indicated by the grey band (see text).
Admittedly, our derivation of an ice core related instrumental time series suffers from the crude estimate of the seasonality in fresh snow preservation. At this stage, the deposition probabilities d i were left constant, and do not take into account interannual or long-term changes of the monthly insolation parameter. At least, a proxy for this input might be provided by sunshine duration records available over last 120 yr from a few Alpine sites (see section 5.2) or, more indirectly, from an appropriate melt layer index. The systematic, spatial differences of snow preservation among the drilling positions are also not taken in account. As we are considering the interplay between the opposing influence of insolation and wind induced snow erosion for a given site aspect, these improvements deserve extensive data assimilation and complex modelling. Apparently less effort is needed in deploying adequate weighting of the instrumental temperature series with the local occurrence of precipitation.
4.3. Local daily precipitation weighted temperature series
It is evident that temperature proxy signals carried by precipitation (as water isotope records from ice cores, speleothemes, lake sediments or precipitation networks) should be referenced to instrumental temperature series that are weighted by on-site precipitation data. The HISTALP dataset, like other well homogenized climate time series, is available at monthly resolution only (Moberg et al., Citation2005; Auer et al., Citation2007) making an adequate weighting by the fraction of precipitation periods impossible. However, we assessed the possible impact of local precipitation weighting on long-term Alpine temperature series by investigating two key HISTALP stations as examples where high-quality, long-term climate data are available at daily resolution. In addition to the high-elevation station Sonnblick (3105 m asl), we included Vienna-Hohe Warte (203 m asl) since the temperature time series beyond 1818 is confined to low elevation sites (see section 4.1). From these datasets we derived monthly and seasonal temperature means based on all days (ΔT all) and precipitation days only (ΔT prec), where ΔT prec is obtained by weighting with daily precipitation totals.
Following the same linear regression scheme as previously deployed for ΔT inst versus ΔT mod (summer half year April–September in both cases), we arrived at the following findings:
Holding for both sites, the centennial trends (2.0±0.3°C/100a) are almost identical for local precipitation weighted and non-weighted temperature series.
Over the last three decades, ΔT all and ΔT prec increases at Sonnblick by 1.56±0.54 and 1.65±0.56°C, respectively. At Vienna, these increases are 1.65±0.55 and 1.78±0.60°C. Thus, at both sites, the increase in T prec is slightly larger than for T all. However, the trend difference is not formally significant.
Decadal scale differences ΔT all–ΔT prec are typically ±0.13 for Sonnblick and ±0.09°C for Vienna. These values decrease on the 30 yr time scale to ±0.08 and 0.06°C, respectively.
5. Water isotope versus instrumental temperature records
5.1. Comparison of master records on the decadal scale
The δ18O master record is compared in with the modified instrumental temperature ΔT mod. Binned correlation coefficient calculations (as already performed between the individual δ18O records) revealed a R bin value of 0.7 for time windows larger than 10 yr. The correlation continues to increase with the time windows giving around 0.8 at 30 yr. This behaviour is also apparent when the individual δ18O time series are correlated with ΔT mod.
Fig. 8 Intercomparison of decadal changes of the modified instrumental temperature ΔT mod (upper panel, red line) with stacked δ18O record (lower panel blue line). All data are smoothed by decadal Gaussian filtering and refer to deviations from the 2003–1880 mean. Grey bands indicate the estimated uncertainty ranges, which are adopted for ΔT mod without change from ΔT inst () and from the bootstrap uncertainty of δ18O shown in . The dotted blue line refers to the isotope stack corrected for the outlier around 1890 (see text). The periods marked with P1 to P6 are discussed in the text.
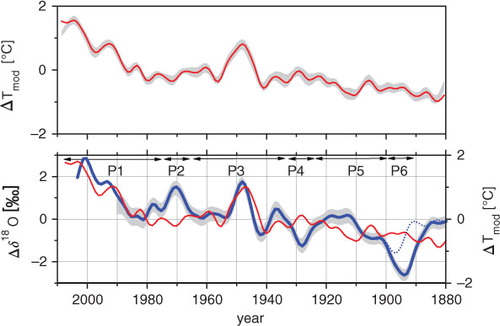
The visual comparison of δ18O with ΔT mod in reveals distinct, multi-annual to decadal scale periods where both signals are coherent, opposite or characterized by a mixed behaviour (as per 1900–1920). In the following, these phases are denoted by increasing numbers from P1 (the most recent) to P6 (around the late 19th century). Applying SiZer analysis (Chaudhuri and Marron, Citation1999), we found that all phases indicated in are significant and thus not smoothing artefacts. Moreover, the misfit phases P2, P4 and P6 are clearly seen in all individual ice core records (recall ). Also note that misfit periods include those with the isotope signal above as well as below the temperature record. Taking the annual mean temperature ΔT inst instead of ΔT mod does not substantially alter the degree of mismatch or coherence with δ18O, except in the case of strong δ18O undershooting around 1890. We may conclude that significant multiyear mismatch phases embedded in a common, increasing trend over the last 120 yr appear to be a robust feature of the δ18O–temperature comparison at CG.
Attribution of causes to the different mismatch phases is challenging since both glaciological as well as atmospheric drivers may be involved. On the one hand, this concerns transient changes in the seasonality of the net snow deposition and, on the other, the climatology of precipitation as associated with distinct circulation pattern changes. The latter may have a significant impact on the water isotope signature of precipitation although not immediately linked to the local condensation temperature (Sturm et al., Citation2010). This is shown by Fisher et al. (Citation2008) from the high-elevation Mt. Logan drilling site, where strong shifts in the δ18O level are not associated with temperature but rather with changes in the source region of the water vapour. Evidently, both the glaciological and atmospheric effects are related to climate variability making it difficult to identify a single reason for the δ18O–temperature mismatches. Nevertheless, in the following, we attempt to address the various periods Pi in view of possible peculiarities, either in the snow deposition or in the temperature/precipitation climatology.
5.2. The influence of snow deposition seasonality
Shifts of seasonality in the snow net deposition are a likely reason for the decadal misfit periods due to the high sensitivity of δ18O records on such changes. In this respect, the undershooting isotope signal (P6) in the late 19th century (already attributed in section 3 to a potential singular episode of winter snow preservations) constitutes the most outstanding mismatch over the past 120 yr. This episode most likely points to a snow deposition anomaly rather than to an atmospheric signal. The reason for this snow preservation remains ambiguous, however.
In relation to potential insolation-driven snow deposition anomalies, we additionally considered sunshine duration data from the high alpine subset of the HISTALP network, as insolation data for CG is lacking for the past 120 yr. We calculated mean values for the summer half (May–September) and winter half year (October–April) for both datasets. Subsequently, the robust trend (detected by means of SSA) was subtracted prior to applying decadal Gaussian smoothing. All periods were inspected for distinct decadal excursions above or below the overall trend. summarizes our findings for all periods Pi. The terms ‘high’ and ‘low’ refer to distinct decadal excursions above and below the robust trend, respectively. If a clear indication for high or low is missing, an entry is omitted (‘–’). For period P6, we find high-sunshine duration during winter half years in contrast to low values in the summer seasons. Such conditions may have favoured the exceptional preservation of snow deposited during the winter seasons. Additionally, temperatures at that time were exceptionally cold and associated with enhanced continentality of the Alpine climate (Böhm et al., Citation2010). The preserved snow would thus appear even more depleted in δ18O. Consequently, the isotope record of the P6 period does deviate particularly strong with respect to the summer biased temperature record ΔT mod but is closer to the annual mean CG temperatures ΔT inst though the misfit basically remains. The other downward isotope excursion with respect to temperature is P4 around 1930, where, however, no clear temperature anomalies are recorded, but again higher sunshine duration in winter and lower in summer is found, respectively.
Table 2 Overview on climatologic findings from the HISTALP high elevation database during misfit and non-misfit periods between the δ18O and instrumental temperature records marked in
In contrast to P6 and P4, the early 1970s period P2 stands out through substantially increased isotope values compared to ΔT mod. Here, the isotope signal is opposite to the dip of colder Alpine summer temperatures going along with reduced sunshine duration. In view of an associated snow deposition anomaly, the relatively high isotope values would require that net snow accumulation to be more strongly confined to the mid-summer period when insolation and high temperature favours fresh snow consolidation. The general cold summer half years would basically support this setting as limiting snow preservation to the warm mid-summer period where isotope values are generally high. In view of a climate anomaly, it is worth mentioning that the P2 period coincides with the absolute maximum of aerosol related pollution in Western Europe, clearly documented in various Alpine glacio-chemical ice core records (Preunkert et al., Citation2001; Schwikowski, Citation2004; Wagenbach et al., Citation2012). Assuming the resulting European scale solar dimming to be the main driver for the decline of instrumental temperature (Wild et al., Citation2005), it is conceivable that the precipitation isotope signal would not necessarily react on this negative forcing in the same way, as the atmospheric temperature. This discovery goes along with simulations performed for the CG and Mont Blanc areas via REMO (regional climate model coupled with a water isotope module), which also suggest relatively high isotope values during the relatively cold 1970's summers (G. Hoffmann, Final ALPIMP Report to EU, personal communication).
In summary, misfit periods with too-low isotope values compared to ambient temperature appear to be associated with relatively high-sunshine duration during winter seasons. This is because the width of the seasonal distribution in the net snow deposition is increased (see seasonal weighing factors in ). Vice versa, periods with isotope values that are too high occur with reduced sunshine duration during (cold) summer seasons confining the net snow deposition more to the core summer period.
Finally, P1, the very recent period and P3 in the late 1940s show well-correlated changes of temperature and isotope records. They constitute the most prominent temperature anomalies over the last 120 yr, both through their multidecadal extent and strongly positive temperature anomaly. P1 is characterized by a persistent, strong increasing trend and P3 by extremely warm summers. Note that P3 is shown by Huss et al. (Citation2009) to go along with the strongest negative mass balance year 1947 of the Swiss glaciers on record. For both periods, it appears that simply the extraordinary magnitude of their decadal temperate signal favoured the clear reflection in the isotope variability.
Overall, the last 120 yr comparison of the decadal variability between water isotope and air temperature revealed three multidecadal periods of coherence interrupted by shorter instances of mismatch. This finding suggests that even a stacked isotope record may lead to partly erroneous reconstruction of atmospheric temperature changes on the decadal time scale. Looking at decadal trends over the entire instrumental period back to 1760, we find three more mismatches around 1765, 1785 and around 1850 all showing the δ18O anomaly above the respective temperature record (). It is worth noting that the particularly strong overshooting of the isotope signal in the mid-19th century broadly coincides with that of maximum Alpine glacier extent followed by rapid recession. Interestingly, we find a pronounced decadal minimum in the isotope record around 1814, in agreement with the brief period of exceptionally cold Alpine summers around 1816 reconstructed from tree rings [e.g. Büentgen et al. (Citation2006)] and instrumental datasets (Casty et al., Citation2005). Moreover, this finding supports our ice core chronologies back to the early 19th century.
Fig. 9 Comparison of the composite δ18O record (red line) with instrumental temperature data (blue line) as in but extended to the full instrumental period back to 1760. Note that the outliner corrected δ18O record is used. Data are shown as deviations from the 2000–1901 mean.
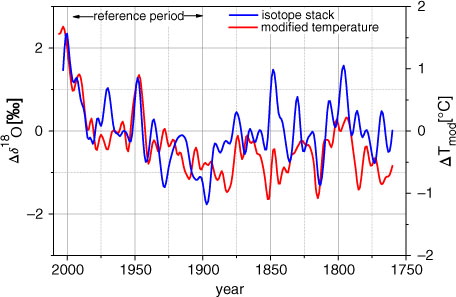
In view of the picture of an overall multidecadal covariation between δ18O and instrumental temperature interrupted by short mismatch periods, the following questions arise: Do mismatches persist when looking at centennial trends? Also, does the coherence in long-term variability allow for a calibration of the isotope signal against instrumental temperature?
5.3. Comparison of master records on the centennial scale
We extended the binned correlation investigation to the entire instrumental 250-yr period, showing the correlation to continuously increase with window length reaching a plateau around a R bin value of 0.8 for window lengths between 30 and 50 yr. In order to highlight the centennial trends over the entire instrumental period, we deployed Singular Spectrum Analysis (SSA) including a Monte-Carlo based significance assessment (Allen and Smith, Citation1996; Elsässer et al., Citation2011). Again, using the stack with the reduced 1890 negative delta excursion and a SSA window length of about 1/5 of the time series length, we find the δ18O and ΔT mod long-term trends in the first reconstructed component significant at a 90% level ().
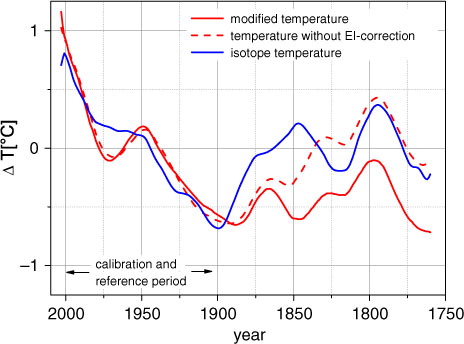
Fig. 10 Centennial scale trends of temperature anomalies relative to the 2000–1901 mean derived by the first component of Singular Spectrum Analysis (embedding length of 1/5 of the entire time series length). Blue line: ΔT based on the outlier corrected δ18O stack adopting an isotope/temperature sensitivity of 1.6‰/°C, solid red line: modified instrumental temperature ΔT mod based on Auer et al., Citation2007, dashed red line: high Alpine instrumental summer temperature without the early instrumental correction (Böhm et al., Citation2001; Böhm et al., Citation2010).
However, application of the CG isotope record as a proxy for long-term temperature variability requires calibration of the isotope change. As addressed in section 3, using the typical isotope temperature sensitivity of around 0.65‰/°C (Rozanski et al., Citation1992) would result in unrealistically high temperature changes. Although the reason for this phenomenon remains speculative and deserves a dedicated study, we tentatively performed a calibration for the time period 2000–1901. Here, the isotope sensitivity widely ranges from approx. 1.0 to 1.9‰/°C, depending on the dataset smoothing and the calculation method. Among orthogonal and linear regression of binned data as well as decadal to centennial smoothings, we eventually deployed orthogonal regression (Jackson and Dunlevy, Citation1988) of SSA smoothed centennial trends and derived a preliminary value of Δδ18O/ΔT=1.6‰/°C. This is more than twice the expected value from regressing seasonal changes in Europe or from the relative short-term trends of Swiss precipitation data (Rozanski et al., Citation1992). Similarly high isotope sensitivities are seen, however, at the Alpine ice core site Fiescherhorn with 1.45‰/°C given by Rozanski et al., Citation1997 from annual mean regression of 1963–1988 data. Also, 1.7‰/°C are obtained from this site referring to 13.66‰/°C given by Jenk et al. (Citation2004) for Deuterium over 1939–2002 (though 0.42‰/°C with respect to δ18O were erroneously reported by the authors).
The calibrated isotope temperature record of CG is shown in together with the entire instrumental temperature record. A clear covariation of the long-term trends is revealed over the entire period, but interrupted by two remaining misfit periods around 1970 and 1850. Furthermore, in the early instrumental period (1760–1890), the δ18O trends are not reflected in the temperature-record, where only a very small trend is present, if at all. shows that when using high Alpine summer temperature lacking the latest early instrumental correction (Böhm et al., Citation2010), the centennial trends between isotope and instrumental data are in better agreement, leaving aside the 1850 delta excursion. In the latter, the isotope based temperature reconstruction indicates a decade warmer by about 0.8°C with respect to ΔT mod. This quite substantial discrepancy plays a central role for the weak long-term agreement seen in the 19th century between the proxy and instrumental temperature records. In this context we note that qualitatively, a similar maximum around 1850 is present in recent tree ring based temperature reconstructions (Corona et al., Citation2010).
Referring to the period 1760–1890, the overall mean of the isotope based temperature is 0.44°C larger than the value calculated from the EI-corrected instrumental temperature ΔT mod. It differs, however, not significantly with respect to the non-EI-corrected mean. Moreover, applying linear regression yields an overall temperature decrease rate from 1760 to 1890 of (−0.11±0.04), (−0.07±0.04) and (−0.54±0.04)°C/100a for the isotope temperature, ΔT mod and the temperature dataset lacking the EI correction, respectively. Note that the high isotope sensitivity of 1.6‰/°C, which directly enters the isotope based temperature trend, would need to be even larger in order to achieve a better agreement between the isotope and EI-corrected instrumental temperature trends.
The main reason for the systematic pre-1900 discrepancies within the three temperature records (see ) is not settled. Nevertheless, in view of the new isotope evidence, we cannot rule out that the correction applied for the early instrumental period for a warm bias in the summer temperatures is overestimated, at least, with respect to the high Alpine air temperature. On the other side, temperature reconstructions from front positions of Alpine glaciers (Leclercq and Oerlemans, Citation2012) and using Alpine tree rings and lake sediment proxies (Trachsel et al., Citation2012) suggest even colder temperatures around the mid-19th century compared to the EI-corrected ones (Böhm et al., Citation2010). All in all, we might interpret the degree of inconsistencies between the multidecadal temperature variability derived from the various instrumental and proxy sources as the remaining actual uncertainty level inherent to the Alpine air temperature records of the 19th century.
6. Conclusions
Investigations into the intercore variability of stable water isotope records obtained from four ice cores drilled on the Colle Gnifetti saddle revealed shared variance persistent for decadal and longer frequency components. Components above this frequency threshold are mostly found, however, buried in noise. This missing coherence on the multiyear scale is shown to be mainly a result of the large spatio-temporal variability of the net surface accumulation rate, which, in turn, is driven by the exceptionally strong snow erosion rate at this site. It seems questionable, therefore, that a single ice core from a small-scale mountain drilling site subject to substantial net snow erosion may allow for depicting representative isotope trends on the subdecadal time scale.
Aimed at comparing the composite isotope record with the instrumental data, we established a modified temperature time series expected to generally reflect the seasonal bias in the fresh snow conservation and thus to better match the isotope changes. This ice core adapted temperature record may differ significantly from the original HISTALP data on subdecadal periods while only minor deviations show up on the multidecadal scale. The same feature is seen for temperature series, being modified by daily precipitation weighting. We may conclude, therefore, that original instrumental temperature time series of the Alpine realm (commonly available at monthly resolution only) are well suited for comparison with precipitation related proxy records on longer time scales, but need to be adapted to the temporal precipitation pattern if decadal changes are evaluated.
We could demonstrate the decadal isotope variability being common to four ice cores to significantly co-vary with the air temperature record over the last 120 yr, though interrupted by three, multiyears periods of obvious mismatch. Attribution of their causes remained ultimately ambiguous, but points to changes in the seasonality of the net snow accumulation driven by distinct seasonal anomalies in insolation and air temperature. While the multidecadal isotope signal is found to portray the strong 20th century temperature changes rather faithfully, the correspondence to the long-term temperature variability of the early instrumental era (back to 1760) appears to be much less compelling. Although a great deal of this finding may be explained by the comparably weak long-term trends in the pre-1900 period, it remains unclear to what extent the less representative and less precise attribute of the early instrumental data might add to the poor isotope/temperature link. Particularly in the mid-19th century, marked by the maximum Alpine glacier extent, it is hard to reconcile the temperature calibrated isotope anomalies with the instrumental evidence showing about 0.8°C lower temperatures.
On the other hand, the overall agreement of our isotope temperature proxy with instrumental time series appears comparable to the performance of alternative climate proxies like Alpine tree ring series. Disregarding at this point any glaciological restrictions, this appraisal would allow, on first sight, for reconstructing useful long-term temperature changes from Colle Gnifetti ice cores. This attempt is still hampered, however by the peculiarly high isotope/temperature sensitivity. This restriction holds because a systematic strong temporal variation of the isotope calibration cannot be ruled out as long as the main reason for an isotope sensitivity as high as that is not clearly identified. This caveat calls for dedicated experimental and modelling attempts in order to fully exploit the climate water isotope archive of Colle Gnifetti.
Supplementary Material
Download PDF (535.4 KB)Acknowledgments
We greatly acknowledge the generous offer by Bernhard Stauffer and Thomas Stocker from the Physical Institute of University Berne to lend us their dedicated drill equipment. We particularly thank the chief driller Heinrich Rufli for his invaluable effort in all drilling campaigns. We thank numerous colleagues for their commitment regarding field work, ice core analyses and dating, in particular Susanne Preunkert, Rainer Weisshaar, Marc Armbruster and Hannes Konrad. We particularly acknowledge Ingeborg Levin for final editing and invaluable suggestions. Manfred Mudelsee and Christoph Mattula contributed significantly to various time series analysis. Our special thanks go to Ingeborg Auer for her long-term impetus in the Alpine climatology. We also would like to thank two anonymous reviewers for their thorough reviews and helpful suggestions. The work has been funded by the European Union under contract ENV4-CT97-0639 (project ALPCLIM), within the project ALP-IMP through grant EVK2-CT 2002-00148 and the German Science Foundation ‘Emmy Noether’-program Grant EI 672/5-1.
Notes
To access the supplementary material to this article, please see Supplementary files under Article Tools online.
Related Research Data
References
- Alean J , Haeberli W , Schädler B . Snow accumulation, firn temperature and solar radiation in the area of the Colle Gnifetti core drilling site (Monte Rosa, Swiss Alps): distribution patterns and interrelationships. Z. Gletscherkunde Glazialgeologie. 1983; 19: 131–147.
- Allen M. R , Smith L. A . Monte Carlo SSA: detecting irregular oscillations in the presence of colored noise. J. Clim. 1996; 9: 3373–3404.
- Auer I , Böhm R , Jurkovic A , Lipa W , Orlik A , co-authors . HISTALP – historical instrumental climatological surface time series of the Greater Alpine Region. Int. J. Climatol. 2007; 27: 17–46.
- Auer I , Böhm R , Jurkovic A , Orlik A , Potzmann R , co-authors . A new instrumental precipitation dataset for the greater alpine region for the period 1800–2002. Int. J. Climatol. 2005; 25: 139–166.
- Blass A , Grosjean M , Troxler A , Sturm M . How stable are 20th century calibration models? A high-resolution summer temperature reconstruction for the eastern Swiss Alps back to A.D. 1580 derived from proglacial varved sediments. Holocene. 2007; 17: 51–63.
- Bohleber P . Ground-Penetrating Radar Assisted Ice Core Research: The Challenge of an Alpine Glacier and Dielectric Ice Properties. 2011; Heidelberg, Germany: PhD thesis. University of Heidelberg.
- Böhlert R . Glaziologische Untersuchungen auf dem Colle Gnifetti und auf dem Mt. Blanc: Ermittlung der Eisdickenverteilung und interner Schichten mittels Georadar (Glaciological investigation on Colle Gnifetti and Mont Blanc: Detection of ice thickness and internal layers with ground-penetrating radar) . 2005; Zürich, Switzerland: Diploma thesis. Geographisches Institut der Universität Zürich.
- Böhm R , Auer I , Brunetti M , Maugeri M , Nanni T , co-authors . Regional temperature variability in the European Alps: 1760–1998 from homogenized instrumental time series. Int. J. Climatol. 2001; 21: 1779–1801.
- Böhm R , Jones P , Hiebl J , Frank D , Brunetti M , Maugeri M . The early instrumental warm-bias: a solution for long central European temperature series 1760–2007. Clim. Change. 2010; 101: 41–67.
- Brazdil R , Pfister C , Wanner H , von Storch H , Luterbacher J . Historical climatology in Europe – the state of the art. Clim. Change. 2005; 70: 363–430.
- Büntgen U , Frank D , Nievergelt D , Esper J . Summer temperature variations in the European Alps, A.D. 755–2004. J. Clim. 2006; 19: 5606–5623.
- Casty C , Wanner H , Luterbacher J , Esper J , Böhm R . Temperature and precipitation variability in the European Alps since 1500. Int. J. Climatol. 2005; 25: 1855–1880.
- Chaudhuri P , Marron J. S . SiZer for exploration of structures in curves. J. Am. Stat. Assoc. 1999; 94: 807–823.
- Chimani B , Böhm R , Matulla C , Ganekind M . Development of a longterm dataset of solid/liquid precipitation. Adv. Sci. Res. 2011; 6: 39–43.
- Christiansen B . Reconstructing the NH mean temperature: can underestimation of trends and variability be avoided?. J. Clim. 2010; 24: 674–692.
- Corona C , Guiot J , Edouard J. L , Chalié F , Büntgen U , co-authors . Millennium-long summer temperature variations in the European Alps as reconstructed from tree rings. Clim. Past. 2010; 6: 379–400.
- Efron B . The 1977 Riez lecture, bootstrap methods: another look at the jackknife. Ann. Stat. 1979; 7: 1–26.
- Efthymiadis D , Jones P. D , Briffa K. R , Auer I , Böhm R , co-authors . Construction of a 10-min-gridded precipitation data set for the Greater Alpine Region for 1800–2003. J. Geophys. Res. 2006; 111: D01105.
- Eichler A , Schwikowski M , Gäggeler H , Furrer V , Synal H.-A , co-authors . Glaziochemical dating of an ice core from upper Grenzgletscher (4200 m a.s.l.). J. Glaciol. 2000; 46: 507–515.
- Eisen O , Nixdorf U , Keck L , Wagenbach D . Alpine ice cores and ground penetrating radar: combined investigations for glaciological and climatic interpretations of a cold Alpine ice body. Tellus B. 2003; 55: 1007–1017.
- Elsässer C , Wagenbach D , Weller R , Auer M , Wallner A , co-authors . Continuous 25-yr aerosol records at coastal antarctica. Tellus B. 2011; 63: 920–934.
- Fischer H , Werner M , Wagenbach D , Schwager M , Thorsteinnson T , co-authors . Little ice age clearly recorded in Northern Greenland ice cores. Geophys. Res. Lett. 1998; 25: 1749–1752.
- Fisher D. A , Koerner R. M . Signal and noise in four ice-core records from the Agassiz Ice Cap, Ellesmere Island, Canada: details of the last millennium for stable isotopes, melt and solid conductivity. Holocene. 1994; 4: 113–120.
- Fisher D. A , Koerner R. M , Paterson W. S. B , Dansgaard W , Gundestrup N , Reeh N . Effect of wind scouring on climatic records from ice-core oxygen-isotope profiles. Nature. 1983; 301: 205–209.
- Fisher D , Osterberg E , Dyke A , Dahl-Jensen D . The Mt Logan Holocene–late Wisconsinan isotope record: tropical Pacific–Yukon connections. Holocene. 2008; 18: 667–677.
- Fisher D , Reeh N , Clausen H . Stratigraphic noise in time series derived from ice cores. Ann. Glaciol. 1985; 7: 76–83.
- Frank D , Büntgen U , Böhm R , Maugeri M , Esper J . Warmer early instrumental measurements versus colder reconstructed temperatures: shooting at a moving target. Quat. Sci. Rev. 2007; 26: 3298–3310.
- Fricke H , O'Neil J . The correlation between 18O/16O ratios of meteoric water and surface temperature: its use in investigating terrestrial climate change over geologic time. Earth. Planet. Sci. Lett. 1999; 170: 181–196.
- Glaser R , Riemann D . A thousand-year record of temperature variations for Germany and Central Europe based on documentary data. J. Quat. Sci. 2009; 24: 437449.
- Guiot J , Nicault A , Rathgeber C , Edouard J. L , Guibal F , co-authors . Last-millenium summer-temperature variations in Western Europe based on proxy data. Holocene. 2005; 15: 489–500.
- Haeberli W , Funk M . Borehole temperatures at the Colle Gnifetti core-drilling site (MonteRosa, Swiss Alps). J. Glaciol. 1991; 37: 37–46.
- Haeberli W , Schmid W , Wagenbach D . On the geometry, flow and age of firn and ice at the Colle Gnifetti core drilling site (Monte Rosa, Swiss Alps). Z. Gletscherkunde. Glazialgeologie. 1988; 24: 1–19.
- Hardy D. R , Vuille M , Bradley R. S . Variability of snow accumulation and isotopic composition on Nevado Sajama, Bolivia. J. Geophys. Res. 2003; 108: 4693.
- Hiebl J , Auer I , Böhm R , Schöner W , Maugeri M , co-authors . A high-resolution 1961–1990 monthly temperature climatology for the greater Alpine region. Meterol. Z. 2009; 18: 507–530.
- Hoelzle M , Darms G , Lüthi M. P , Suter S . Evidence of accelerated englacial warming in the Monte Rosa area, Switzerland/Italy. Cryosphere. 2011; 5: 231–243.
- Hoffmann G , Cuntz M , Jouzel J , Werner M , Aggarwal P. K , Gat J. R , Froehlich K. F. O . How much climatic information do water isotopes contain?. Isotopes in the Water Cycle. 2005; Netherlands: Springer. 303–320.
- Huss M , Funk M , Ohmura A . Strong Alpine glacier melt in the 1940s due to enhanced solar radiation. Geophys. Res. Lett. 2009; 36: 23501.
- Ilyashuk E , Koinig K , Heiri O , Ilyashuk B. P , Psenner R . Holocene temperature variations at a high-altitude site in the Eastern Alps: a chironomid record from Schwarzsee ob Sölden, Austria. Quat. Sci. Rev. 2011; 30: 176–191.
- Jackson J. D , Dunlevy J. A . Orthogonal least squares and the interchangeability of alternative proxy variables in the social sciences. J. R. Stat. Soc. Series D (The Statistician). 1988; 37: 7–14.
- Jenk T , Gäggeler H , Palmer A , Schwikowski M , Leuenberger M . Temperature reconstruction from the fiescherhorn 2002 ice core. Annual Reports of the Laboratory of Radiochemistry and Environmental Chemistry, PSI, Switzerland. 2004. Online at: http://lch.web.psi.ch/files/anrep04/30.pdf .
- Jenk T. M , Szidat S , Bolius D , Sigl M , Gäggeler H. W , co-authors . A novel radiocarbon dating technique applied to an ice core from the Alps indicating late Pleistocene ages. J. Geophys. Res. 2009; 114: D14305.
- Joerin U , Nicolussi K , Fischer A , Stocker T , Schlüchter C . Holocene optimum events inferred from subglacial sediments at Tschierva Glacier, Eastern Swiss Alps. Quat. Sci. Rev. 2008; 27: 337–350.
- Johnsen S , Clausen H , Cuffey K , Hoffmann G , Schwander J , co-authors . Diffusion of stable isotopes in polar firn and ice: the isotope effect in firn diffusion. In: Physics of Ice Core Records . 2000; Sapporo, Japan: Hokkaido University Press. 121–140.
- Jones P. D , Briffa K. R , Osborn T. J , Lough J. M , van Ommen T. D , co-authors . High-resolution palaeoclimatology of the last millennium: a review of current status and future prospects. Holocene. 2009; 19: 3–49.
- Jouzel J , Alley R. B , Cuffey K. M , Dansgaard W , Grootes P , co-authors . Validity of the temperature reconstruction from water isotopes in ice cores. J. Geophys. Res. 1997; 102: 26471–26487.
- Keck L . Climate Significance of Stable Isotope Records from Alpine Ice Cores. 2001; Heidelberg, Germany: PhD thesis. University of Heidelberg.
- Konrad H , Bohleber P , Wagenbach D , Vincent C , Eisen O . Determination of the age distribution of Colle Gnifetti, Monte Rosa, Alps, by combining ice cores, ground penetrating radar and a simple flow model. J. Glaciol. 2013; 59: 179–189.
- Leclercq P. W , Oerlemans J . Global and hemispheric temperature reconstruction from glacier length fluctuations. Clim. Dynam. 2012; 38: 1065–1079.
- Ljungqvist F. C . A new reconstruction of temperature variability in the extra-tropical northern hemisphere during the last two millennia. Geogr. Ann. Phys Geogr. 2010; 92: 339–351.
- Loehle C . A 2000-year global temperature reconstruction based on non-treering proxies. Energ. Environ. 2007; 18: 1049–1058.
- Lüthi M. P , Funk M . Dating ice cores from a high Alpine glacier with a flow model for cold firn. Ann. Glaciol. 2000; 31: 69–79.
- Mann M. E , Zhang Z , Hughes M. K , Bradley R. S , Miller S. K , co-authors . Proxy-based reconstructions of hemispheric and global surface temperature variations over the past two millennia. Proc. Natl. Acad. Sci. 2008; 105(36): 13252–13257.
- May B . Radiocarbon Microanalysis on Ice Impurities for Dating of Alpine Glaciers. 2009; Heidelberg, Germany: PhD thesis. University of Heidelberg.
- Mitchell T , Carter T , Jones P , Hulme M , New M . A comprehensive set of high-resolution grids of monthly climate for Europe and the globe: the observed record (1901–2000) and 16 scenarios (2001–2100). Tyndall Centre for Clim. Res. Working Paper. 2004; 55: 30.
- Mitchell T , Jones P. D . An improved method of constructing a database of monthly climate observations and associated high-resolution grids. Int. J. Climatol. 2005; 25: 693–712.
- Moberg A , Sonechkin D. M , Holmgren K , Datsenko N. M , Karlen W . Highly variable Northern Hemisphere temperatures reconstructed from low- and high-resolution proxy data. Nature. 2005; 433: 613–617.
- Mudelsee M . Estimating pearson's correlation coefficient with bootstrap confidence interval from serially dependent time series. Math. Geol. 2003; 35: 651–665.
- Mudelsee M . Climate Time Series Analysis: Classical Statistical and Bootstrap Methods. 2010; Dordrecht, Heidelberg, London, New York: Springer.
- Preunkert S , Legrand M , Wagenbach D . Sulfate trends in a Col du Dôme (French Alps) ice core: a record of anthropogenic sulfate levels in the European mid-troposphere. J. Geophys. Res. 2001; 106: 31991–32004.
- Preunkert S , Wagenbach D , Legrand L , Vincent C . Col du Dôme (Mt Blanc Massif, French Alps) suitability for ice-core studies in relation with past atmospheric chemistry over Europe. Tellus. 2000; 52B: 993–1012.
- Rozanski K , Araguas-Araguas L , Gonfiantini R . Relation between long-term trends of oxygen-18 isotope composition of precipitation and climate. Science. 1992; 258: 981–985.
- Rozanski K , Johnsen S. J , Schotterer U , Thompson L. G . Reconstruction of past climates from stable isotope records of palaeo-precipitation preserved in continental archives. Hydrolog. Sci. J. 1997; 42: 725–745.
- Rutherford S , Mann M. E , Osborn T. J , Briffa K. R , Jones P , co-authors . Proxy-based northern hemisphere surface temperature reconstructions: sensitivity to method, predictor network, target season, and target domain. J. Clim. 2005; 18: 2308–2329.
- Schöner W , Auer I , Böhm R , Keck L , Wagenbach D . Spatial representativity of air-temperature information from instrumental and ice-based isotope records in the European Alps. Ann. Glaciol. 2001; 35: 157–161.
- Schotterer U , Bürki H , Stichler W , Graf W , Gourcy L , co-authors . Alpine ice cores: do they record climate variability?. Conference on the Study of Environmental Change Using Isotope Techniques, IAEA. 2001; April. Austria: Vienna. 23–27.
- Schwikowski M . Reconstruction of European air pollution from Alpineice cores . 2004; 95–119. Earth Paleoenvironments: Records Preserved in Mid- and Low-Latitude Glaciers (eds. L. DeWayne Cecil, J. R. Green and L. G. Thompson), Springer, Netherlands.
- Shumskii P . Principles of Structural Glaciology Shumskii, P. 1964; Dover, Mineola, New York: Dover Publications.
- Siegenthaler U , Oeschger H . Correlation of 18O in precipitation with temperature and altitude. Nature. 1980; 285: 314–317.
- Spötl C , Burns S. J , Frank N , Mangini A , Pavuza N . Speleothems from the High-Alpine Spannagel Cave, Zillertal Alps (Austria). Dortrecht, Kluwer. 2004; 243–256.
- Sturm C , Zhang Q , Noone D . An introduction to stable water isotopes in climate models: benefits of forward proxy modelling for paleoclimatology. Clim. Past. 2010; 6: 115–129.
- Thompson L. G , Davis M. E , Lin P.-N , Henderson K , Mashiotta T. A . Tropical glacier and ice core evidence of climate change on annual to millennial time scales. Clim. Change. 2003; 59: 137–155.
- Trachsel M , Kamenik C , Grosjean M , McCarroll D , Moberg A , co-authors . Multi-archive summer temperature reconstruction for the European Alps, AD 1053–1996. Quat. Sci. Rev. 2012; 46: 66–79.
- von Grafenstein U , Erlenkeuser H , Brauer A , Jouzel J , Johnsen S . A Mid-European decadal isotope-climate record from 15.500 to 5.000 years B.P. Science. 1999; 284: 1654–1657.
- Wagenbach D , Oeschger H , Langway C. C Jr . Environmental records in Alpine glaciers. The Environmental Record in Glaciers and Ice Sheets. 1989; New York: John Wiley and Sons. 69–83.
- Wagenbach D , Haeberli W , Stauffer B . Special problems of mid-latitude glacier ice-core research. Greenhouse gases, isotopes and trace elements in glaciers as climatic evidence of the holocene. 1992. Vol. Arbeitsheft Nr.14 of Report of the ESF/EPC Workshop, Zürich 27–28 October 1992 Versuchsanstalt für Wasserbau, Hydrologie und Glaziologie der Eidgenössischen Technischen Hochschule Zürich.
- Wagenbach D , Bohleber P , Preunkert S . Cold alpine ice bodies revisited: what may we learn from their isotope and impurity content?. Geogr. Ann. Phys. Geogr. 2012; 94: 245–263.
- Wagner S . Dreidimensionale Modellierung zweier Gletscher und Deformationsanalyse von eisreichem Permafrost. 1996; Zürich, Switzerland: Eidgenössische Technische Hochschule Zürich. PhD thesis. Versuchsanstalt für Wasserbau, Hydrologie und Glaziologie der ETH Zürich.
- Werner M , Heimann M . Modeling interannual variability of water isotopes in Greenland and Antarctica. J. Geophy. Res. Atmos. 2002; 107: 4001.
- Wild M , Gilgen H , Roesch A , Ohmura A , Long C. N , co-authors . From dimming to brightening: decadal changes in solar radiation at earth's surface. Science. 2005; 308(5723): 847–850.
- Wilhelms F . Leitfähigkeits- und Dichtemessung an Eisbohrkernen. Berichte zur Polarforschung [Measuring the Conductivity and Density of Ice Cores] . 1996; 191: 1–224.
- Zemp M , Paul F , Hoelzle M , Haeberli W , Orlove B , Wiegandt E , Luckman B . Glacier fluctuations in the European Alps 1850–2000: an overview and spatio-temporal analysis of available data. The Darkening Peaks: Glacial Retreat in Scientific and Social Context. 2008; Los Angeles: University of California Press. 152–167.