Abstract
We examined if precipitation had recovered from acidification in Guangzhou, the third biggest city in China, and if sulphur deposition in precipitation had decreased, and to what extent if yes, following abatement strategies in sulphur dioxide (SO2) emission and energy use implemented since 2001. SO2 emissions were decreasing steadily since 2001, but a marked recovery of precipitation acidity occurred only since 2005; precipitation pH values decreased from 4.65 in 2001 to 4.34 in 2005 and then increased to 5.08 in 2010, while in the same period acid rain (pH<5.6) frequency increased from 70% to 81% and then decreased to 48%. During this period, the change in pH value and sulphate concentration more reflected the patterns of SO2 emission at provincial and national scales than at the local scale, suggesting that precipitation chemical composition was largely controlled by the emissions of pollutants from surrounding areas of the study city. Since 2001, sulphate deposition in precipitation decreased significantly (by 40%) but nitrogen deposition remained unaltered. More importantly, the current sulphur (43 kg S ha−1 yr−1 as sulphate) and nitrogen depositions (35 kg N ha−1 yr−1 as ammonium plus nitrate in 2010) were still among the highest in China. These results highlight the fact that ambient sulphur and nitrogen deposition still pose a threat to the health of both terrestrial and aquatic ecosystems. Precipitation may become more acidified in the future because the deposition of alkaline dusts containing calcium is also likely to decrease with stricter SO2 emission control policy and reduced construction activities. Additionally, we recommend that a reduction of emissions of nitrogen and chlorine bearing pollutants is urgently required for complete control on acid deposition.
1. Introduction
Associated with the rapid development of the economy, acid rain (with pH<5.6) in China has increasingly received concern since the 1980s, due to its adverse impacts on vegetation and aquatic environments (Larssen et al., Citation1999; Hao et al., Citation2001; Zhao et al., Citation2009). Sulphur dioxide (SO2) is a precursor of sulphuric acid and sulphate aerosol and a main contributor to acid rain. The anthropogenic SO2 emission in China is of national and international concern; it has contributed to about 25% of the global inventory, more than 50% of Asia inventory and 90% of East Asia inventory since the 1990s (Streets et al., Citation2000; Ohara et al., Citation 2007; Lu et al., Citation2010; Smith et al., Citation2011). Furthermore, the sulphur-containing air pollutants (e.g. sulphate) emitted in Asia can be transported long distances to the Northwestern Pacific region, North America and the rest of the northern hemisphere, as indicated from both model simulation (Lin et al., Citation2008; Osada et al., Citation2009; Aikawa et al., Citation2010) and from field experiments, for example, ACE-Asia (Huebert et al., Citation2003), TRACE-P (Jacob et al., Citation2003) and INTEX-B (Singh et al., Citation2009).
In order to reduce SO2 emissions and their subsequent impacts on human health and natural ecosystems, the Chinese government has implemented several policies since 2001 (Liu et al., Citation2013; Wang et al., Citation2013). Although there is a growing body of reports showing the present-day situations on precipitation chemical composition in both urban and rural regions throughout China (Wai et al., Citation2005; Larssen et al., Citation2006; Aas et al., Citation2007; Zhang et al., Citation2007; Huang et al., Citation2010; Wang and Han, Citation2011; Li et al., Citation2012), to our knowledge, in China very few studies so far have addressed the long-term patterns of acid rain, N and S deposition, particularly after the policy of SO2 emission abatement was put into effect. Some pressing questions remain unanswered. For example, has acid rain been reduced through the nationally implemented reduction of SO2 emissions? Is the present reduction in SO2 emission sufficient for recovery from acid rain and soil acidification? Will other pollutants, like N-bearing compounds, control rain acidity in the future?
To address those issues mentioned above, we selected Guangzhou city in southern China (China's third biggest city) as a pilot study for characterising the current status of acidity, deposition of inorganic N ( plus
) and S (
) in precipitation and their long-term changes since 1983. Specifically, we examined if precipitation in this study city had recovered from acidification and if S deposition in precipitation had decreased, and to what extent if yes, following abatement strategies in SO2 emission and energy use implemented since 2001. To this end, we compared the current observations at four monitoring sites during the period of 2001–2010 with historical records since 1983. The results from this study will thus contribute to the understanding of how precipitation chemistry respond to the changes in the emissions of N and S pollutants to the atmosphere in southern China, which is required for both policy makers and scientific communities in order to reduce emissions, to evaluate effectiveness of the abatement strategy of SO2 emissions on precipitation chemistry and air quality, and to assess its potential effects on terrestrial and aquatic ecosystems.
2. Methodology
2.1. Sites description
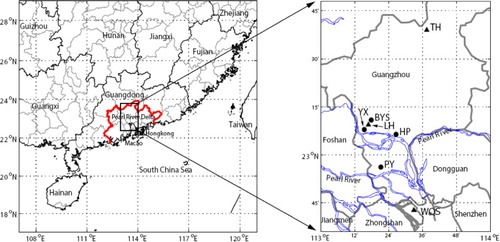
The study city, Guangzhou (112°57′–114°3′E, 22°26′–23°56′N), is the capital of Guangdong Province and is located in the Pearl River Delta (). The PRD region, encompassing nine major cities (Guangzhou, Foshan, Shenzhen, Zhongshan, Zhuhai, Jiangmen, Huizhou and Zhaoqing), experienced remarkable economic development and urbanisation during the past three decades, and is now one of China's main industrial centres as well as a megacity cluster. Guangzhou covers an area of 7434 km2, with a population of more than 10 million as of 2010. The downtown area of Guangzhou city is about 60 km north of the Pearl River Estuary (). The anthropogenic emissions of SO2 and NOx in the PRD region for the year 2006 were estimated to be 711 and 892 kilotons, respectively, of which 21% and 26% were emitted from Guangzhou (Zheng et al., Citation2009). Power plant, transportation and industry were the three largest contributors, together making up about 90% of the total emissions (Wang et al., Citation2005; Zheng et al., Citation2009). The concentrations for some air pollutants have apparently changed during rapid urbanisation since 1980 (Wang et al., Citation2009a, Citationb).
Fig. 1 Locations of four precipitation chemistry monitoring sites since 1994 (close cycle symbols, YX, BYS, HP and PY) and three air quality monitoring sites since 1986 (triangle symbols) in Guangzhou, Southern China. The boundary for the Pear River Delta (left panel) and for the rivers (right panel) is coloured in red and blue, respectively.
2.2. Precipitation collection and chemical analysis since 2001
Four sites were established to monitor chemical composition of precipitation in this city since 1992 (), i.e., Guangzhou Environmental Monitoring Centre in Yuexiu District (YX in short hereafter), Baiyun Mountain in Baiyun District (BYS), Huangpu Environmental Monitoring Station in Huangpu District (HP) and Panyu Environmental Monitoring Station in Panyu District (PY). Site YX is surrounded by commercial complexes and city main roads with heavy traffic. This site thus represents typical urban conditions. Site BYS is located at a building (Guanyunge) on the top of Baiyun Mountain with an altitude of 300 m above sea level. This site is about 7 km north of the Guangzhou urban centre and represents a suburban forest site. Site HP is located on the rooftop of the building of Huangpu Environmental Monitoring Station, in close proximity to an industrial centre in the east of Guangzhou with many large power plants and petrochemical factories situated. Site PY is located on the rooftop of the building of Panyu Environmental Monitoring Station. Panyu District is a satellite city of Guangzhou with a relatively smaller population and less industrial activities. This site lies about 27 km south of the Guangzhou urban centre and about 34 km northwest of the Pearl River Estuary, representing a suburban site (). Sites YX, HP and PY are state-controlled sites of the acid rain monitoring network in China, and site BYS is a city-controlled site.
From 2001 to 2010, rain samples were automatically collected on the basis of rain events using automatic precipitation samplers. In total, 2499 samples were collected from the four monitoring sites. Acidity (pH) was measured immediately after collection, and the precipitation samples were then sent to the laboratory in Guangzhou Environmental Monitoring Centre for later analysis of ions by ion chromatography. Of these precipitation samples, 2481 samples had been determined for concentrations of major cations and ions. We checked the quality of analytical data by a cation–anion balance (R1) and by comparison of measured conductivity with the conductivity calculated from the concentration of all measured ions (R2), similar to quality assurance/quality control program for wet deposition monitoring in East Asia adopted by Acid Deposition Monitoring Network in East Asia (EANET, http://www.eanet.cc/product/qaqc/qaqcwet.pdf). R1 and R2 were calculated using the following equations.1
where C and A are total cation (C) equivalent concentration (sum cations, µeq L−1) and total anion (C) equivalent concentration (sum anion, µeq L−1), respectively.2
where Λcalc and Λmeas are calculated EC (Λcalc, mS m−1) and measured EC (mS m−1), respectively.
In the present study, almost all samples (99.9%) had C+A of greater than 100 µeq L−1. Usually, data with±8% of R1 were accepted when C+A>100 µeq L−1 in data quality control, for example, at EANET. However, the adoption of such criteria would exclude 60% of the data (not shown). The adoption of the required criteria for R2 of ±9% and ±13% when Λmeas is >3 mS m−1 and between 0.5 and 3 mS m−1, respectively, would exclude about one third of the data (not shown), suggesting that these criteria are not suitable for our study city with strong air pollution. Instead, to be consistent with the data quality control conducted for the period before 2001, we removed three samples from further statistical analysis for our dataset (2001–2010), since the concentrations for those three samples were extremely high (sum ion concentrations>20 000 µeq L−1) and R1 were obviously deviated from the 1:1 lines (not shown). This was supported by the fact that the regression linear lines (sum anions=1.004×sum cations, R2=0.89, P<0.0001 for sum ion; measured EC=1.108×calculated EC, R 2=0.89, P<0.0001) were quite close to the 1:1 lines (not shown).
2.3. Previous data sources for 1983–2000
In the study city, monitoring of acid rain started at the end of 1982 (Huang et al., Citation1999) with 13 monitoring sites. In 1984, this was adjusted to nine sites. Since 1992, four representative monitoring sites described above have been remained active (Huang et al., Citation1999). From 1983 to 1985, only the pH value was measured for precipitation. Starting from 1986, pH, major cations (, Ca2+, Mg2+, Na+ and K+) and anions (
,
, F− and Cl−) were determined for all precipitation samples. In this study, data for precipitation chemistry before 2001 were derived from published papers (1986–1990 from Quan et al., Citation1992; 1991–2000 from Ye et al., Citation2008).
In previous publications, only volume–weight mean (VWM) concentrations and pH values over all sites were presented. Thus, for the period 1986–2000, annual deposition was calculated by reported VWM concentrations (Quan et al., Citation1992; Ye et al., Citation2008) multiplying mean annual precipitation in Guangzhou. To constrain the uncertainty on calculating the annual N and S deposition in this period, we calculated the N and S deposition for the period 2001–2010 by two methods. One method was the same as used for the period 1986–2000, the other method was to calculate annual flux for each site and to average them (see below). We found that the two calculations yielded very similar results. For example, when averaged for all four sites, the results by the former method were lower by 1%–5% than those by the latter method for S and N deposition. This suggests that the method seems to be a reasonable approach for the period before 2001.
2.4. Statistical analysis
Correlation analysis with the two-tail significance test was used to examine the relationships between variables. The trend analysis was performed by using a least-squares linear and quadratic regression approach to the non-normalised raw data (for pH, acid rain frequency, and both mean annual weighted concentrations and depositions). All analyses were conducted using PASW Statistics 18.0 for Windows. Statistically significant differences were set at P values<0.05 unless otherwise stated.
3. Results and discussion
3.1. Temporal changes since 2001
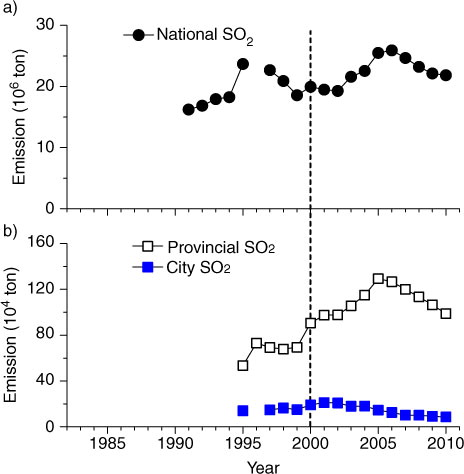
Although several policies have been implemented to reduce SO2 emissions since 2001, the national SO2 emissions during the first five years (10th Five-Year Plan) actually increased by 28%, from 19.9 Tg in 2001 to 25.5 Tg in 2005 (a), due in part to a lag of installing flue gas desulphurisation (FGD) and phasing out small inefficient units in the power sector. In 2006, China's Ministry of Environmental Protection (MEP) reaffirmed its commitment and resolved to cut the national SO2 emissions in its 11th Five-Year Plan (2006–2010) by 10% (i.e., to 22.9 Tg in 2010), relative to the 2005 level. As a result, in 2010 the SO2 emissions (21.8 Tg) decreased by 14% against the 2005 level (a). SO2 emissions in Guangdong province exhibited a pattern similar to that in the nation; SO2 emissions increased by 33% in 2005 relative to that in 2001 and were reduced to the 2001 level in 2010 (b). In Guangzhou city, however, SO2 emission decreased more substantially, with a rate of 7% per year since 2001; annual emissions in 2010 were reduced by 60% compared to the maximum recorded in 2001 and by 40% compared to the level in 2005 (b).
Fig. 2 Annual emissions of SO2 in (a) China and (b) Guangdong Province and Guangzhou city. Data are from Report on the State of the Environment in China (http://jcs.mep.gov.cn/hjzl/zkgb/) for SO2 emissions in China, from Guangzhou Statistical Yearbook (http://data.gzstats.gov.cn/gzStat1/chaxun/njsj.jsp) for SO2 and from Guangdong Environmental Quality Report (http://www.gdepb.gov.cn/hjzlyxx/hbzkgb/200906/t20090615_62862.html) for SO2 emissions in Guangdong province. The dash line indicates when the policy of SO2 emission abatement started. In Guangzhou, SO2 emissions were reduced since 2001.
Annual mean pH values in the study city, however, showed a decrease from 4.65 in 2001 to 4.34 in 2005, and thereafter a marked increase to 5.08 in 2010 (a). Monthly mean pH values also displayed the same trend over this time period (a). Correspondingly, acid rain frequency showed an opposite trend, i.e., increased to 83% in 2005 from 68% in 2001 and decreased to 48% in 2010 (b). Acid rain frequency was reversely correlated with annual mean precipitation pH, as evidenced by high and negative correlation between these two variables (R 2=0.82, P<0.001, n=10). These results clearly indicate that a recovery from acid deposition occurred only since 2005 ().
Fig. 3 Annual precipitation (a) pH value, (b) acid rain frequency and (c) precipitation in Guangzhou city since 1983. Mean of four monitoring sites and standard error of mean are presented for the period of 2001–2010. The dash line indicates when the policy of SO2 emission abatement started. In Guangzhou, SO2 emissions were reduced since 2001.
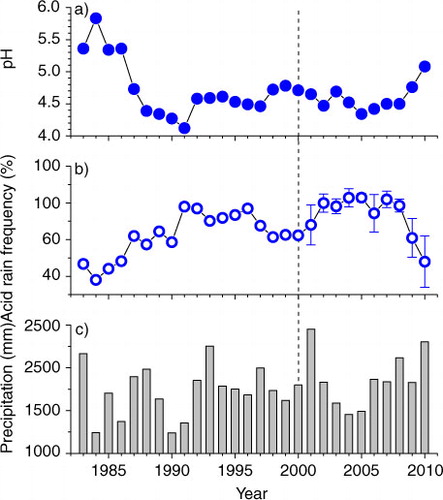
Fig. 4 Monthly mean (a) pH values and (b) precipitation amount in Guangzhou city since 2001.
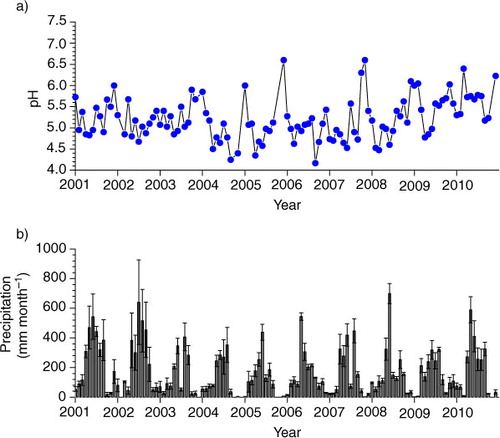
Why did not precipitation pH increase constantly following constant reduction in SO2 emission in the study city? Was the change in precipitation pH over time caused by the change in precipitation amount (b)? In general, precipitation has a strong dilution effect on ion concentrations, as demonstrated by Huang et al. (Citation2009) for the study city. In the present study, we also see such a dilution effect when analysed across all samples (not shown). However, this dilution effect exists for both acidifying ions and neutralising ions in precipitation. Therefore, if annual precipitation is high, we may not expect an increase in precipitation pH due to the dilution effect, because pH reflects the balance of total anions and total cations. This can be supported by our results. First, we find no correlation between precipitation pH and precipitation amount across all samples over the study period (not shown). Second, within a year, precipitation pH was low in rainy season (April–September) while high in dry season (October–March, ), suggesting that low pH in rainy seasons was caused by more acidifying pollutants than neutralising pollutants in precipitation. Thus, the dilution effect cannot explain the precipitation pH change over time.
We examine if precipitation acidity reflected the change patterns of air pollutants over the period since 2001, because precipitation can scavenge air pollutants. The concentrations of all pollutant species exhibited a similar temporal pattern, increased and then decreased, with the exception of NOx concentration, which significantly decreased with time ( and ). However, the concentrations of these species started to decline more early than SO2 emissions in Guangdong. Also, we find no relationship between annual mean precipitation pH and annual mean air concentrations of any pollutants in Guangzhou. This result suggests that precipitation acidity in the study city was not controlled by local emissions of air pollutants. Therefore, we speculate that precipitation acidity was more controlled by the emissions of pollutants from surrounding areas of the study city than by local emissions.
Fig. 5 Long-term trends of annual mean concentrations of major air pollutants in Guangzhou city (three sites in ) since 1986. The dash line indicates when the policy of SO2 emission abatement started. In Guangzhou, SO2 emissions were reduced since 2001. Data were supplied by Guangdong Environmental Monitoring Center.
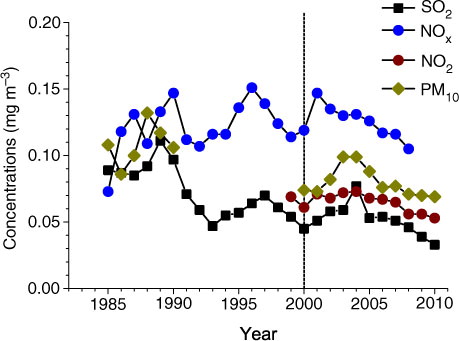
Table 1. Temporal patterns of annual SO2 emissions and annual mean concentrations of major air pollutants
To confirm the above speculation, we link the changed precipitation pH over time in our study city to the changes in SO2 emissions both in the study city and in Guangdong Province. The results support our speculation. We find that the changes in precipitation acidity and acid rain frequency in Guangzhou since 2001 appear to better mimic the pattern of SO2 emissions in Guangdong Province rather than the pattern in Guangzhou (). During the period 2001–2010, annual mean pH values were negatively correlated with SO2 emission rates in Guangdong Province (R 2=0.44, P=0.04, n=10), but not with the emission rates in the study city (R 2=0.10, P=0.38, n=10). This result supports our speculation that precipitation chemistry seems be largely controlled not by local SO2 emissions in the study city, but by the SO2 emission patterns on a larger, provincial scale (e.g. the SO2 emissions imported from neighbouring big cities in the south to Guangzhou, such as Shenzhen, Dongguan, Zhongshan and Jiangmen, ). This is consistent with back trajectory analysis of NOAA HYSPLIT model, which showed that 62% and 69% of precipitation in 2008 and 2009 were of marine origin, respectively, most of which were transported from the south to Guangzhou city and passed over those former mentioned cities (Fang et al., Citation2011b).
To further confirm our speculation, we link precipitation acidity to each ion species to examine if the change in precipitation concentration associated with SO2 emissions was the main controlling ion. Correlation analysis showed that among all ion species, annual mean precipitation pH values were significantly related to
concentration only (R
2=0.43, P=0.038, n=10, and 6), suggesting that
was the strongest controller in precipitation acidity in the study city. As observed in many cities in China (Yang et al., Citation2004; EANET, Citation2010), our results showed that
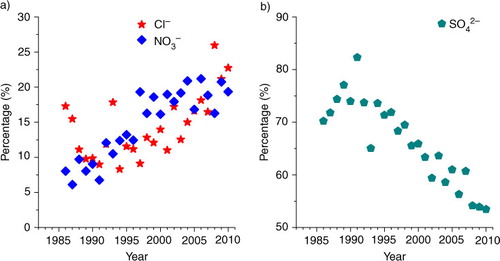
was predominant in anions and explained 53%–64% of total anion equivalents (b). Similar to the acidity in precipitation, we find that
concentration in precipitation did not decrease immediately following the reduction of SO2 emission since 2001 in the study city (b). Rather, we found that
concentration increased since 2001 until 2005 and then decreased when examining both annual mean concentrations (b and ) and monthly mean concentrations over time (d, R
2=0.10, P<0.001, n=113), consistent with the changes in the SO2 emissions at the provincial (Guangdong) and national scales (). Further analysis indicated that the correlation of annual mean
concentration and SO2 emissions in Guangdong across the period of 2001–2010 was marginally significant (R
2=0.36, P=0.07, n=10), while the correlation of annual mean
concentration and SO2 emissions in Guangzhou was not (R
2=0.43, P=0.04, n=10).
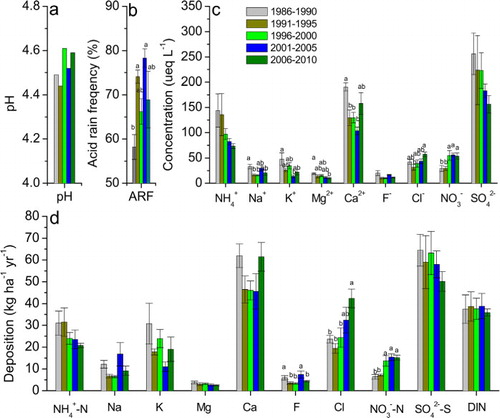
Fig. 6 Long-term trends of annual mean concentrations of major (a) cations and (b) anions in precipitation in Guangzhou city since 1986. Mean of four monitoring sites and standard error of mean are presented for the period of 2001–2010. The dash line indicates when the policy of SO2 emission abatement started. In Guangzhou, the rate of SO2 emissions has reduced since 2001.
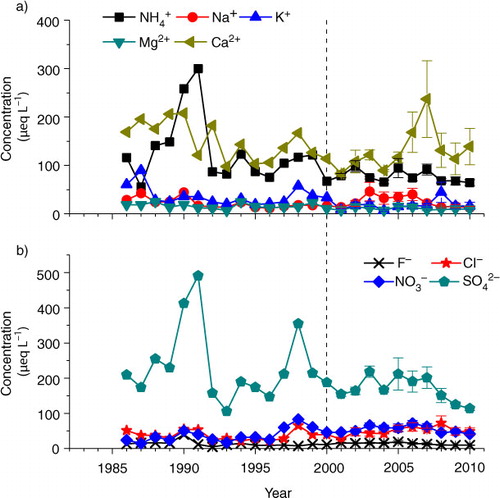
Fig. 7 Monthly mean concentrations of (a) , Na+, K+, (b) Mg2+, Ca2+, (c) F−, Cl−, and (d)
,
in precipitation in Guangzhou city since 2001.
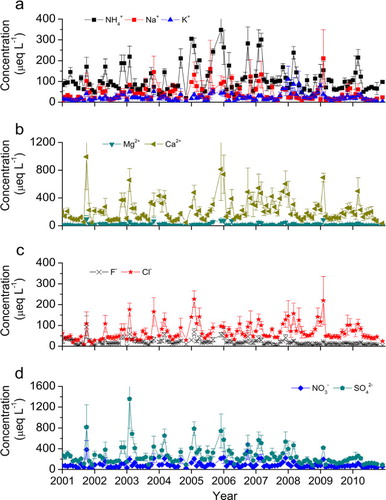
Table 2. Temporal patterns of precipitation chemistry since 2001a
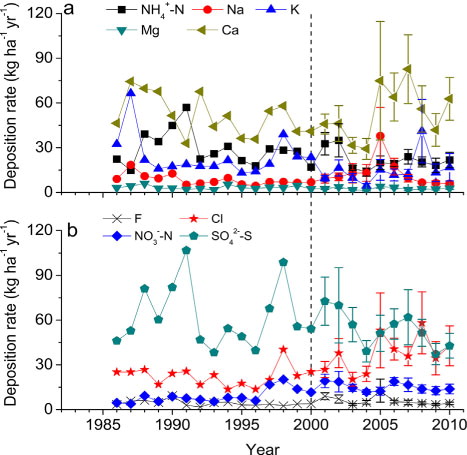
During the period 2001–2010, unlike concentration (b and 7d), annual
deposition (shown as
–S deposition), as we expected, decreased with time during this period, albeit with a large inter-annual variability ranging from 37 to 73 kg S ha−1 yr−1 (b and ). S deposition in precipitation did not reflect the patterns of SO2 emission rates in Guangdong and in China, but more reflected the pattern of SO2 emission in Guangzhou city (). The relationship of
[sbnd]S deposition and SO2 emission in Guangzhou city was marginally significant (R
2=0.33, P=0.08, n=10), indicating that decreased
[sbnd]S deposition should be partially attributed to the reduced SO2 emissions in the study city (b).
Fig. 8 Long-term trends of annual deposition rates of major (a) cations and (b) anions in precipitation in Guangzhou city since 1986. Mean of four monitoring sites and standard error of mean are presented for the period of 2001–2010. The dash line indicates when the policy of SO2 emission abatement started. In Guangzhou, the rate of SO2 emissions has reduced since 2001.
Collectively, our results showed that in the study city, SO2 emissions have been decreasing steadily since 2001, but a marked recovery of precipitation acidity occurred only since 2005. The change in precipitation acidity over the period 2001–2010 was mainly controlled by total SO2 emissions from the surrounding areas of the study city, not by local emissions within the study city or by the changes in annual precipitation amounts. The reduction in local SO2 emissions might have, to a certain degree, facilitated to reduce the S deposition in precipitation.
The temporal patterns of annual deposition rates during the period 2001–2010 were not clear for all ion species other than ( and ), although annual mean concentrations of Na+,
and F− ( and ) and monthly concentrations of all other ions increased then decreased over the same time period, with the exception of Mg2+ concentration (R
2=0.03–0.14,
P<0.001 to=0.05 except Mg2+ for which R
2=0.008, P=0.24, n=113, ).
Fig. 9 Five-year means of (a) pH, (b) acid rain frequency, (c) concentrations and (d) annual deposition rates of major cations and anions in precipitation in Guangzhou city since 1986. n=5. Different letters indicate significant differences between periods obtained by one-way ANOVA.
3.2. Long-term changes since 1983
To assess the effectiveness of reducing SO2 emissions on precipitation chemistry, we combined the results from last five years and compared the observations with historic records (). Moreover, we performed regression analysis to see the long-term trends over time since 1986 (for pH and acid rain frequency since 1983, ). In general, we found that the five-year means in 2005–2010 were not significantly different from the previous periods, except Cl and [sbnd]N deposition, which were significantly higher than those in 1986–1990 and 1991–1995 (d).
Table 3. Long-term patterns of precipitation chemistry since 1983a
Across the whole study period since 1986, annual mean precipitation pH values showed a decrease then an increase while acid rain frequency showed the reverse trends ( and ). The annual mean concentrations of , K+, Mg2+ and
decreased while those of Cl− and
increased ( and ). The long-term trends were not significant for deposition rates except
[sbnd]N and F−, which showed an increase and later a decrease ( and ). Annual mean
concentration was significantly correlated with annual mean pH, with annual mean concentrations of
and F− ( and 6).
Table 4. Current status of pH, S and N deposition in precipitation in Guangzhou, in comparison with other Chinese cities
3.3. Current status in comparisons with other regions
Precipitation pH values in Guangzhou city (in 2010) are slightly higher than that in many other cities in southern China such as Xiamen, Shanghai, Chongqing and Zhuhai but are obviously lower than the cities in northern China such as Beijing, Xi'an and Zhengzhou (). Compared with cities in neighbouring countries, the pH values are slightly higher than the averages for Southern Korean (4.70, Lee et al., Citation2000) and Japan (4.52, Okuda et al., Citation2005), but are much lower than that of Northern India (6.80, Mouli et al., Citation2005).
Current annual –S deposition in precipitation observed here is among the highest in Chinese cities (43 kg S ha−1 yr−1 in 2010, ). S deposition in Guangzhou is approximately three times that in Xiamen (). A range of 14–30 kg S ha−1 yr−1 in precipitation was reported for four forest sites of IMPACT (Tieshanping in Chongqing, Caijiatang in Hunan, Leigongshan in Guizhou, Liuxihe in Guangdong) in southern China (Larssen et al., Citation2011).
The DIN deposition rate in our study city (35.5 kg N ha−1 yr−1 in 2010, ) is also higher than those in many other cities; for example, DIN deposition is 7–30 kg N ha−1 yr−1 in Beijing, Xi'an, Zhengzhou, Shanghai, Xiamen and Zhuhai (), and higher than those in agriculture areas, for example, in Jiangsu province (27 and 24 kg N ha−1 yr−1, Yang et al., Citation2010) and Taihu Lake (28 kg N ha−1 yr−1, Xie et al., Citation2008), higher than those in rural areas in Guangdong Province (<18 kg N, Chen and Mulder, Citation2007; Fang et al., Citation2011c). However, similar rates or even higher rates of DIN deposition than in Guangzhou have also been reported in many other cities or in agriculture areas in China. DIN deposition of higher than 30 kg N ha−1 yr−1 has been found at four (two in Beijing, one in Huiming of Shangdong province and one in Fenghua of Zhejiang, 30–39 kg N ha−1 yr−1) of 15 sites across China (Zhang et al., Citation2008), at Dinghushan in Guangdong (32 kg N ha−1 yr−1, Fang et al., Citation2008), and at a site in an urban area of Zhangzhou city in Fujian province (37 kg N ha−1 yr−1, Xiao et al., Citation2005).
The DIN deposition rates have been monitored to be 2–3 kg N ha−1 yr−1 in some remote areas in China (Liu et al., Citation1993) and 1 kg N ha−1 yr−1 in Hawaiian islands (Carrillo et al., Citation2002). Across the four sites in Guangzhou city, DIN deposition of approximately 37 kg N ha−1 yr−1 was 10–30 times the background levels mentioned above. The DIN deposition in the study city is three times the mean DIN deposition throughout China (Lu and Tian, Citation2007), about twice the average rate (17 kg N ha−1 yr−1) across 31 forest sites in the past two decades compiled by Fang et al. (Citation2011a) and 62% higher than the average rate of DIN (20 kg N ha−1 yr−1) across 15 monitoring sites throughout China (Zhang et al., Citation2008). One important implication is that such high DIN deposition in Guangzhou city (18–65 kg N ha−1 yr−1, b) can be an important N source bio-available to terrestrial and aquatic ecosystems therein and that elevated N deposition is mainly caused by increased human activities associated with industrialisation, urbanisation and intensified agriculture. Currently, the average DIN deposition in Guangzhou city is much higher than 25 kg N ha−1 yr−1, the threshold above which elevated N leaching has always been observed in the temperate and boreal forests in Europe (Gundersen et al., Citation2006).
In the present study, made up on average 61% of DIN deposition in Guangzhou (). The proportion of
is lower than the national level of 72% synthesised by Lu and Tian (Lu and Tian, Citation2007) and the mean level of 68% at 31 forest sites in China (Fang et al., Citation2011a), and also lower than that in two Chinese remote sites (73% at Linzhi, Jia et al., Citation2009 and 86% at Waliguan, Tang et al., Citation2000). However,
is still the more dominant N form in our study city than national levels in the U.S. (47%, Holland et al., Citation2005) and mean level at 12 Japanese EANET sites (48%, EANET, Citation2010). Compared with other large Chinese cities such as Beijing, Xi'an, Zhengzhou, Shanghai, Chongqing and Xiamen, where
accounted for 62%–80% of DIN (), the percentage of
is lower in Guangzhou. This fact points to the increasing importance of
in N deposition in the study city and to the need for more concern about the changes in N sources to the atmosphere associated with industrial development.
3.4. Implications for acid deposition control
Our results clearly demonstrated a marked recovery of precipitation from acidification since 2005. For example, in 2010 precipitation pH was 0.7 pH units higher than that in 2005, and acid rain frequency dropped to 48% from 81% in 2005. concentration and deposition decreased by 46% and 16%, respectively. However, current precipitation pH values (in 2010) were still low (on average 5.08), although it was at its highest since 1987 (4.12–4.78, a). Precipitation pH values were between 5.34 and 5.83 during the period from 1983 to 1985 (a), suggesting slight or no pollution in that period (several years after the Chinese economic reform started in December 1978). These values were about one pH unit higher than the pH values during the 1990s and 2000s (a). The frequency of acid rain significantly decreased since 2005, but was still about 50% (b).
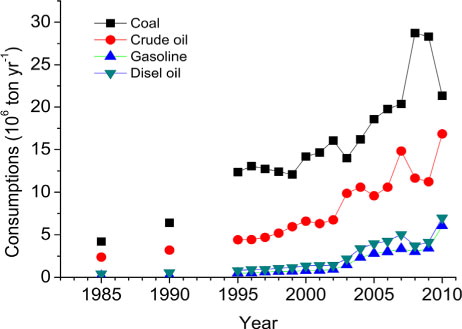
Additionally, current S deposition of 43 kg S ha−1 yr−1, despite having decreased by 40% compared to 2001 since the policy of SO2 emission abatement started, remained among the highest in China (b and ) and approximately three times the target loading (14–16 kg S ha−1 yr−1) suggested as an upper limit for the prevention of biological and chemical damage to aquatic ecosystems (Gorham et al., Citation1984; Posch, et al., Citation2012) and the critical load for soil acidification in most areas of the study region (16 kg S ha−1 yr−1), according to the research of Zhao et al. (Citation2009). Combined with increasing coal consumption (), these results point to the requirement for continued and more stringent abatement policies.
Fig. 10 Fuel consumptions in Guangzhou city from 1985 to 2009. Data are from Guangzhou Statistical Yearbook (http://data.gzstats.gov.cn/gzStat1/chaxun/njsj.jsp).
The results presented in this paper also suggest that a reduction of SO2 emissions alone was not sufficient for eventual recovery from acid rain. We suggest that controlling the emissions of NH3 and NOx is equally important and urgently needed. Atmospheric N deposition poses a threat to natural ecosystems in the study area, causing N saturation and water eutrophication. The DIN deposition (please note N deposition in this study is for bulk precipitation which contains a fraction of dry deposition) was rather large, 38 kg N ha−1 yr−1 over the last 25 years ( and 9), which is much higher than the threshold of 25 kg N ha−1 yr−1 over which elevated N leaching occurs in European temperate forests (Gundersen et al., Citation2006). It means that, together with dissolved organic N (17%–21% of total dissolved N deposition, Li et al., 2002), more than 1000 kg N ha−1 has been deposited into our ecosystems in the past 25 years, which is likely to saturate any given natural ecosystem under warm and humid conditions (Fang et al., Citation2008).
A significant increase in concentration and deposition has been observed in the study city ( and 8; ). The increased
load in precipitation results from the increased vehicle population, but also from increased NOx production during the coal combustion associated with increased coal consumption (). The NOx control could be more difficult than SO2 control, because of an inevitable increase in vehicle population, low penetration rate of denitrogenation technologies (e.g. selective catalytic reduction) in the thermal power sector (less than 10%) and low N removal efficiency of such technologies in China (Zhao et al., Citation2009). Additionally, more attention should also be paid to the increasing NH3 emissions, although annual deposition tends to decrease with time.
deposition averaged at 21 kg N ha−1 yr−1 in 2001–2010, and is still the dominant N form in DIN (). NH3 control is also difficult to handle because NH3 is predominantly released from scattered agricultural activities (Zhao et al., Citation2009).
We believe that a national SO2 emission control policy will eventually reduce the emissions of acidifying pollutants, but it will also likely reduce the emissions of the neutralising pollutants (Zhao, et al. Citation2011). In the study city, PM10 concentrations decreased substantially (by 30%) since 2004 (). In China, Ca has been recognised as a very important base cation buffering the acidifying pollutants (Larssen and Carmichael, Citation2000). In the time period 2001–2010, large depositions of Ca2+ might have also played an important role in neutralising the acidity in precipitation, particularly in 2005–2008 (a), since Ca2+ was the main component in base cations in precipitation in this study city, accounting for 49% of total cation equivalents, on average (a). Ca2+ is mainly derived from alkaline dust, which has many potential sources, including windblown dust and anthropogenic sources such as industrial and construction activities (Larssen and Carmichael, Citation2000). High Ca deposition in 2005–2008 in the study city was most likely caused by intensive construction activities in preparation for the 16th Asian Games (CitationFang et al., 2011b). We suggest that precipitation may become more acidified in the future because the deposition of alkaline dusts containing Ca is also likely to decrease with stricter SO2 emission control policy and reduced construction activities.
In addition, we note that Cl− concentration and deposition significantly increased with time ( and 7; ). In the last five years, Cl− accounted for up to 11%–26% of total ion equivalents, with an average of 18%, which was similar to the portion of (16%–21%, on average 19%, ). Elevated Cl− concentration in precipitation was likely caused by increased hydrochloric acid (HCl) emissions in the study city due to the increased combustion of coal (, coal contains 0.01%–0.2% Cl by weight in China, Jiang et al., Citation2001), and to a lesser extent, to increased waste incineration (McCulloch et al., Citation1999). Due to the high mobility of Cl−, HCl can readily acidify both soils and surface water (Evans et al., Citation2011). Thus, HCl emission deserves more attention in order to completely control acid rain and soil and surface water acidification.
Fig. 11 Long-term trends of proportion of (a) Cl− and and (b)
to sum anions in precipitation in Guangzhou city since 1986.
4. Acknowledgements
This study was jointly supported by the National Natural Science Foundation of China (Nos. 41275018 and 41275100), the Knowledge Innovation Program of the Chinese Academy of Sciences (CAS) (No. KSCX2-EW-J-28), State Key Laboratory of Forest and Soil Ecology, Institute of Applied Ecology, CAS (Y1SRC111J6), National Key Technologies R&D Program in the 12th Five year Plan of China—Applied Remote Sensing Monitoring System for Water Quality and Quantity in Guangdong, Hong Kong and Macau (2012BAH32B03), National Natural Science Foundation of Guangdong Province as key project (S2012020011044) and Grant-in-Aid for Scientific Research of Japan Society for Promotion of Science (No. 21310008).
Related Research Data
References
- Aas W , Shao M , Jin L , Larssen T , Zhao D , co-authors . Air concentrations and wet deposition of major inorganic ions at five non-urban sites in China, 2001–2003. Atmos. Environ. 2007; 41: 1706–1716.
- Aikawa M , Ohara T , Hiraki T , Oishi O , Tsuji A , co-authors . Significant geographic gradients in particulate sulfate over Japan determined from multiple-site measurements and a chemical transport model: impacts of transboundary pollution from the Asian continent. Atmos. Environ. 2010; 44: 381–391.
- Carrillo J. H , Hastings M. G , Sigman D. M , Huebert B. J . Atmospheric deposition of inorganic and organic nitrogen and base cations in Hawaii. Global Biogeochem. Cy. 2002; 16(4): 1076.
- Chen X. Y, Mulder J. Atmospheric deposition of nitrogen at five subtropical forested sites in South China. Sci. Total Environ. 2007; 378(3): 317–330. [PubMed Abstract].
- EANET. Data Report on the Acid Deposition in the East Asian Region 2010. 2010. Online at: http://www.eanet.cc/product/index.html.
- Evans C. D, Monteith D. T, Fowler D, Cape J. N, Brayshaw S. Hydrochloric acid: an overlooked driver of environmental change. Environ. Sci. Technol. 2011; 45(5): 1887–1894. [PubMed Abstract].
- Fang Y. T , Gundersen P , Mo J. M , Zhu W. X . Input and output of dissolved organic and inorganic nitrogen in subtropical forests of South China under high air pollution. Biogeosciences. 2008; 5: 339–352.
- Fang Y. T , Gundersen P , Vogt R. D , Koba K , Chen F. S , co-authors . Atmospheric deposition and leaching of nitrogen in Chinese forest ecosystems. J. For. Res. 2011a; 16(5): 341–350.
- Fang Y. T , Koba K , Wang X. M , Wen D. Z , Li J , co-authors . Anthropogenic imprints on nitrogen and oxygen isotopic composition of precipitation nitrate in a nitrogen-polluted city in southern China. Atmos. Chem. Phys. 2011b; 11: 1313–1325.
- Fang Y. T , Yoh M , Koba K , Zhu W. X , Takebayashi Y , co-authors . Nitrogen deposition and nitrogen cycling along an urban–rural transect in southern China. Global Change Biol. 2011c; 17: 872–885.
- Gorham E, Martin F. B, Litzau J. T. Acid rain: ionic correlations in the Eastern United States, 1980–1981. Science. 1984; 225: 407–409. [PubMed Abstract].
- Gundersen P , Schmidt I. K , Raulund-Rasmussen K . Leaching of nitrate from temperate forests—effects of air pollution and forest management. Environ. Rev. 2006; 14: 1–57.
- Hao J. M , Wang S. X , Liu N. J , He K. B . Plotting of acid rain and sulfur dioxide pollution control zones and integrated control planning in China. Water Air Soil Pollut. 2001; 130(1–4): 259–264.
- Holland E. A , Braswell B. H , Sulzman J , Lamarque J. F . Nitrogen deposition onto the United States and Western Europe: synthesis of observation and models. Ecol. Appl. 2005; 15: 38–57.
- Huang D. Y, Xu Y. G, Peng P, Zhang H. H, Lan J. B. Chemical composition and seasonal variation of acid deposition in Guangzhou, South China: comparison with precipitation in other major Chinese cities. Environ. Pollut. 2009; 157(1): 35–41. [PubMed Abstract].
- Huang K , Zhuang G. S , Xu C , Wang Y , Tang A. H . The chemistry of the severe acidic precipitation in Shanghai, China. Atmos. Res. 2008; 89: 149–160.
- Huang Q. F , Chen Y. H . Variation of acid rain pollution in Guangzhou area. Guangzhou Environ. Sci. 1999; 14: 19–22. in Chinese.
- Huang X. F , Li X , He L. Y , Feng N , Hu M , co-authors . 5-year study of rainwater chemistry in a coastal mega-city in South China. Atmos. Res. 2010; 97: 185–193.
- Huebert B. J , Bates T , Russell P. B , Shi G. Y , Kim Y. J , co-authors . An overview of ACE-Asia: strategies for quantifying the relationships between Asian aerosols and their climatic impacts. J. Geophys. Res. 2003; 108: 8633. DOI: 10.1029/2003jd003550.
- Jacob D. J , Crawford J. H , Kleb M. M , Connors V. S , Bendura R. J , co-authors . Transport and chemical evolution over the Pacific (TRACE-P) aircraft mission: design, execution, and first results. J. Geophys. Res. 2003; 108: 9000. DOI: 10.1029/2002jd003276.
- Jia J. Y , Zhang Y , Cai X. B , Liu X. J . A dynamic changes of wet deposition of nitrogen in southeast Tibet: taking Linzhi experiment station as an example. Acta. Ecol. Sin. 2009; 29 1907–1913 (in Chinese)..
- Jiang X. G , Xu X , Yong C , Cen K. F . Experimental research of chlorine distribution properties in Chinese coal. Coal Conversion. 2001; 24 58–61 (in Chinese)..
- Larssen T, Carmichael G. R. Acid rain and acidification in China: the importance of base cation deposition. Environ. Pollut. 2000; 110(1): 89–102. [PubMed Abstract].
- Larssen T, Duan L, Mulder J. Deposition and leaching of sulfur, nitrogen and calcium in four forested catchments in China: implications for acidification. Environ. Sci. Technol. 2011; 45: 1192–1198. [PubMed Abstract].
- Larssen T, Lydersen E, Tang D, He Y, Gao J, co-authors. Acid rain in China. Environ. Sci. Technol. 2006; 40: 418–425. [PubMed Abstract].
- Larssen T , Seip H. M , Semb A , Mulder J , Muniz I. P , co-authors . Acid deposition and its effects in China: an overview. Environ. Sci. Policy. 1999; 2: 9–24.
- Lee B. K , Hong S. H , Lee D. S . Chemical composition of precipitation and wet deposition of major ions on the Korean peninsula. Atmos. Environ. 2000; 34: 563–575.
- Li J , Fang Y. T , Yoh M , Wang X. M , Wu Z. Y , co-authors . Organic nitrogen deposition in precipitation in metropolitan Guangzhou city of southern China. Atmos. Res. 2012; 113: 57–67.
- Lin M , Oki T , Bengtsson M , Kanae S , Holloway T , co-authors . Long-range transport of acidifying substances in east Asia – Part II – Source–receptor relationships. Atmos. Environ. 2008; 42: 5956–5967.
- Liu H , Wang X. M , Zhang J. P , He K. B , Wu Y , co-authors . Emission controls and changes in air quality in Guangzhou during the Asian Games. Atmos. Environ. 2013; 76: 81–93.
- Liu J. Q , Keene W. C , Wu G. P . Study of precipitation background value in Lijiang, China. China Environ. Sci. 1993; 13: 246–251. in Chinese.
- Lu C , Tian H . Spatial and temporal patterns of nitrogen deposition in China: synthesis of observational data. J. Geophys. Res. 2007; 112: D22S05. DOI: 10.1029/2006JD007990.
- Lu Z , Streets D. G , Zhang Q , Wang S , Carmichael G. R , co-authors . Sulfur dioxide emissions in China and sulfur trends in East Asia since 2000. Atmos. Chem. Phys. 2010; 10: 6311–6331.
- McCulloch A , Aucott M. L , Graedel T. E , Kleiman G , Midgley P. M , co-authors . Industrial emissions of trichloroethene, tetrachloroethene, and dichloromethane: reactive Chlorine Emissions Inventory. J. Geophys. Res. 1999; 104(D7): 8417–8427. DOI: 10.1029/1999JD900011.
- Mouli P. C , Mohan S. V , Reddy S. J . Rainwater chemistry at a regional representative urban site: influence of terrestrial sources on ionic composition. Atmos. Environ. 2005; 39: 999–1008.
- Ohara T , Akimoto H , Kurokawa J , Horii N , Yamaji K , co-authors . An Asian emission inventory of anthropogenic emission sources for the period 1980–2020. Atmos. Chem. Phys. 2007; 7: 4419–4444.
- Okuda T, Iwase T, Ueda H, Suda Y, Tanaka S, co-authors. Long-term trend of chemical constituents in precipitation in Tokyo metropolitan area, Japan, from 1990–2002. Sci. Total Environ. 2005; 339: 127–141. [PubMed Abstract].
- Osada K , Ohara T , Uno I , Kido M , Iida H . Impact of Chinese anthropogenic emissions on submicrometer aerosol concentration at Mt. Tateyama, Japan. Atmos. Chem. Phys. 2009; 9: 9111–9120.
- Posch M, Aherne J, Forsius M, Rask M. Past, present, and future exceedance of critical loads of acidity for surface waters in Finland. Environ. Sci. Technol. 2012; 46(8): 4507–4514. [PubMed Abstract].
- Quan W. Z , Feng S. Y , Lu X. A . Study on the status and trend of acid rain in Guangzhou. Shanghai Environ. Sci. 1992; 11: 20–24. in Chinese.
- Singh H. B , Brune W. H , Crawford J. H , Flocke F , Jacob D. J . Chemistry and transport of pollution over the Gulf of Mexico and the Pacific: spring 2006 INTEX-B campaign overview and first results. Atmos. Chem. Phys. 2009; 9: 2301–2318.
- Smith S. J , Van Aardenne J , Klimont Z , Andres R. J , Volke A , co-authors . Anthropogenic sulfur dioxide emissions: 1850–2005. Atmos. Chem. Phys. 2011; 11: 1101–1116.
- Streets D. G , Tsai N. Y , Akimoto H , Oka K . Sulfur dioxide emissions in Asia in the period 1985–1997. Atmos. Environ. 2000; 34: 4413–4424.
- Tang J , Xue H. S , Yu X. L , Cheng H. B , Xu X. B , co-authors . The preliminary study on chemical characteristics of precipitation at Mt Waliguan. Acta. Sci. Circumst. 2000; 20: 420–425. in Chinese.
- Wai K. M, Tanner P. A, Tam C. W. F. 2-year study of chemical composition of bulk deposition in a South China coastal city: comparison with East Asian cities. Environ. Sci. Technol. 2005; 39: 6542–6547. [PubMed Abstract].
- Wang H , Han G. L . Chemical composition of rainwater and anthropogenic influences in Chengdu, Southwest China. Atmos. Res. 2011; 99: 190–196.
- Wang X. M , Carmichael G , Chen D. L , Tang Y. H , Wang T. J . Impacts of different emission sources on air quality during March 2001 in the Pearl River Delta (PRD) region. Atmos. Environ. 2005; 39(29): 5227–5241.
- Wang X. M , Chen F , Wu Z. Y , Zhang M. G , Tewari M , co-authors . Impacts of weather conditions modified by urban expansion on surface ozone: comparison between the Pearl River Delta and Yangtze River Delta regions. Adv Atmos Sci. 2009b; 26(5): 962–972.
- Wang X. M , Liu H , Pang J. M , Carmichael G , He K. B , co-authors . Reductions in sulfur pollution in the Pearl River Delta region, China: assessing the effectiveness of emission controls. Atmos. Environ. 2013; 76: 113–124. DOI: 10.1016/j.atmosenv.2013.04.074.
- Wang X. M , Wu Z. Y , Liang G. X . WRF/CHEM modeling of impacts of weather conditions modified by urban expansion on secondary organic aerosol formation over Pearl River Delta. Particuology. 2009a; 7: 384–391. DOI: 10.1016/j.partic.2009.04.007.
- Xiao J . The formation and harm of N wet N deposition in Zhuangzhou city. Energy Environ. 2005; 2: 59–61. in Chinese.
- Xie Y. X , Xiong Z. Q , Xing G. X , Yan X. Y , Shi S. L , co-authors . Source of nitrogen in wet deposition to a rice agroecosystem at Tai lake region. Atmos. Environ. 2008; 42(21): 5182–5192.
- Yang F. M , He K. B , Lei Y , Ma Y. L , Yu X. C , co-authors . Chemical characters of atmospheric precipitation in Beijing in years of 2001–2003. China Environ. Sci. 2004; 24(5): 538–541. in Chinese.
- Yang R, Hayashi K, Zhu B, Li F. Y, Yan X. Y. Atmospheric NH3 and NO2 concentration and nitrogen deposition in an agricultural catchment of Eastern China. Sci. Total Environ. 2010; 408(20): 4624–4632. [PubMed Abstract].
- Ye S. D , Liu J. J , Wu R. H . Analysis on the chemical characteristics and variation tendency of precipitation in Guangzhou City. Acta Scientiarum Naturalium Universitatis Sunyatseni. 2008; 47: 43–47. in Chinese.
- Zhang M , Wang S , Wu F , Yuan X , Zhang Y . Chemical composition of wet precipitation and anthropogenic influence at a developing urban site in Southeastern China. Atmos. Res. 2007; 84: 311–322.
- Zhang Y , Zheng L. X , Liu X. J , Jickells T , Cape J. N , co-authors . Evidence for organic N deposition and its anthropogenic sources in China. Atmos. Environ. 2008; 42(5): 1035–1041.
- Zhao Y, Duan L, Xing J, Larssen T, Nielsen C. P, co-authors. Soil acidification in China: is controlling SO2 emissions enough?. Environ. Sci. Technol. 2009; 43: 8021–8026. [PubMed Abstract].
- Zhao Y, McElroy M. B, Xing J, Duan L, Nielsen C. P, co-authors. Multiple effects and uncertainties of emission control policies in China: implications for public health, soil acidification, and global temperature. Sci. Total Environ. 2011; 409(24): 5177–5187. [PubMed Abstract].
- Zhao Y , Sun Z. D , Wang F , Zhao Y. G . The correlation between acid material in atmosphere and precipitation acidity. Res. Environ. Sci. 2001; 14(6): 20–23. in Chinese.
- Zheng J. Y , Zhang L. J , Che W. W , Zheng Z. Y , Yin S. S . A highly resolved temporal and spatial air pollutant emission inventory for the Pearl River Delta region, China and its uncertainty assessment. Atmos. Environ. 2009; 43: 5112–5122.