Abstract
We use a regional model of atmospheric chemistry and transport to investigate trends in sulphur and nitrogen deposition over Europe during the first half of the 21st century. To assess changes due to climate change, the model was operated with meteorology from a regional climate model simulating present and future climates. The sensitivity of the deposition calculations to uncertainties in the climate projections was explored by using output from three different climate models. Changes in anthropogenic air pollution emissions in Europe were extracted from the gridded RCP4.5 emission inventory. The modelling systems were evaluated by comparing average modelled precipitation, deposition and concentrations over a 20-year period with observations collected around the year 2000. We conclude that the deposition of sulphur and nitrogen containing species will mainly be governed by changes in European emissions of these species over the period 2000–2050. If future emissions follow the pathway of the RCP4.5 scenario, Europe can expect significantly lower deposition of sulphur and oxidised nitrogen in 2050 compared to 2000. For reduced nitrogen, large areas of western Europe will receive considerably more deposition in 2050 than in 2000, due to feedback of decreased sulphur concentrations on the atmospheric turnover time of reduced nitrogen. Domain averaged reductions of total deposition from 2000 to 2050 are 63, 41 and 0.9% for sulphur, oxidised- and reduced nitrogen, respectively. Climate change results in decreased wet deposition of sulphur and reduced nitrogen leading to increased atmospheric turnover time of these species. Climate and emission changes lead to decreased atmospheric turnover times of reduced nitrogen but increased atmospheric turnover times of sulphur and oxidised nitrogen. These relations are likely leading to altered source-receptor relations in the future.
1. Introduction
Deposition of acidifying and eutrophying species in Europe is an on-going, insidious process resulting in large-scale modifications of natural ecosystems (see e.g. Stevens et al., Citation2004; Erisman et al., Citation2008, Citation2013). Due to the increased awareness of the possibly even greater threat to the environment in Europe – climate change – the issue of deteriorating deposition has partly fallen out of fashion since the 1980s when it peaked (Schöpp et al., Citation2003). Climate change and excess deposition are however strongly linked. Burning of fossil fuel leads to emissions of carbon dioxide and oxides of sulphur and nitrogen – the latter species resulting in acidifying and eutrophying deposition. Most species leading to acidifying and eutrophying deposition also affect climate – as aerosol particles affecting clouds and incoming radiation (Fisher et al., Citation2011), or through the subsequent impact of acidifying and eutrophying deposition on vegetation, possibly altering the global carbon dioxide sink (Reay et al., Citation2008; De Vries and Posch, Citation2011). The emission, atmospheric transport, chemical and physical conversion, and deposition of air pollutants are strongly dependent on the meteorological conditions of the atmosphere. This inherent link is manifested in the substantial variability of observed concentrations and deposition of air pollutants on time scales ranging from hours to years. It is therefore reasonable to assume that changes in climate on global and regional scales will result in changes in the distribution and deposition of air pollutants both globally and over Europe.
The impact of climate change on atmospheric deposition of air pollutants has been addressed in several recent model studies (Langner et al., Citation2005, Citation2009; Hedegaard et al., Citation2008, Citation2013; Hole and Engardt, Citation2008). Few of the previous studies have included trends in precursor emissions and were often restricted to one or two projections of the future climate. In order to reach a more robust conclusion about the impact of climate change on future air pollution, it is important to also address the uncertainty in the climate projections. Here, we present model simulations of future air pollution and deposition over Europe using three different climate projections. We also compare the impact of climate change on the future deposition with the impact following a particular scenario of air pollutant emissions in Europe, viz. the RCP4.5 (Thomson et al., Citation2011). Changes in deposition following changes in natural or semi-natural (volcanoes, oceans, soil, wildfires, lightning, etc.) emissions of sulphur and nitrogen containing species are not considered in the present study. The present set-up of our model cannot handle many of these emissions and it can be argued that several of these sources are not expected to change significantly compared to the changes in anthropogenic emissions during the period studied. Below we will assess to what extent our simulations of present conditions are biased by omitting these sources.
In section 2 we describe the set-up, with emphasis on describing the climate and emission data used in the present study. Section 3 commences with an evaluation of the modelling systems, whereby we present the results. The paper is concluded with a discussion in section 4 and conclusions, finally, can be found in section 5.
2. Methods
2.1. Climate projections
The present study relies on a subset of the comprehensive ensemble of regional climate simulations for Europe produced at SMHI (the Swedish Meteorological and Hydrological Institute) through dynamical downscaling of a range of global atmosphere and ocean general circulation model (AOGCM) runs (Kjellström et al., Citation2011). The regional climate model (RCM) used to downscale the different AOGCM simulations is the Rossby Centre Regional Climate model version 3, RCA3. Model description and evaluation of the model performance can be found in Samuelsson et al. (Citation2011). The ensemble and its general features are discussed in Kjellström et al. (Citation2011) and Nikulin et al. (Citation2011). The ensemble was designed to assess three key sources of uncertainty that affect climate projections from coupled (i.e. ocean–atmosphere) climate models:
uncertainties related to AOGCM model formulations,
uncertainties associated with the greenhouse gas emissions scenarios used to force the global and regional climate models,
uncertainties related to natural variability in the climate system.
To assess the changes in sulphur and nitrogen deposition from present times to the middle of the 21st century (ca. 2000–2050) due to climate change, we therefore use data from three members of the RCA3 ensemble, representing different AOGCM downscaling of the A1B SRES-emission scenario (Nakićenović and Swart, Citation2000). The regional climate simulations chosen for the present study are denoted CNRM_A1B, ECHAM5_A1B_r3, and HadCM3_A1B_ref (nos. 1, 11 and 13, respectively, in of Kjellström et al., Citation2011). All three regional climate simulations result in significantly increased temperatures across Europe from 2000 to 2050. The pattern and magnitude of the changes are similar among the simulations; with the largest temperature increases in the far northeast, connected to future withdrawal of ice and snow, see . HadCM3_A1B_ref features the largest warming of the three climate simulations with annual-mean temperature increases >2 K between 2000 and 2050 in large parts of Europe. In CNRM_A1B temperature increases during the first half of the 21st century are more modest, around 1 K, except in northern Fennoscandia (cf. ). Precipitation changes are more variable across Europe but in general there are significant increases of annually accumulated precipitation in the northern part of the domain and decreases in the south. HadCM3_A1B_ref again stands out among the climate simulations with large increase of precipitation over northern Europe. CNRM_A1B shows relatively small changes in precipitation, and is the only model which features larger areas of increased precipitation over the Mediterranean.
Fig. 1 Change in annual mean 2 m temperature (top), and annually accumulated surface precipitation (bottom) from 1990–2009 to 2040–2059. Only changes significant at the p=0.05 level are shown.
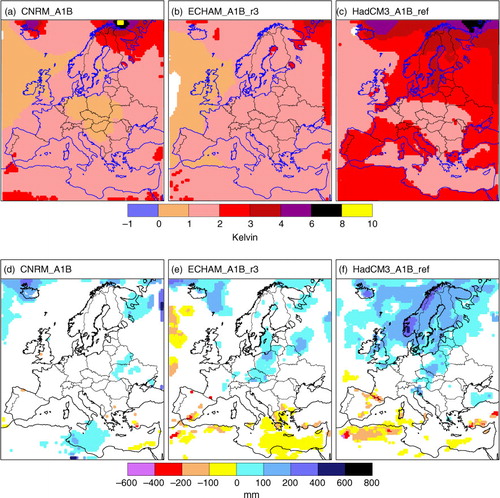
Table 1 Comparison of MATCH model results with observations collected during 1995–2005
It should be noted that the downscaling of the three AOGCMs was performed with only one regional climate model (i.e. RCA3), which means that the regional climate model uncertainty is not assessed. Several recent studies (e.g. Beniston et al., Citation2007; Kjellström et al., Citation2010) point out that variation between RCMs can be substantial.
2.2. Chemistry transport model set-up
For the present study we use the regional CTM (chemistry transport model) MATCH, which is a three-dimensional, off-line, atmospheric model developed at SMHI. The model structure, boundary layer parameterisation, advection scheme, balancing of winds to recover from potential interpolation errors, etc. are detailed in Robertson et al. (Citation1999). The dry deposition of gases and aerosols is calculated using a resistance approach depending on land surface type and taking local stability into account at every time step. The current set-up discriminates between four land surface types: (i) water; (ii) low vegetation; (iii) forest; (iv) no vegetation (i.e. glacier and desert). Dry deposition is further moderated by snow-covered ground (for O3 only) and by cold temperatures (for NO2, SO2, O3, NH3). The wet scavenging is assumed to be proportional to the precipitation intensity for most gaseous and aerosol components. For O3, H2O2 and SO2, in-cloud scavenging is calculated assuming Henry's law equilibrium (Berge, Citation1993). The chemical scheme in MATCH, based on Simpson et al. (Citation1993), considers more than 60 species including the relevant sulphur and nitrogen containing pollutants as well as all pertinent oxidants. The implementation of the chemical scheme is described in Langner et al. (Citation1998) and Andersson et al. (Citation2007). Important model parameters, such as dry deposition velocities, scavenging coefficients and boundary concentrations of the chemical species, are given in Andersson et al. (Citation2007).
The CTM modelling utilises meteorological output (wind, temperature, relative humidity, cloud cover and cloud water content) from the lowest 21 model levels, and a range of two-dimensional surface variables from the RCA3 simulations discussed in section 2.1. Data are available every 6 hours (3 hours for precipitation), and interpolated internally in MATCH to 1 hour resolution. The advection time step in MATCH is 10 minutes; chemistry and deposition use shorter time steps.
The CTM domain covers Europe and part of the North Atlantic with a horizontal resolution of 0.44°×0.44° (ca. 50 km×50 km; same grid as RCA3). In the vertical direction, MATCH reaches 5–6 km above the surface using 15 model levels, the lowest model layer being ~60 m thick, increasing to ~700 m in layer 15. More details on the model set-up can be found in Langner et al. (Citation2012); the present study is partly based on the simulations performed in that study.
To evaluate the present modelling setup, we compare the MATCH results with observed wet deposition and concentrations of sulphur and nitrogen compounds in air and precipitation at EMEP stations across Europe (http://www.nilu.no/projects/ccc/emepdata.html). We restrict our analysis to comparing multi-year averages, as we cannot expect correspondence between model and measurements for individual years when the CTM is forced with meteorology from a climate model. In the evaluation of model performance, we compare the model results averaged over the period 1990–2009, using emissions fixed at the RCP4.5 values for the year 2000, with observations from the period 1995–2005. Both periods should be representative of the conditions around the year 2000. The scarcity of observations, together with the large trend in emissions during the 1990s is the reason for the shorter observational period. In the comparison, we have only included stations with at least 8 years of observational data and at least 80% data coverage per year.
In the present work, we construct and discuss average values during two different 20-year periods. The first period is both used for evaluation of the model performance and to define the current (ca. 2000) conditions. The second period represents the conditions in Europe at the middle of the 21st century. To evaluate changes due solely to climate change, and the combined effect of climate change and emissions changes, we present results where all emissions were held at their 2000 values during all years, and simulations where the gridded emissions were updated every year according to the RCP4.5 scenario (cf. section 2.3). In both cases, we drive the deposition model with meteorology for the years 1990–2009 and 2040–2059 generated by the regional climate model, to account for the changes in climate. The uncertainty arising from the driving meteorological data is assessed by utilising three independent climate projections (cf. section 2.1). Boundary concentrations of oxidants and all sulphur and nitrogen containing species were the same for all years, throughout all simulations (except for O3 in the simulations with changing future emissions where an increase by 0.2 ppb(v) year−1 was assumed, see Langner et al., Citation2012). For most species the boundary concentrations undergo a seasonal cycle, see Andersson et al. (Citation2007) and Langner et al. (Citation2012).
Changes in 20-year averages will only be considered if found significant at the p=0.05 level, using a two-tailed Student t-test (with 20-1 degrees of freedom), i.e. when ∣t∣ > 2.093, where:
is the 20-year mean during period i, (s
i
)2 is the variance of the 20 annual mean values during period i, and n
i
is the number of values (=20) during each period.
2.3. Air pollution emissions
Anthropogenic emissions of sulphur (SO2 and sulphate), nitrogen oxides (NO and NO2), ammonia (NH3), non-methane volatile organic compounds (NMVOCs) and carbon monoxide (CO) needed as input to the CTM were interpolated to the MATCH grid from the global RCP4.5 inventory (Thomson et al., Citation2011). Historical (up to 2000) emissions in the RCP inventories are based on the global data of Lamarque et al. (Citation2010). The RCP emissions are provided at 10-year intervals and we linearly interpolated these data to a 1-year time resolution. The RCP4.5 emissions are also given for different sectors allowing us to apply relevant temporal and vertical emission profiles.
In , we compare the total RCP4.5 emissions in the 27 European Union countries (EU-27) with data from scenarios recently developed to support the revision of the EU air quality strategy (Amann et al., Citation2012). The EU-27 emissions constitute roughly half of the emissions in the modelling domain (cf. ). Emissions of sulphur and NOx are predicted to be reduced substantially in Europe in all of these scenarios while ammonia emissions remain almost constant. The summed RCP4.5 emission trend in EU-27 is close to the Base scenario in Amann et al. (Citation2012) for both sulphur and nitrogen emissions.
Fig. 2 Annual anthropogenic emissions for EU-27 of sulphur (top), nitrogen oxides (middle) and ammonia (bottom) for RCP4.5 and four different scenarios developed by the International Institute for Applied Systems Analysis (IIASA). Base corresponds to implementation of current legislation. Decarb correspond to an 80% reduction in greenhouse gas emissions in 2050 and concurrent reductions in sulphur and nitrogen emission. MTFR corresponds to Maximum Technically Feasible Reduction and MCE corresponds to Maximum Control Efforts.
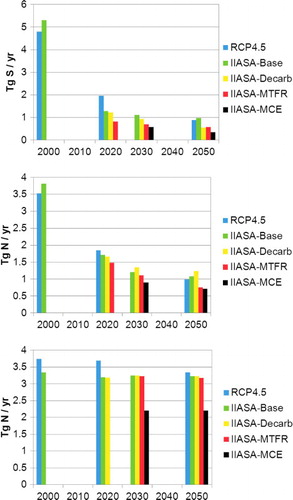
Table 2 Atmospheric turnover time (t0), average mass and deposition fluxes in the modelling domain during different periods
Emissions of isoprene from forests are calculated on-line in MATCH as described in Langner et al. (Citation2012), all other natural or semi-natural emissions, not included in the RCP4.5 scenarios, are ignored.
3. Results
3.1. Current conditions
shows the statistical scores for sulphur and nitrogen compounds and precipitation across Europe when running the CTM with meteorology from different climate projections. The performance of MATCH, in this study, is best for secondary particulate matter in air (sulphate, nitrate, ammonium), with a relative bias of these species typically around ±10% and spatial correlations of 0.7–0.8. The shorter-lived primary gaseous components are systematically underestimated while deposition and concentration in precipitation are overestimated, indicating too rapid initial mixing – possibly coupled to the coarse resolution of the model, or too fast conversion and too efficient wet deposition. The deficiencies are related to shortcomings in the chemical and deposition schemes in MATCH but also to imperfect meteorology. Too much, and too frequent precipitation, which is a general feature of RCA3 (especially in the northern part of the domain, Lind and Kjellström, Citation2009; Samuelsson et al., Citation2011) is expected to lead to this type of result. For the climate projection with the largest overestimation of precipitation compared to the observations at the EMEP sites (ECHAM5_A1B_r3), concentration in precipitation is better reproduced (lower relative bias) than wet deposition. For the simulation with only little overestimation of precipitation amount (CNRM_A1B) wet deposition is closer to observations (lower relative bias) than concentration in precipitation. Sulphur – the species where wet deposition is the most important sink (~80% of total sulphur deposition in domain is wet deposition) – has the largest relative bias in wet deposition whereas reduced nitrogen, which features the lowest relative importance of wet deposition, shows the lowest relative bias.
The RMSE of all parameters considered is large, 50–100%. The ECHAM5_A1B_r3 simulation generally has the lowest RMSE among the climate projections. The difference between the simulations is, however, small and it is not possible to objectively and unambiguously determine which climate data set is the best –or worst– driver to the CTM. Overall, the performances of the CTM using meteorological input downscaled from different GCMs are very similar.
The present setup of the modelling system features comparable performance over Europe to earlier studies with MATCH using climate model output (e.g. Langner et al., Citation2005, Citation2009). Applications of MATCH driven by meteorological data constrained by observations typically have lower bias for both atmospheric concentrations and deposition. In the simulation with MATCH for the year 1999 using ERA40 as meteorological input presented by Andersson et al. (Citation2007), the relative bias for all air borne components, except SO2, and for wet deposition was below 16%. In the present study, primary airborne components have negative biases larger than 34%, and wet deposition biases of 27–58% for sulphur and oxidised nitrogen. It should be noted that biases in wet deposition in Andersson et al. (Citation2007) are negative while the present study features substantial positive biases in wet deposition of all components, due to overestimation of precipitation in the climate model during the reference period.
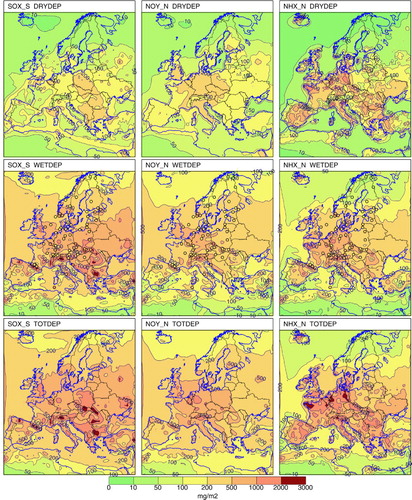
shows the average distributions of dry-, wet- and total deposition of sulphur, oxidised and reduced nitrogen for the period 1990–2009 simulated using HadCM3_A1B_ref meteorology and RCP4.5 emissions for the year 2000. The maps for the different chemical components display several similarities but also some differences. Sulphur deposition is largest in east and south Europe whereas nitrogen deposition maximises in central and western Europe although deposition of reduced nitrogen is also high in several south European countries. Deposition of all species is low in North Africa and north Fennoscandia. Dry deposition is smaller than wet deposition for all components except reduced nitrogen, and is also more restricted to land areas where near-surface atmospheric concentrations are highest – due to the proximity to the sources. Wet deposition has a smoother pattern and reaches further from the source regions for all components and feature local maxima in mountainous areas where precipitation is higher. In the maps displaying wet deposition the observed station values used in the model evaluation () are indicated. The figures illustrate the general overestimation of the wet deposition compared to observations in our simulations and we conclude that no part of the domain is performing better or worse than any other.
Fig. 3 Average deposition of sulphur (left), oxidised nitrogen (middle) and reduced nitrogen (right) for the period 1990–2009 using HadCM3_A1B_ref meteorology and emissions from RCP4.5 held at their 2000 values. Top: Dry deposition. Middle: Wet deposition. Bottom: Sum of dry and wet deposition. Coloured circles indicate the observed wet deposition values at the stations used in the model evaluation given in . Units: mg S/N m−2 yr−1.
3.2. Deposition changes
Figures (Citation4–Citation6) show calculated change in the total deposition of sulphur, oxidised and reduced nitrogen from 2000 (1990–2009) to 2050 (2040–2059). Small but statistically significant increases of, in particular, oxidised nitrogen total deposition due to climate change can be seen in central Europe. For the CNRM_A1B simulation, the increasing precipitation in central Mediterranean results in increasing wet (and total) deposition in this area while the decrease in precipitation in ECHAM_A1B_r3 and HadCM3_A1B_ref in the Mediterranean leads to corresponding decreases in wet (and total) deposition. The large increase in precipitation in northern Europe simulated by HadCM3_A1B_ref () is not accompanied by a corresponding increase in wet deposition (not shown) although some areas with significant increase can be seen. This is related to a shift in circulation in the HadCM3_A1B_ref simulation resulting in a more zonal circulation situation leading to decreased long-range transport from central to northern Europe. The dry deposition (not shown) increases in most of the domain due to climate change, particularly for oxidised nitrogen. The most abundant oxidised nitrogen species in our simulation of current climate is PAN (34% of oxidised nitrogen mass in model domain), followed by HNO3 (22%), nitrate (22%) and NO2 (18%). Climate change results in increased amount of HNO3 and nitrate in the model domain but reduced amount of PAN. The increase in HNO3 and nitrate is related both to the decrease in precipitation in the major source regions and to increased photochemical production due to reduced cloudiness while the decrease of PAN is related to an increase in thermal decomposition due to increasing temperatures. Increasing HNO3 inevitably leads to increasing dry deposition of oxidised nitrogen across the domain due to the efficient dry deposition of this species. Decreased formation of PAN means that less oxidised nitrogen is exported from Europe to other regions.
Fig. 4 Change in total deposition of sulphur from 1990–2009 to 2040–2059. Top: Only changing climate. Bottom: Changing climate and changing emissions. Only changes significant at the p=0.05 level are shown.
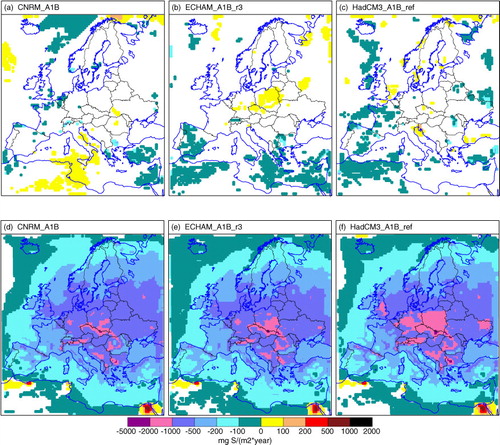
Fig. 5 Change in total deposition of oxidised nitrogen from 1990–2009 to 2040–2059. Top: Only changing climate. Bottom: Changing climate and changing emissions. Only changes significant at the p=0.05 level are shown.
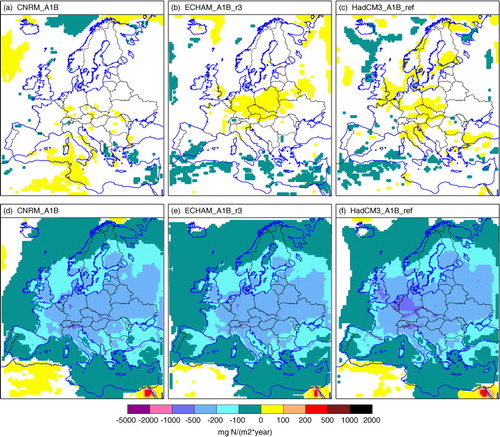
Fig. 6 Change in total deposition of reduced nitrogen from 1990–2009 to 2040–2059. Top: Only changing climate. Bottom: Changing climate and changing emissions. Only changes significant at the p=0.05 level are shown.
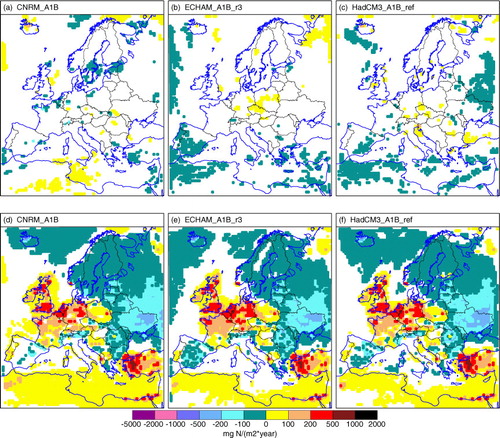
Changes in total deposition due solely to climate change are dwarfed by the expected change in deposition following trends in emissions for all species considered in the present study. For sulphur and oxidised nitrogen, there is a consistent decrease of deposition throughout Europe when both emission changes and climate change are taken into account (lower rows of –). The corresponding change in reduced nitrogen (lower row of ) features increasing deposition in western Europe and only small decreases in north-eastern Europe and some Mediterranean countries. The trends in reduced nitrogen deposition are mainly the result of reduced sulphur emissions and altered atmospheric lifetime of reduced nitrogen and to a lesser extent due to changes in NH3 emissions. Reduced emissions of sulphur lead to decreased formation of ammonium sulphate, which leaves a larger fraction of the emitted NH3 remaining in the gas phase. Gaseous NH3 readily dry deposits and has a shorter atmospheric lifetime than ammonium sulphate. Decreased sulphur emissions thus lead to shorter transport distances for reduced nitrogen and more local deposition of NH3. Emission of NH3 in the utilised RCP4.5 inventory also increase from 2000 to 2050 in Great Britain, the Netherlands, Belgium, Poland, Portugal and in the countries south and east of the Mediterranean while emissions are unchanged or slightly decreasing in most other countries (including e.g. France and Germany). Total emissions of NH3 in the model domain decrease by 3% (cf. ). The large change in sulphur emissions also leads to increased atmospheric lifetime of oxidised nitrogen due to the increased formation of ammonium nitrate, which lessens HNO3 concentration and thereby almost halve the dry deposition of oxidised nitrogen in the future situation with less sulphur available.
To isolate the effect of varying sulphur emissions on the deposition pattern of reduced nitrogen, we performed one simulation (not shown) using HadCM3_A1B_ref meteorology for 2040–2059 with the NH3 emissions held at their 2000-values, all other factors unchanged. In this experiment, reduced nitrogen dry deposition in 2040–2059 increase substantially over most of the domain compared to the situation in 1990–2009. Most of the change is due to increased dry deposition of reduced nitrogen while wet deposition increase slightly in central Europe. The resulting total deposition of reduced nitrogen is very similar to the experiment with varying NH3 emissions (lower right panel in ). This confirms that the simulated changes in deposition of reduced nitrogen are mainly driven by decreased production of ammonium sulphate due to reduced sulphur emission and not by the relatively small change in NH3 emissions expected over Europe in the RCP4.5 inventory. For an excellent discussion on the coupling between SO2 and oxidised- and reduced nitrogen species during a recent historical period, see Fagerli and Aas (Citation2008).
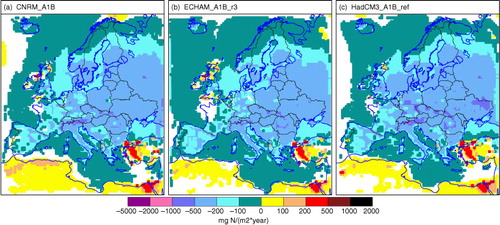
shows the expected change in total deposition of fixed nitrogen (oxidised- plus reduced nitrogen) from 2000 to 2050 taking both climate change and emission changes into account. The relatively large increase in reduced nitrogen deposition in western Europe (cf. ) offsets the decreasing oxidised nitrogen deposition (), resulting in only small decreases of fixed nitrogen over an extended region from Portugal to Germany and also including UK and Ireland.
Fig. 7 Change in total deposition of fixed nitrogen (oxidised- plus reduced nitrogen) from 1990–2009 to 2040–2059 following changes in climate and emissions. Only changes significant at the p=0.05 level are shown.
Calculated atmospheric turnover times (Bolin and Rodhe, Citation1973), total mass and deposition fluxes of sulphur, oxidised- and reduced nitrogen in the model domain for the different simulations are provided in . Altered emissions have a large impact on the simulated atmospheric turnover times. Emission changes increase the atmospheric turnover time of sulphur and oxidised nitrogen and decrease the atmospheric turnover time of reduced nitrogen as discussed above. Changes averaged over the three different climate projections are +11, +12 and −12%, respectively. Climate change alone increases the atmospheric turnover time of sulphur and reduced nitrogen in the modelling domain by 5–8% from 2000 to 2050 (cf. ) while the change for oxidised nitrogen is small. The increase in atmospheric turnover time due to climate change is mainly brought about by decreasing wet deposition. Referring to , precipitation is mainly decreasing in and around the Mediterranean but increasing in the northern part of the domain. This is translated into the decreasing total deposition generally seen over the Mediterranean and adjacent areas (cf. Figs. (Citation4–Citation6), a–c). A consequence of climate change is thus that sulphur and ammonia emitted in southern Europe remain longer in the atmosphere and are being transported over longer distances across Europe. The decrease in total deposition of sulphur, oxidised- and reduced nitrogen in the model domain is smaller than the decrease in emissions in the simulations with changed climate and changed emissions.
4. Discussion
When including both climate- and emission changes, the resulting patterns of deposition changes of sulphur- and nitrogen-containing species are very similar in the different climate projections, indicating that emission changes (which are identical across the experiments) dominate over trends induced by climate change. The decrease in sulphur deposition is particularly prominent whilst deposition of reduced nitrogen is found to increase in certain parts of the domain and decrease in other from 2000 to 2050. Based on SRES scenarios updated to include European air quality commitments, Syri et al. (Citation2004) also noted that changes in emissions dominate over changes in meteorology when quantifying future deposition of sulphur and oxidised nitrogen over Finland. In this study we have used the RCP4.5 scenario (Thomson et al., Citation2011). It has been argued (e.g. Fiore et al., Citation2012) that the RCP air pollutant emissions may not be a likely projection for Europe or on the global scale. For Europe, future emissions from shipping are particularly uncertain. Our analysis of the data indicates that the total emissions in Euro-27 are similar to recent estimates focussing on air pollutant emissions (Amann et al., Citation2012). We have not analysed spatial and sectorial differences, which admittedly do have impacts on the results.
In the present study, we have assumed that the contribution from emissions outside the model domain is small and that it will not change over time. This is in line with the findings in TF-HTAP (Citation2010) where intercontinental contributions to deposition of sulphur and reactive nitrogen was estimated to be 9 and 4%, respectively for year 2001 emissions. If emissions outside Europe would undergo substantial changes, our assumption may not hold. Note, however, that North African emissions of sulphur and nitrogen are increasing with time in the RCP4.5 scenario but these trends seem to have limited impact on European sulphur and nitrogen deposition.
The comparison of the model simulations with observed concentrations and deposition reveal substantial differences between observed and modelled values. Apart from biases in the simulated meteorology, the underestimation of primary components could also be related to real-world emissions being much higher in the 1990s when some of the observational data where collected. The modelling set-up used for validation operated with emissions fixed at their values at 2000 when emissions of sulphur and oxidised nitrogen were substantially lower than a decade earlier.
Although temperature and precipitation differed among the climate simulations used for driving the CTM (CNRM_A1B featuring the lowest bias and RMSE for precipitation at EMEP stations, for example), it was not possible to unambiguously identify one meteorological driver which produced the best correspondence with observations. CNRM_A1B likely has the lowest bias, on average, while ECHAM_A1B_r3 features the lowest RMSE of the species considered in this study. For ECHAM_A1B_r3 and HadCM3_A1B_ref there are statistically significant changes in the atmospheric turnover time of sulphur and reduced nitrogen due solely to climate change. Differences in atmospheric turnover time between the three climate projections for any period or set of emissions are of the same magnitude as the change in atmospheric turnover time from 2000 to 2050 for the respective climate projection. This reflects the variation and uncertainty in the climate simulations. Based on our evaluation of precipitation at 62 EMEP stations across Europe, we conclude that the climate models perform markedly different and often feature large RMSE and biases for this meteorological variable that has such an important role in the cycling of sulphur and nitrogen in the atmosphere.
5. Conclusions
We have studied the relative importance of changes in regional climate and air pollution emissions for the future deposition of sulphur and nitrogen over Europe. We utilised three different climate projections based on the SRES-A1B greenhouse gas emission scenario and air pollution emissions from the RCP4.5 scenario. The following conclusions can be drawn:
Although different global climate models result in different climate in regional climate projections over Europe, the choice of driving meteorology for the CTM calculations are of less importance for deducing sulphur and nitrogen deposition in our simulations covering the period 2000–2050. The model performance during present climate and the calculated change are similar between our three climate projections.
Future deposition of sulphur and nitrogen containing species over Europe will mainly be governed by future levels of air pollution emissions. For sulphur, oxidised- and reduced nitrogen, our study indicates domain average reductions of total deposition by 63, 41 and 0.9%, respectively, when climate and emission changes from 2000 to 2050 are taken into account. For comparison, emission reductions of these species are 70, 52 and 3% in our simulations.
Changes in climate and emissions lead to altered atmospheric lifetime of many atmospheric species. From 2000 to 2050, climate change alone leads to increasing atmospheric turnover times of sulphur and reduced nitrogen with 5–8%. Climate change combined with emission changes lead to decreased atmospheric turnover time of reduced nitrogen with 12% and increased atmospheric turnover time of sulphur and oxidised nitrogen with 11 and 12%, respectively, over the same period.
Acknowledgements
This work was supported by Swedish EPA under the CLEO programme (Climate Change and Environmental Objectives), and the EU FP7 project ECLAIRE (project no: 282910). Climate projection results were kindly provided in a suitable format for use in MATCH by the SMHI Rossby Centre. Camilla Andersson is acknowledged for stimulating discussions and assistance with the analysis.
Related Research Data
References
- Amann M , Borken-Kleefeld J , Cofala J , Heyes C , Klimont Z , co-authors . Future Emissions of air Pollutants in Europe – Current Legislation Baseline and the Scope for Further Reductions. 2012; Laxenburg, Austria: International Institute for Applied Systems Analysis (IIASA). TSAP Report #1.
- Andersson C , Langner J , Bergström R . Interannual variation and trends in air pollution over Europe due to climate variability during 1958–2001 simulated with a regional CTM coupled to the ERA-40 reanalysis. Tellus B. 2007; 59: 77–98. DOI: 10.1111/j.1600-0889.2006.00196.x.
- Beniston M , Stephenson D. B , Christensen O. B , Ferro C. A. T , Frei C , co-authors . Future extreme events in European climate: an exploration of regional climate model predictions. Clim. Chang. 2007; 81: 71–95. DOI: 10.1007/s10584-006-9226-z.
- Berge E . Coupling of wet scavenging of sulphur to clouds in a numerical weather prediction model. Tellus B. 1993; 45: 1–22.
- Bolin B , Rodhe H . A note on the concepts of age distribution and transit time in natural reservoirs. Tellus. 1973; 25: 58–62.
- De Vries W , Posch M . Modelling the impact of nitrogen deposition, climate change and nutrient limitations on tree carbon sequestration in Europe for the period 1900–2050. Environ. Pollut. 2011; 159: 2289–2299. DOI: 10.1016/j.envpol.2010.11.023.
- Erisman J. W , Galloway J. N , Seitzinger S , Bleeker A , Dise N. B , co-authors . Consequences of human modification of the global nitrogen cycle. Philos. Trans. R. Soc. Lond. B. Biol. Sci. 2013; 368: 20130116.
- Erisman J. W , Sutton M. A , Galloway J , Klimont Z , Winiwarter W . How a century of ammonia synthesis changed the world. Nat. Geosci. 2008; 1: 636–639.
- Fagerli H , Aas W . Trends of nitrogen in air and precipitation: model results and observations at EMEP sites in Europe, 1980–2003. Environ. Pollut. 2008; 154: 448–461.
- Fiore A. M , Naik V , Spracklen D , Steiner A , Unger N , co-authors . Global air quality and climate. Chem. Soc. Rev. 2012; 41: 6663–6683. DOI: 10.1039/c2cs35095e.
- Fisher J. A , Jacob D. J , Wang Q , Bahreini R , Carouge C. C , co-authors . Sources, distribution, and acidity of sulfate-ammonium aerosol in the Arctic in winter–spring. Atmos. Environ. 2011; 45: 7301–7318. DOI: 10.1016/j.atmosenv.2011.08.030.
- Hedegaard G. B , Brandt J , Christensen J. H , Frohn L. M , Geels C , co-authors . Impacts of climate change on air pollution levels in the Northern Hemisphere with special focus on Europe and the Arctic. Atmos. Chem. Phys. 2008; 8: 3337–3367.
- Hedegaard G. B , Christensen J. H , Brandt J . The relative importance of impacts from climate change vs. emissions change on air pollution levels in the 21st century. Atmos. Chem. Phys. 2013; 13: 3569–3585. DOI: 10.5194/acp-13-3569-2013.
- Hole L , Engardt M . Climate change impact on atmospheric nitrogen deposition in Northwestern Europe: a model study. Ambio. 2008; 37: 9–17.
- Kjellström E , Boberg F , Castro M , Christensen J. H , Nikulin G , co-authors . Daily and monthly temperature and precipitation statistics as performance indicators for regional climate models. Clim. Res. 2010; 44: 135–150. DOI: 10.3354/cr00932.
- Kjellström E , Nikulin G , Hansson U , Strandberg G , Ullerstig A . 21st century changes in the European climate: uncertainties derived from an ensemble of regional model simulations. Tellus A. 2011; 63: 24–40. DOI: 10.1111/j.1600-0870.2010.00475x.
- Lamarque J.-F , Bond T. C , Eyring V , Granier C , Heil A , co-authors . Historical (1850–2000) gridded anthropogenic and biomass burning emissions of reactive gases and aerosols: methodology and application. Atmos. Chem. Phys. 2010; 10: 7017–7039. DOI: 10.5194/acp-10-7017-2010.
- Langner J , Andersson C , Engardt M . Atmospheric input of nitrogen to the Baltic Sea basin: present situation, variability due to meteorology and impact of climate change. Boreal. Environ. Res. 2009; 14: 226–237.
- Langner J , Bergström R , Foltescu V. L . Impact of climate change on surface ozone and deposition of sulphur and nitrogen in Europe. Atmos. Environ. 2005; 39: 1129–1141. DOI: 10.1016/j.atmosenv.2004.09.082.
- Langner J , Bergström R , Pleijel K . European Scale Modeling of Sulphur, Oxidized Nitrogen and Photochemical Oxidants. Model Development and Evaluation for the 1994 Growing Season.
- Langner J , Engardt M , Andersson C . European summer surface ozone 1990–2100. Atmos. Chem. Phys. 12: 10097–10105. 10.5194/acp-12-10097-2012.
- Lind P , Kjellström E . Water budget in the Baltic Sea drainage basin: evaluation of simulated fluxes in a regional climate model. Boreal. Environ. Res. 2009; 14: 56–67.
- Nakićenović N , Swart R . Special report on emissions scenarios: In: A Special Report of Working Group III of the IPCC . 2000; Cambridge, UK: Cambridge University Press. 599.
- Nikulin G , Kjellström E , Hansson U , Strandberg G , Ullerstig A . Evaluation and future projections of temperature, precipitation and wind extremes over Europe in an ensemble of regional climate simulations. Tellus A. 2011; 63: 41–55. DOI: 10.1111/j.1600-0870.2010.00466.x.
- Reay D. S , Dentener F , Smith P , Grace J , Feely R. A . Global nitrogen deposition and carbon sinks. Nat. Geosci. 2008; 1: 430–437.
- Robertson L , Langner J , Engardt M . An Eulerian limited-area atmospheric transport model. J. Appl. Meteorol. 1999; 38: 190–210.
- Samuelsson P , Jones C. G , Willén U , Ullerstig A , Gollvik S , co-authors . The Rossby centre regional climate model RCA3: model description and performance. Tellus A. 2011; 63: 4–23. DOI: 10.1111/j.1600-0870.2010.00478.x.
- Schöpp W , Posch M , Mylona S , Johansson M . Long-term development of acid deposition (1880–2030) in sensitive freshwater regions in Europe. Hydrol. Earth. Syst. Sci. 2003; 7: 436–446.
- Simpson D , Andersson-Sköld Y , Jenkin M. E . Updating the Chemical Scheme for the EMEP MSC-W Oxidant Model: Current Status. EMEP MSC-W Note 2/93. 1993; Norwegian Meteorological Institute, Oslo, Norway, 33.
- Stevens C. J , Dise N. B , Mountford J. O , Gowing D. J . Impact of nitrogen deposition on the species richness of grasslands. Science. 2004; 303: 1876–1879.
- Syri S , Fronzek S , Karvosenoja N , Forsius M . Sulphur and nitrogen oxides emissions in Europe and deposition in Finland during the 21st century. Boreal. Environ. Res. 2004; 9: 185–198.
- Task Force on Hemispheric Transport of Air Pollution (TF-HTAP). Dentener F , Keating T , Akimoto H . Hemispheric Transport of Air Pollution 2010. 2010; Geneva, Switzerland: UNECE. Air Pollution Studies No. 17 Online at: http://www.htap.org .
- Thomson A. M , Calvin K. V , Smith S. J , Kyle G. P , Volke A , co-authors . RCP4.5: a pathway for stabilization of radiative forcing by 2100. Clim. Chang. 2011; 109: 77–94. DOI: 10.1007/s10584-011-0151-4.