Abstract
Long-term trends of aerosol concentrations and direct radiative forcings in East Asia have been investigated by adopting an online-coupled regional climate-chemistry-aerosol model (RIEMS-Chemaero) and the IPCC AR5 (the Intergovernmental Panel on Climate Change Fifth Assessment Report) emission inventory with the focus on eastern China. Model evaluation against surface observations of aerosol components demonstrates that the model can reproduce the spatial distribution and temporal variation of aerosol components generally well but tends to under-predict aerosol magnitudes especially for carbonaceous aerosols. Model comparison with aerosol optical depth (AOD) from both satellite retrieval and surface measurement shows that the model is capable of reproducing the distribution feature of AOD reasonably well but tends to under-predict magnitude. North of eastern China and the Sichuan basin are high concentration centres for near-surface anthropogenic aerosols. The domain averaged column burden of inorganic aerosol over East Asia increased from 1850 to 2010 with the peak in 1990 (18.7mg m−2), whereas that in eastern China peaked in 2010 (32.9 mg m−2). The burden of carbonaceous aerosol peaked in 1980 (5.2 mg m−2) in East Asia, but it peaked in 1990 (7.1 mg m−2) in eastern China and then decreased thereafter. Both inorganic and carbonaceous aerosol burdens showed little change during 1990–2000 due to effective emission control in China. AOD values over eastern China increased almost continuously from 1850 to 2010 with the Sichuan basin the high AOD centre. All-sky aerosol direct radiative forcing at the surface (ADRFSRF) is negative over all of East Asia, while radiative forcing at the top of the atmosphere (ADRFTOA) is negative over eastern China but positive over west China. Domain and annual mean ADRFSRF in East Asia peaked in 2000 (−11.9 W m−2), but that in eastern China peaked in 2010 (−17.5 W m−2). Mean ADRFTOA became negative since 1970 and showed the strongest forcing in 1990 (−2.9 W m−2) for East Asia and in 2010 (−4.8 W m−2) for eastern China. Sensitivity simulation shows that anthropogenic emission change plays the dominant role in the variation of aerosol concentration and direct radiative forcing in this region.
To access the supplementary material to this article, please see Supplementary files under Article Tools online.
1. Introduction
Atmospheric aerosol affects climate by scattering or absorbing solar and infrared radiation and by acting as cloud condensation nuclei to modify cloud property and lifetime. Aerosol climatic effect is one of the key issues in climate change. The mechanism of how aerosol affects radiation budget and climate remains largely unknown because of the complexity of aerosol properties and the interaction between aerosol and climate dynamic. The Intergovernmental Panel on Climate Change (IPCC) Fourth Assessment Report indicates that the global mean top of the atmosphere (TOA) direct radiative forcing by all aerosols is −0.5±0.4 W m−2, partly offsetting the positive radiative forcing of +2.6±0.3 W m−2 from the long-lived greenhouse gases (Forster et al., Citation2007). However, the scientific understanding of aerosol radiation and climate effects is still in a medium–low level.
Growth in population and energy consumption over the past 160 years, especially in the past 60 years, has greatly increased the amount of anthropogenic aerosols in East Asia and the emissions are anticipated to increase further in the near future (Streets and Waldhoff, Citation2000; Ohara et al., Citation2007; Smith et al., Citation2011). Anthropogenic aerosols mainly consist of sulphate, nitrate, ammonium, black carbon (BC), organic carbon (OC) and primary particulate matter (PM). Sulphate and nitrate aerosols are formed by oxidations of SO2 and nitrogen oxides (NOx=NO+NO2), and ammonium is formed by thermodynamic equilibrium process among sulphate–nitrate–ammonia–water systems. Fossil fuel (such as coal and oil) combustion in power generation and industry are primary sources of both SO2 and NOx in East Asia (Streets et al., Citation2003; Ohara et al., Citation2007). Ammonia in East Asia originates mainly from agriculture (Streets et al., Citation2003). Residential fuel combustion and biomass burning produce most of the East Asian BC and primary OC emissions. Another major OC source is the secondary organic aerosol (SOA) of both biogenic and anthropogenic origins (Kanakidou et al., Citation2005). Primary PM generally comes from industry and combustion processes. Additionally, East Asia is also one of the major dust source regions in the world (Zhang et al., Citation2003a; Shao and Dong, Citation2006). The coexistence and the huge amount of both anthropogenic and natural aerosols in East Asia situate researches on aerosol climate effects in a complicated circumstance.
Numerous model simulations were conducted to investigate aspects of Asian aerosols in the past decades. A number of modelling works focus on source, transport, transformation, deposition and air quality impact of Asian aerosols (Song and Carmichael, Citation2001; Carmichael et al., Citation2003; Shao et al., Citation2003; Tang et al., Citation2004; Han et al., Citation2008; Holloway et al., Citation2008; Kajino and Kondo, Citation2011; Li et al., Citation2011; Li and Han, Citation2012; Fu and Liao, Citation2012). These works concern the spatial distribution and temporal variation of aerosol components and relevant physical and chemical evolution mechanisms. Some researchers apply regional climate models to investigate the aerosol radiative and climatic effects in East Asia (Giorgi et al., Citation2002; Qian et al., Citation2003; Wu et al., Citation2008; Liu et al., Citation2010; Wang et al., Citation2010; Han et al., Citation2012, Citation2013; Zhang et al., Citation2012), focusing on specific aerosol components (such as sulphate, BC, or dust) during a relatively short time period. Most of the current regional climate models do not include sophisticated or complete atmospheric chemistry/aerosol processes, limiting their ability to represent feedback among atmospheric chemistry, aerosol, radiation and climate.
In this study, we employ an online-coupled regional climate-chemistry-aerosol model (RIEMS-Chemaero) to investigate long-term trends of aerosol burdens and aerosol direct radiative forcings by major aerosol components in East Asia. The model is run for 1850 (representing the preindustrial condition) and for typical years from 1970 (low-speed developing period of China) to 2010 (present day) in a decadal interval. To our knowledge, this work is the first attempt at estimating long-term variations of aerosol burdens and direct radiative forcings specifically for East Asia/China with an online regional climate-aerosol model.
2. Model and parameters
2.1. Model description
The host model RIEMS (Regional Integrated Environmental Model System) was developed based on the dynamic structure of the fifth-generation NCAR/Penn State Mesoscale Model (MM5). It includes several sub-models and parameterizations to describe a series of important physical processes, such as a modified radiation sub-model based on the radiation package of the NCAR Community Climate Model, version CCM3 (Keihl et al., Citation1996) for radiation transfer calculation, the Biosphere–Atmosphere Transfer Scheme (BATS) (Dickinson et al., Citation1993) for land surface process, the Medium-Range Forecast (MRF) scheme for planetary boundary layer process (Hong and Pan, Citation1996), and the Grell cumulus convective parameterization scheme (Grell, Citation1993). RIEMS has been used to investigate the impact of human-induced land cover change on East Asia monsoon (Fu, Citation2003), to simulate present climate over East Asia (Xiong et al., Citation2006), and to investigate direct radiative effects of anthropogenic and natural aerosols over East Asia (Han et al., Citation2012, Citation2013). RIEMS has participated in the Regional climate Model Intercomparison Project (RMIP) for Asia (Fu et al., Citation2005) and it is one of the best models among the nine model groups in predicting temperature and precipitation for East Asia.
Gas and aqueous chemistry, as well as aerosol modules, have already been incorporated into RIEMS (Han, Citation2010; Han et al., Citation2012). A total of 27 gas species and eight aerosol types (sulphate, nitrate, ammonium, BC, primary OC, secondary OC, mineral dust and sea salt) are treated in RIEMS. Gas phase chemistry is represented by CB-IV mechanism (Gery et al., Citation1989) and aqueous phase chemistry is similar to that in RADM (the Regional Acid Deposition Model) (Chang et al., Citation1987). Sulphate is oxidized from SO2 by OH radical in gas phase and by H2O2 and O3 in aqueous phase. ISORROPIA model (Nenes et al., Citation1998) is included to account for the thermodynamic equilibrium process of inorganic aerosols (sulphate, nitrate and ammonium). SOA formation from anthropogenic and biogenic VOCs (Volatile Organic Component) is calculated by a bulk yield method proposed by Lack et al. (Citation2004). Anthropogenic primary aerosols (BC and primary OC) are directly emitted into the atmosphere. A lognormal size distribution is assumed for sulphate, nitrate, ammonium, BC and OC (D'Almeida et al., Citation1991) with a median radius of 0.07, 0.07 µm, 0.07 µm, 0.01 µm and 0.02 µm, and geometric standard deviations of 2.0, 2.0, 2.0, 2.0 and 2.2, respectively. Mineral dust deflation and sea salt generation are calculated online using the same schemes as that in Han et al. (Citation2004), but five size bins (0.1–1.0, 1.0–2.0, 2.0–4.0, 4.0–8.0, 8.0–20.0 µm) are used in this study for dust and sea salt to save CPU time.
Dry deposition velocities of gases are parameterized using the scheme of Walmsley and Wesely (Citation1996), and subgrid cloud mixing and wet deposition are treated by a scavenging submodel (Chang et al., Citation1987). Dry deposition velocities of aerosols are calculated as the inverse of total resistances plus the gravitational settling term for different particle components and sizes. Below-cloud scavenging of aerosols is parameterized based on an expression of scavenging rate, which is a function of precipitation rate and collision efficiency of particle by hydrometeor (Han et al., Citation2004).
Aerosol optical properties (mass extinction coefficient, single scattering albedo and asymmetry factor) are mainly from OPAC (Optical Properties of Aerosols and Clouds) database (Hess et al., Citation1998). The original refractive index of mineral dust is substituted by data retrieved from dust samples of Chinese deserts (Wang et al., Citation2004). For details of aerosol optical properties used in RIEMS-Chemaero, see Han et al. (Citation2012).
An external mixture between aerosols is assumed in this study, which is considered to be more appropriate for areas close to aerosol sources (Giorgi et al., Citation2002), and also generally consistent with some observations in China (Cheng et al., Citation2008; Liu et al., Citation2009). The effect of relative humidity (RH) on aerosol extinction efficiency is considered by multiplying aerosol mass extinction coefficient at dry condition and hygroscopic growth factor of aerosol scattering coefficient that is a function of RH. Hygroscopic growth factors for inorganic aerosols and sea salt are derived from the dataset proposed by Pitchford et al. (Citation2007), which are almost identical to the observed curves of light scattering hygroscopic growth factors in China (Liu et al. Citation2012). Based on observations in China, Pan et al. (Citation2009) suggested a parameterization for scattering hygroscopic growth factor during dust period and this parameterization is used for dust aerosol in this model. Some observations in East Asia (Kim et al., Citation2006; Liu et al. Citation2008, Citation2012) and other places (Malm and Day, Citation2001; Randles et al., Citation2004) suggested that the scattering hygroscopic growth of carbonaceous aerosols is weak. According to these studies, BC is considered to be insensitive to RH. The hygroscopic growth function for OC was derived from the observational study of Xu et al. (Citation2002) in China, in which OC dominated the aerosol mass during the study period.
Aerosol direct radiative forcings are calculated by the modified CCM3 model of NCAR (Keihl et al., Citation1996). The solar spectrum is divided into 18 spectral intervals spanning from 0.2 to 5.0 µm. A delta-Eddington approximation is used to calculate the solar fluxes. For longwave radiation, dust transmission is assumed to decay exponentially as described in Carlson and Benjamin (Citation1980). Longwave radiation by other aerosol types is not taken into account since they are much smaller than shortwave radiation.
Chemistry/aerosol modules are called every time step (2.5 min) to simulate the aerosol radiative effect online in RIEMS-Chemaero, and then feedback to the climate model. In this way, interactions between chemistry/aerosol and climate can be well represented.
2.2. Model parameters
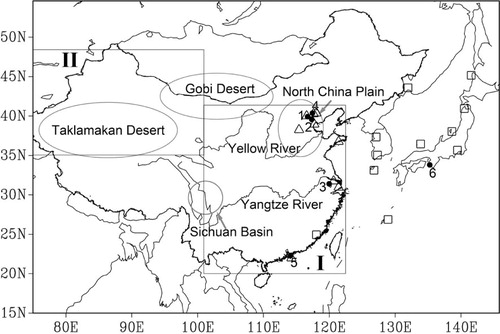
RIEMS-Chemaero applies a Lambert conformal projection with a horizontal resolution of 60 km. The study domain centres at 30°N, 110°E, with 89 grid cells in the latitudinal direction and 75 in the longitudinal direction. The non-hydrostatic vertical coordinate consists of 16 sigma layers from the surface to 100 mb. The study domain covers most parts of East Asia (15°–55°N, 75°–145°E; ).
Fig. 1 The study domain, locations of landmarks, EANET sites (open squares, see ), China sites (open triangles, see ) and AERONET sites (close circles, 1: Beijing, 2: Xianghe, 3: Taihu, 4: Xinglong, 5: Hong Kong PolyU, 6: Shirahama). Area I is defined as eastern China (ECHN, 20°–42°N, 100°–123°E), Area II is defined as western China (WCHN, 35°–48°N, 75°–100°E).
In total, 6 years (1850, 1970, 1980, 1990, 2000 and 2010) are simulated to investigate the long-term trends of aerosol loadings and direct radiative forcings over East Asia. For each run, 1 month (December) prior to each year is taken as initialization to reach chemical equilibrium.
For the year 1850, global model results with a temporal resolution of 6-hour and a horizontal resolution of 1.5°×1.5° from IAP-AGCM model (Zeng et al., Citation1989) are used to drive RIEMS-Chemaero. For the other years, reanalysis data, four times a day with 2.5°×2.5° resolution for 1970, 1980 and 1990 and with 1°×1° resolution for 2000 and 2010, are obtained from the National Centers for Environmental Prediction (NCEP) to provide initial and boundary conditions for RIEMS-Chemaero.
Anthropogenic and biomass burning emissions of SO2, NOx, CO, NMVOC, BC and primary OC for the 6 years with 0.5°×0.5° resolution are derived from the IPCC AR5 (the Intergovernmental Panel on Climate Change Fifth Assessment Report) inventory (Lamarque et al., Citation2010) and are bilinearly interpolated to the model projection. We found that the spatial distribution of NH3 emission in the IPCC AR5 inventory may be incorrect because its distribution pattern is very different from previous studies for East Asia (Streets et al., Citation2003; Yamaji et al., Citation2004). Considering the NH3 emission amount from the IPCC AR5 inventory is similar to that from the TRACE-P inventory (Streets et al., Citation2003) for the year 2000 within East Asia and the TRACE-P inventory provides a more reasonable spatial distribution, we used the TRACE-P NH3 emission inventory for the years 2000 and 2010 in this work. For the other years, we scaled the distribution of NH3 emission by multiplying the 2000-yr TRACE-P NH3 emission and a ratio (ryr=IPCC_NH3_emisyr/IPCC_NH3_emis2000) that can reflect the NH3 emission level for a specific year within East Asia based on the IPCC AR5 inventory.
The trends of SO2 and BC emissions, which are highly related to industrial level and fossil fuel consumption, are shown in . In general, SO2 emission in East Asia (the whole model domain) increased continuously from about 0.4 Tg yr−1 in the preindustrial period (1850) to about 34.1 Tg yr−1 at present day (2010), while the global emission trend turned from increase to decrease during the 1980s. The increase of East Asian SO2 emission was larger during the periods 1850–1970, 1980–1990 and 2000–2010 than the periods 1970–1980 and 1990–2000.
Fig. 2 East Asia (solid dot), eastern China (ECHN, solid square), western China (WCHN, solid cross) and global (dash circle) emissions (anthropogenic+biomass burning) of SO2 and BC derived from IPCC AR5 (global emissions are scaled by 1/10).
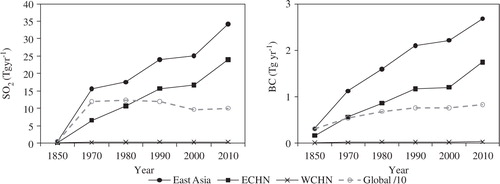
BC emission in East Asia increased continuously from 1850 to 1980, slowed down during 1990–2000 and speeded up again during 2000–2010. BC emission was 0.3 Tg yr−1 in 1850, and this value grew up to 2.7 Tg yr−1 in 2010.
We define two regions in this study, namely the densely populated eastern China (20°–42°N, 100°–123°E, hereinafter ECHN; ) and the sparsely populated and desert dominated western China (35°–48°N, 75°–100°E, hereinafter WCHN; ), to investigate sub-regional differences. The SO2 and BC emissions for ECHN and WCHN are also displayed in . Both SO2 and BC emissions in ECHN follow the trends of the East Asian emissions and take up more than half of total East Asian emissions, showing that the emissions in ECHN determine that in East Asia. Emissions of SO2 and BC in WCHN are always nearly ignorable.
Boundary conditions for gases and aerosols are derived from global chemical transport model MOZART-4 (Model for Ozone and Related chemical Tracers, version 4; Emmons et al., Citation2010) (available at http://www.acd.ucar.edu/wrf-chem/mozart.shtml) for the years 2000 and 2010 (the values of 2003 were used for the year 2000 instead due to lack of data). For years prior to 2000, we prescribed the boundary conditions based on global model results from Barth et al. (Citation2000), Marmer et al. (Citation2007) and Kim et al. (Citation2008).
2.3. Observation data
Surface monthly mean inorganic component (sulphate, nitrate and ammonium) measurements are obtained from EANET (http://www.eanet.asia/jpn/index.html), which begins regular monitoring phase since 2001. Observations of aerosol components in China reported in previous publications are also collected and used in model comparison due to limited data for China in EANET. There is almost no measurement for aerosol components in China before 1990.
Daily mean aerosol optical depth (AOD) at 550 nm retrieved from MODIS (MODerate-resolution Imaging Spectroradiometer) on board Terra satellite is used to verify model results. The MODIS AOD is only available after March 2000. Theoretically, MODIS can provide one retrieval data per day around 10:30 LST anywhere globally (no data available for a grid occupied by cloud). This means that for a specific place (in this study, East Asia), a number of 365/366 data at most are available for a year. In this study, there are 306 retrieved data available for 2000 (1 March–31 December) and 365 data for 2010 (1 January–31 December) at most for a certain grid.
Ground AOD measurements in 2010 from six AERONET sites, namely Beijing, Xianghe, Xinglong, Taihu, Hong Kong PolyU and Shirahama, are also used for model comparison. Locations of the AERONET sites are marked in . Beijing (39.98°N, 116.38°E) is an urban site in the downtown part of the city. Xianghe (39.74°N, 116.96°E) is a suburban site 45 km southeast to Beijing downtown. Taihu (31.42°N, 120.22°E) is a rural site located at the edge of the Taihu Lake in east China. Xinglong (40.40°N, 117.58°E) is also a rural site 120 km northeast of Beijing. Though Hong Kong PolyU (22.30°N, 114.18°E) is an urban site at Hong Kong Polytechnic University, it is not surrounded by heavy industry and traffic. Shirahama (33.69°N, 135.36°E) is situated on the south coast of Japan. Hourly AOD measurements used in this work are derived from raw data with discrete samples for each hour.
3. Results and discussions
3.1. Model validation
3.1.1. Aerosol components
Measured and modelled annual mean aerosol inorganic aerosol components at EANET sites for the year 2010 are listed in (sites are indicated in ). In general, RIEMS-Chemaero reproduces the magnitude and spatial distribution of sulphate, nitrate and ammonium well, generally showing higher concentrations over the continent than those in the western Pacific Ocean. The model tends to underestimate sulphate and nitrate concentrations in urban sites (Hongwen, Tokyo), which could be due to underestimation of urban emission or relatively coarse grid size. However, the model tends to overestimate aerosol concentrations in the Korean sites (Kanghwa, Cheju and Imsil). The observed and modelled annual mean inorganic aerosol concentrations averaged over all sites are quite close, although the model slightly under-predicts nitrate (7%) and over-predicts ammonium concentrations (12%).
Table 1. Comparisons of annual mean inorganic components between observations and simulations at EANET sites (units: µg m−3)
Because there is only one China site in EANET (Hongwen), observations of inorganic and carbonaceous aerosols conducted in China were collected from previous publications and compared with corresponding model results around the simulation years 1990, 2000 and 2010 (, sites are indicated in ). In general, RIEMS-Chemaero reproduces the increasing trend of sulphate but slightly under-predicts the magnitude. In 2000, sulphate shows high concentrations at urban sites of east China (Beijing, Shanghai and Nanjing), slightly lower concentration at a rural site of east China (Qingdao), and further lower concentration at a rural site of south China (Hok Tsui). The model generally reproduces such spatial distribution of sulphate quite well. Compared with 2000, both observation and simulation show an obvious increase of sulphate concentration at urban sites of north China in 2010, but the model tends to under-predict sulphate at Tianjin, Shijiazhuang and Chengde, which may be attributed to both emission uncertainties and relatively coarse model resolution that cannot properly reflect complex urban conditions. Though the model reproduces the increasing trend and urban–rural gradient of nitrate in China, it tends to under-predict nitrate concentrations, mainly due to uncertainties in emission inventories, relatively coarse model resolution, as well as the complex nitrate chemistry which is difficult to be well treated in the current chemistry model. The interannual variation of ammonium concentration in China is smaller than those of sulphate and nitrate, and the model performance for ammonium is better than those for sulphate and nitrate. Averaged over all sites in China during 1990–2010, the model tends to under-predict sulphate and nitrate by 15% and 35%, respectively, and predicts well the ammonium concentration.
Table 2. Comparisons of observed and simulated aerosol components in China (units: µg m−3)a
The model performance is not as good for BC and OC, showing a general under-prediction in China. The observation-model discrepancies for both BC and OC are larger in 1990 and in urban sites (such as Beijing, Shanghai). Nevertheless, the model still reflects the lower carbonaceous aerosol concentrations in a rural site (Hok Tsui) than in urban sites. Streets et al. (Citation2003) indicated that the estimated Asian BC and OC emissions were 360% and 450% uncertain, respectively, in the TRACE-P inventory for 2000. Carmichael et al. (Citation2003) suggested that the BC emission in the TRACE-P inventory could be seriously underestimated after comparing model results with observations. The emission amounts of BC and OC in the IPCC AR5 inventory for 2000 are similar to those in the TRACE-P inventory, implying large uncertainties of BC and OC emissions in current IPCC AR5 inventory. Besides, the under-prediction of OC could also be attributed to the uncertainties in treating SOA formation that is a major weakness in current chemistry models, almost all of which tend to under-predict SOA at present. Averaged over all sites, the observations of BC and OC are 6.6 and 15 µg m−3, whereas the simulations are 2.4 and 5.8 µg m−3, respectively.
The above comparison demonstrates that RIEMS-Chemaero is able to predict inorganic aerosol components reasonably well in East Asia, with better performance in rural and remote sites than in urban sites, but the model tends to under-predict carbonaceous aerosol concentrations by a factor of 2–3. Although inorganic aerosols are major contributors to AOD, the under-prediction of carbonaceous aerosols may lead to lower AOD simulation to some extent.
3.1.2. AOD from MODIS
shows the annual mean AOD from MODIS (1°×1° resolution) aerosol products and from model predictions (60 km resolution) for 2000 (a, b) and 2010 (c, d). Simulated AODs at 10:30 (results averaged from 10:00 and 11:00 LST) were sampled according to the MODIS retrievals that were bilinearly interpolated to the model projection. MODIS retrievals are unavailable over deserts (shown as white areas in a, c).
Fig. 3 MODIS retrieved (a, c) and simulated (b, d) annual mean AOD at 550 nm at 10:30 LST in 2000 (a, b) and 2010 (c, d). Simulated AOD was sampled according to MODIS daily values.
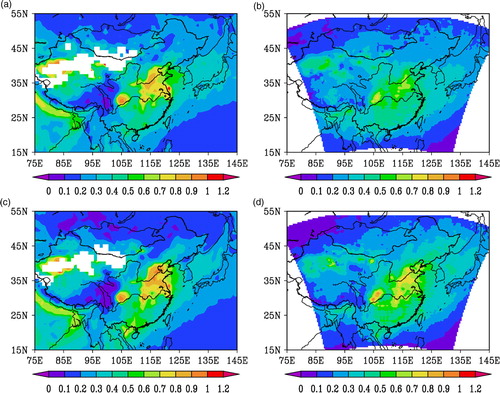
Satellite retrievals (a, c) show that there are two large AOD centres over ECHN in both 2000 and 2010: the wider one occurs over the north of ECHN (includes parts of the North China Plain and the lower reaches of the Yellow River) and the narrower one appears over the Sichuan basin. The annual mean values over these centres are about 0.7–1.0. Large AOD also appears over the middle and lower reaches of the Yangtze River (0.7–0.9). The AOD is moderate (0.3–0.6) over south China (south of the Yangtze River). Comparing between a, c, the AOD in 2010 (c) is generally larger than that in 2000 (a), especially over north of ECHN and the middle and lower reaches of the Yangtze River.
Comparing with satellite retrievals, the model generally predicts the spatial distribution of annual mean AOD for both 2000 and 2010 (b, d), reproducing the largest AOD over the north of ECHN and the Sichuan basin, large AOD over the middle and lower reaches of the Yangtze River, and moderate AOD over south China. The model also reproduces well the larger AOD in 2010. However, the model generally under-predicts the AOD magnitude. For the year 2000 (b), RIEMS-Chemaero under-predicts the annual mean AOD by about 0.1–0.2 over the Sichuan basin and by about 0.2–0.3 over the north of ECHN. For the year 2010 (d), the model performance is better, but it still underestimates the annual mean AOD over north of ECHN by about 0.1–0.3.
As mentioned in section 3.1.1, under-prediction of carbonaceous aerosols should partly account for the under-predicted AOD. Moreover, lacking some other aerosol sources (such as primary PM other than BC and OC from industry, power generation and residential) and uncertainties in treating aerosol hygroscopic growth in the model may also contribute to the model under-predictions.
3.1.3. AOD from AERONET
presents the statistics of model-observation comparison for hourly AOD at the six AERONET sites. In Beijing and Xianghe, the model predicts the hourly variation of AOD reasonably well, with correlation coefficients of 0.62 and 0.61, respectively, but the model tends to under-predict the annual mean AOD by 0.16 (28.1%) and 0.19 (33.3%) at the two sites. In Taihu, Xinglong, Hong Kong PolyU and Shirahama, model predictions are closer to observations, with MBE (NMB) of −0.07 (−11.5%), 0.01 (3.6%), −0.05 (−13.5%) and −0.02 (−9.1%), respectively. However, the model just produces moderate–high correlations at the four sites (0.48, 0.53, 0.47 and 0.55). The overall statistics for the six sites exhibit a correlation coefficient of 0.6, MBE of −0.09, and NMB of −20.4%, showing that the model is able to simulate the spatial and temporal variation of AOD over East Asia generally well but somewhat underestimates the AOD magnitude. The geographical gradient of AOD among those sites is also well reproduced by the model, exhibiting higher AOD in Beijing, Xianghe and Taihu, and lower AOD in Xinglong and Shirahama.
Table 3. Statistics of comparison for hourly AOD at AERONET sites for 2010
Comparisons in sections 3.1.2 and 3.1.3 demonstrate that RIEMS-Chemaero is able to capture most of the major features of AOD distribution in East Asia but tends to underestimate the magnitude over eastern China.
3.2. Long-term trends of aerosol compositions
3.2.1. Inorganic aerosol
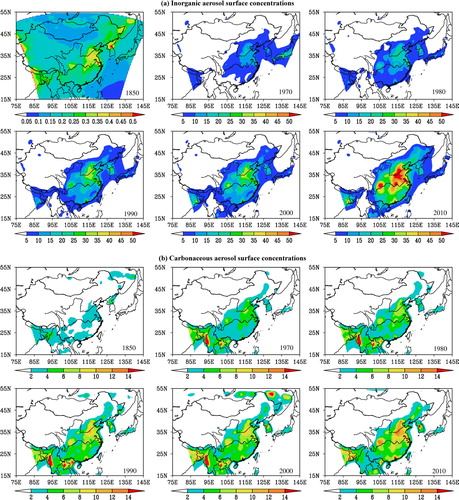
In this work, inorganic aerosol includes sulphate, nitrate and ammonium. a presents the spatial distribution of the annual mean near-surface inorganic aerosol concentrations (from the first model layer) for the six simulated years. As expected, surface inorganic aerosol concentration experienced a very low level in 1850 (note the scale of colour bar is 0.01 times that in other year). The inorganic aerosol concentration was lower than 20 µg m−3 in 1970 and lower than 25 µg m−3 in 1980 over China, with north of ECHN and the Sichuan basin the high concentration centres. Meanwhile, the concentration in eastern Japan reached as high as 35 µg m−3 in 1970 and decreased below 15 µg m−3 in 1980. Both magnitudes and distribution patterns of inorganic aerosol were similar to each other in 1990 and 2000 because of the implementation of emission control policy by the Chinese government during this period. The inorganic aerosol concentration increased to 20–35 µg m−3 over the two high centres of China and to 10–20 µg m−3 over most areas of ECHN in both 1990 and 2000. Due to the emission increase, the magnitude of inorganic aerosol concentration over China peaked in 2010. The two high centres experienced a concentration as high as around 50 µg m−3. A third high centre formed over the middle reaches of the Yangtze River (40–50 µg m−3). The concentration was also high over parts of south China (25–40 µg m−3) in 2010.
Fig. 4 Annual mean near-surface concentrations of (a) inorganic aerosol (sulphate+nitrate+ammonium) and (b) carbonaceous aerosol (BC+OC) (units: µg m−3) from the model. White shadings indicate concentrations in between 0–5 µg m−3 for inorganic aerosol and 0–2 µg m−3 for carbonaceous aerosol.
To quantify the long-term trends of total inorganic aerosol and its components, domain and annual mean column burdens of inorganic aerosols were calculated for the whole of East Asia, the ECHN region and the WCHN region (). For East Asia, the domain and annual mean inorganic aerosol burden increased continuously from 0.8 mg m−2 in 1850 to 18.7 mg m−2 in 1990, changed slightly in 2000 (18.6 mg m−2), and then decreased to 18.1 mg m−2 in 2010. For ECHN, the inorganic burden generally follows the trend in East Asia during 1850–2000, showing a slight change between 1990 and 2000 due to emission control in China. However, the ECHN burden rose again to a peak of 32.9 mg m−2 in 2010. The difference between the ECHN value and the East Asian value was only 3.9 mg m−2 in 1970, but this value became 14.7 mg m−2 in 2010, indicating the increasing contribution of inorganic aerosol from eastern China.
Table 4. Domain and annual mean burdens of aerosols (units: mg m−2)
also lists domain and annual mean sulphate, nitrate and ammonium burdens. For East Asia, the interannual trends of sulphate, nitrate and ammonium burdens are almost identical to that of total inorganic aerosol, except that sulphate reached its peak in 2000 and nitrate increased again during 2000–2010. For ECHN, the interannual trends of inorganic aerosols are different to those for East Asia. The burden of inorganic aerosols in ECHN increased faster than those in East Asia from 1970 to 1990. Although the increasing trend in ECHN slowed down or even decreased (like nitrate) during 1990–2000, similar to those in East Asia, they began to increase significantly again after 2000 and reached their maximum in 2010, quite different from the decreasing trend or the slight increasing trend (nitrate) for East Asia. In ECHN, despite the increasing sulphate burden, its proportion in total inorganic aerosol decreased from 51% in 1970 to 44% in 2010, while the proportion of nitrate increased from about 26% to 33%, indicating the increasing importance of nitrate in eastern China.
Giorgi et al. (Citation2002) estimated a sulphate burden of about 417 Gg yr−1 for East Asia for the 5-yr period of 1993–1997 by using a regional climate model (RegCM), and the sulphate burden estimated from this study is about 240 Gg yr−1 for East Asia averaged over 1990 and 2000. The SO2 emission amounts for East Asia used in the above studies are about 25 and 22 Tg yr−1, respectively, which can partly explain the lower simulated sulphate burden in this study. Also, the different simulation years with different meteorological fields (such as wind speed, cloud, precipitation, etc.), the treatments of chemistry and depositions in each model may also lead to difference in sulphate burden estimation to some extent. Horowitz (Citation2006) simulated the annual mean column burden of sulphate to be about 1–2 mg m−2 in 1860 and greater than 20 mg m−2 in 2000 over most of eastern China using a global chemical transport model (MOZART), while corresponding sulphate burdens in this work are ~0.8 mg m−2 in 1850 and about 18–24 mg m−2 in 2000 over ECHN. Using a global chemistry model (GISS), Bauer et al. (Citation2007) estimated the annual mean sulphate and nitrate burdens to be about 17–25 and 14–21 mg m−2 in 2000 over north and central China, respectively. In this work, sulphate and nitrate burdens are estimated to be 18–24 and 14–22 mg m−2 over similar areas in 2000. Although differences exist in model treatment, emission inventory, study domain and time period, the estimated column burdens of inorganic aerosols from this study are generally consistent with previous studies.
3.2.2. Carbonaceous aerosol
b presents the distribution of surface carbonaceous aerosol concentrations. In 1850, carbonaceous aerosol ranged from 2 to 4 µg m−3 over parts of eastern China, the Sichuan basin and southern China, and below 2 µg m−3 over the rest of China. The carbonaceous aerosol levels were generally lower than 8 µg m−3 over China in 1970 and 1980, with higher concentrations (4–8 µg m−3) appearing over the north of ECHN and the Sichuan basin. Both magnitudes and spatial distributions were similar in 1990 and 2000 with generally higher concentrations than those in 1970 and 1980. In 1990 and 2000, the concentrations were 8–10 µg m−3 over the north of ECHN and the Sichuan basin, 4–8 µg m−3 over most of the rest of eastern China, and below 2 µg m−3 over most of northeast and west China. In 2010, the surface carbonaceous aerosol concentration over China reached its maximum. The annual mean concentration was greater than 8 µg m−3 over large portions of eastern China, with values ranging from 8 to 14 µg m−3 over the north of ECHN and the Sichuan basin.
The domain and annual mean column burden of BC, OC and total carbonaceous aerosols are listed in . In East Asia, the carbonaceous aerosol burden peaked in 1980 (5.2 mg m−2) and then decreased until 2010 (4.6 mg m−2) with little change during 1990–2000. A similar trend is seen for ECHN, except that higher burdens occurred during 1980–2000, which is somewhat different from the trend of surface concentration in ECHN; this is because the biomass burning emission in Southeast Asia was stronger during 1980–2000 than that in 2010, which could have affected carbonaceous aerosol concentration in ECHN under southwesterlies. indicates that OC determines the magnitude and the interannual trend of carbonaceous aerosol. Different from total carbonaceous aerosol, BC burden shows a continuously increasing trend from 1850 to 2010 in both East Asia and ECHN. About 12% (12%) carbonaceous aerosol was contributed by BC in 1970 in East Asia (ECHN), and this value increased to about 16% (18%) in 2010, implying the increasing importance of BC in this region.
Recently, Zhuang et al. (Citation2011) estimated an average BC burden of 1.1 mg m−2 for East Asia in 2006 by using a regional model, and the estimated BC burden in this study is 0.8 mg m−2 in 2010. Using the MOZART model, Horowitz (Citation2006) simulated the largest BC burden over ECHN to be about 0.1–0.5 mg m−2 in 1860 and about 2–5 mg m−2 in 2000, while the predicted values over similar regions in this work are ~0.3 mg m−2 in 1850 and ~2 mg m−2 in 2000. By using a global model (CAM3), Zhang et al. (Citation2009) indicated that under present day (1981–2001) emission conditions, the maximum annual mean BC and primary OC burden over East Asia (mainly distributed over eastern China) could be about 3 and 10 mg m−2. In this work, BC and primary OC burdens averaged over 1980–2000 show a maximum of 4 and 10–20 mg m−2, respectively, over eastern China.
3.2.3. Dust aerosol
As one of the major dust source regions in the world, large amounts of dust aerosol are ejected into the atmosphere over East Asia. From 1850 to 2010, the distribution pattern of dust did not change significantly (figure not shown): dust mainly distributed over the two dust source regions in East Asia, namely the Taklimakan desert in west China and the Gobi desert along the China–Mongolia border. Vast downwind areas, including parts of ECHN, Korean Peninsula, north of the west Pacific Ocean, and Japan, were affected by dust.
shows that the domain and annual mean column burden of dust for all three regions decreased sharply from 1970, reached the lowest level in 1980, and then increased gradually since 1990. WCHN experienced larger increase of dust column burden (65%) than that in ECHN (20%) during 1980–2010. This trend of dust is consistent with previous studies: the dust event frequency in China was high in early 1970s, has been on the decline since late 1970s, and bounced back in late 1990s (Zhang et al., Citation2003b; Shao and Dong, Citation2006). The estimated highest burdens for East Asia and ECHN both appeared in 1970 (223 and 331 mg m−2, respectively), while that for WCHN was in 2010 (520 mg m−2).
3.3. Long-term trend of AOD
Both distribution pattern and magnitude of AOD change a lot from 1850 to 2010 (a). In 1850, when there was barely anthropogenic emission in East Asia, AOD was dominated by natural aerosol (mainly dust) and as a result, the annual mean AOD of 0.1–0.3 appeared over desert areas in northwest China and the dust affected downwind areas. In 1970, the combination of dust and anthropogenic aerosol resulted in relatively large AOD values over the Gobi desert (0.2–0.3), most of ECHN (0.2–0.4), and parts of the west Pacific region (0.2–0.3). The distribution patterns of AOD were similar in 1980 and 1990, but the values were larger in 1990. The Sichuan basin was the large AOD centre, with annual mean AOD of 0.4–0.5 in 1980 and 0.5–0.7 in 1990. Annual mean AOD of 0.3–0.4 covered large portions of central ECHN in both 1980 and 1990, but the coverage was wider in 1990 than that in 1980. The AOD in 2000 was larger than those in 1980 and 1990 over central ECHN with annual mean values of 0.4–0.5; however, the AOD over the Sichuan basin was only about 0.4–0.6. Due to heavy dust loading, the AOD over the Taklimakan desert was large (0.2–0.3) in 2000. In 2010, the AOD reached its maximum, with values ranging from 0.4 to 0.7 over most of ECHN. The Sichuan basin and the middle reaches of the Yangtze River were large AOD centres (0.6–0.7). Also due to heavy dust loading, the AOD was 0.2–0.3 over the Taklimakan desert in 2010.
Fig. 5 Annual mean (a) AOD, (b) ADRFSRF (W m−2) and (c) ADRFTOA (W m−2) from the model.
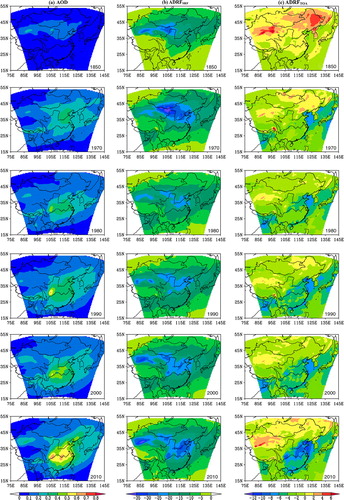
shows that the domain and annual mean AOD increased continuously from 1850 (0.06) to 2010 (0.2) in East Asia. The AOD shows little change during 1970–1980 and followed by a continuous increase from 1980 to 2010. The mean AOD in ECHN shows a similar trend to that in East Asia except that the AOD in ECHN also kept similar levels in 1990 and 2000, mainly due to the emission control in China. The values in ECHN are also larger than those in East Asia. Comparing between Table and 5 , the AOD trends are highly correlated with the trends of inorganic aerosol burdens in both East Asia and ECHN. This is because inorganic aerosols are major contributors to AOD. However, the burden trends are not linearly linked to the AOD trends: for example, in East Asia, the inorganic burden peaked in 1990 but the AOD peaked in 2010. Meteorological conditions (i.e. Asian monsoon and water vapour change) may be responsible for this discrepancy.
Table 5. Domain and annual mean AOD (unitless), and all-sky aerosol direct radiative forcings at surface (ADRFSRF) and at top of the atmosphere (ADRFTOA) (units: W m−2)
Streets et al. (Citation2008) have estimated the AOD trend from 1980 to 2000 for China based on the modelling works of Chin et al. (Citation2002, Citation2004). In their study, the average AOD in China rose from a value of about 0.25 in 1980, to a value of about 0.3 in 1990, to a peak value of 0.31 in 1996, and then declined to about 0.29 by 2000. The AOD variation in ECHN estimated from this study (0.23 in 1980, 0.28 in 1990 and 0.28 in 2000) is generally consistent with their results. Huang et al. (Citation2007) obtained an average AOD of 0.15 for East Asia for the mid-1990s using a regional coupled model (RegCM2), somewhat smaller than our estimation (0.18, the average of 1990 and 2000).
3.4. Long-term trends of direct radiative forcings due to aerosols
The estimated annual mean ADRFSRF (b) and ADRFTOA (c) under all-sky condition are presented.
The ADRFSRF is estimated to be negative over the entire domain all of the time. In 1850, when dust dominated, the ADRFSRF of −20 to −30 W m−2 mainly distributed over desert areas in northwest China. In 1970, due to frequent dust storms, strong ADRFSRF distributed over the Gobi desert (up to −35 W m−2) and the dust affected downwind areas (including the North China Plain and the Yellow Sea, −20 to −35 W m−2), which were mainly due to dust aerosols. Shao and Dong (Citation2006) indicated that the total number of dust days in north China was high in 1970, and dust event frequency has been on the decline since the late 1970s. The ADRFSRF became weaker in 1980 due to both less dust deflation and small anthropogenic emissions, and the annual mean values were in a range of −20 to −25 W m−2 over the Taklimakan desert, the Gobi desert, as well as the north of ECHN, and −15 to −20 W m−2 over the Sichuan basin. Compared to 1980, the ADRFSRF in 1990 was generally reinforced by about −5 W m−2 over some desert areas and the Sichuan basin, but remained at similar levels over the north of ECHN and most of south China. In both 2000 and 2010, the ADRFSRF over the Taklimakan desert and the Gobi desert was strong due to heavy dust deflations (up to −35 W m−2). Over the north of ECHN, the ADRFSRF in 2000 was in the range of −20 to −30 W m−2, stronger than that in 1990, and the strength was further reinforced to −25 to −35 W m−2 in 2010. The ADRFSRF was in the range of −25 to −30 W m−2 over the Sichuan basin and −10 to −20 W m−2 over south China in 2010. It can be found that four strong forcing centres have been established over the Taklimakan desert, the Gobi desert, the north of ECHN, and the Sichuan basin since 1980.
Different to the overall negative ADRFSRF, the annual mean ADRFTOA shows both negative and positive values (c). In 1850, East Asia was dominated by positive ADRFTOA with two centres (+2 to +6 W m−2) over the Taklimakan desert and northeast China. Dominance of absorbing aerosols (dust) and the combination effects of aerosol and cloud resulted in such patterns. In 1970, the positive ADRFTOA in the Taklimakan desert and northeast China was weaker (0 to+4 W m−2) than that in 1850, but relatively strong negative ADRFTOA (−6 to −8 W m−2) appeared over the Yellow Sea. Negative ADRFTOA has become dominant over eastern China since 1970 while positive values are mainly distributed over western and northeast China. The negative ADRFTOA was −6 to −8 W m−2 over the Yellow Sea, −2 to −6 W m−2 over north of ECHN, and −2 to −4 W m−2 over south China in 1980; however, weak positive radiative forcing was still found over the Taklimakan desert (0 to +2 W m−2). Both distribution pattern and strength of ADRFTOA were similar in 1990 and 2000: negative ADRFTOA dominated eastern China, with values in the range of −6 to −10 W m−2 over the Yellow Sea, −4 to −8 W m−2 over the north of ECHN and the Sichuan basin, and −4 to −6 W m−2 over portions of south China; meanwhile, positive ADRFTOA occurred over the Taklimakan desert and parts of northeast China (0 to +2 W m−2). In 2010, the negative ADRFTOA over eastern China reached the maximum, with values of −8 to −12 W m−2 over the Yellow Sea and −8 to −10 W m−2 over the north of ECHN and the Sichuan basin, while positive ADRFTOA was also found to be large over the Taklimakan desert (0 to +6 W m−2).
shows that the domain and annual mean ADRFSRF for East Asia increased from −7.9 to −11.8 W m−2 during 1850–1970, then decreased to −10.4 W m−2 in 1980, and reinforced to the peak of −11.9 W m−2 in 2000. The interannual trend of ADRFSRF in ECHN is close to that in East Asia, except that it peaked in 2010 (−17.5 W m−2), while the trend in WCHN is identical to that in East Asia. For East Asia, the average ADRFTOA was +0.4 W m−2 in 1850, and this value has become negative since 1970, strengthened to the negative peak (−2.9 W m−2) in 1990, changed slightly during 1990–2000, and then weakened to −2.2 W m−2 in 2010. The interannual trend of ADRFTOA in ECHN resembles that in East Asia before 2000, but it peaked in 2010 (−4.8 W m−2). The trend of ADRFTOA in WCHN is identical to that of East Asia but with stronger positive forcings and weaker negative values due to dust. Comparing the interannual variations of AOD, ADRFSRF and ADRFTOA, it can be found that despite the general consistencies among them, there are differences between ADRFSRF and ADRFTOA trends and that of AOD, due to the effects of cloud conditions and aerosol optical properties (such as SSA) in different years.
By using the RegCM2, Huang et al. (Citation2007) estimated that from August 1994 to August 1995, aerosols induced an average direct radiative forcing of −4.6 W m−2 at TOA and −7 W m−2 at surface in East Asia (land areas only), while our estimation of aerosol direct radiative forcing is −2.8 W m−2 at TOA and −11.6 W m−2 at surface in this region (both land and ocean areas are counted) averaged over 1990 and 2000. Han et al. (Citation2011) adopted a modified CMAQ and simulated the annual mean ADRFTOA to be −4 to −12 W m−2 and the ADRFSRF to be −10 to −25 W m−2 under all-sky condition over most of eastern China for the year 2005, while our estimations averaged over 2000 and 2010 are −4 to −10 W m−2 for ADRFTOA and −10 to −30 W m−2 for ADRFSRF. Besides magnitudes, the distribution features of aerosol direct radiative forcings are also similar between this study and Han's work despite the differences in model, emission and simulation period.
3.5. Relative contributions of emission and meteorology to the long-term trend
Table and 5 show that after a stable level of aerosol concentration during 1990–2000, inorganic aerosol and AOD experienced an obvious increase in east China during 2000–2010. East Asia is a typical region with monsoon climate and emissions largely varied, which should be responsible for the above changes. To identify the relative contributions of the two drivers to the changes, we conducted an additional numerical experiment with emissions from 2010 and meteorology from 2000. presents the surface concentrations of inorganic aerosols averaged over ECHN () from the three simulations (Case A and Case B refer to the previous two base cases with emission and meteorology of 2000 and 2010, respectively, and the new case refers to Case C with the meteorology of 2000 but the emissions of 2010). The difference between Case A and Case B may indicate the concentration change due to both emission and meteorology (the effect of boundary condition on ECHN is small compared with emission and meteorology), whereas the difference between A and C indicates the aerosol changes due to emission variation, and the difference between B and C indicates the aerosol change due to meteorology variation. The near-surface meteorological variables such as wind speed and precipitation that are the most important indicators of monsoon strength are also shown in the table. It shows that the mean wind speed and precipitation in 2010 (4.1 m s−1 and 134.2 cm grid−1) are both larger than those in 2000 (3.9 m s−1, 130.8 cm grid−1), which could result in lower aerosol concentrations in 2010 due to stronger turbulent diffusion and wet scavenging, and this means that the meteorological variation during 2000–2010 favours a decrease of aerosol concentration. shows that the mean surface inorganic aerosol concentration increases from 12.6 µg m−3 in 2000 (Case A) to 22.6 µg m−3 (79%) in 2010 (Case C), which is due to the emission increase during 2000–2010, but it is noteworthy that the mean concentration just increases from 12.6 µg m−3 in 2000 (Case A) to 21.8 µg m−3 (72%) in 2010 (Case B) while considering both emission and meteorology variations, suggesting that the stronger monsoon in 2010 leads to a decrease of the surface aerosol concentration and mitigates the aerosol increase due to increasing emissions. Consistently, AOD in ECHN increases from 0.28 to 0.35 (by 25%) during 2000–2010 (Case A to Case B), but if just considering emission increase and keeping meteorology unchanged (Case A to Case C), AOD can increase from 0.28 to 0.37 (by 32%), due to a weaker monsoon in 2000. The above analysis demonstrates that although monsoon variation could affect aerosol to some extent, the emission variation plays a dominant role in determining the trend of aerosol during 2000–2010 in ECHN, and given the generally stable level of dust aerosol concentration in this period, it is the anthropogenic emission increase that results in the obvious increase of aerosol concentration and direct radiative forcing in this region.
Table 6. Comparison of base simulations and sensitivity simulationa
4. Conclusions
An online-coupled regional climate-chemistry-aerosol model (RIEMS-Chemaero) has been used to investigate the long-term trends of aerosol concentrations, burdens and aerosol direct radiative forcings in East Asia with a focus on eastern China. The model was run for the years of 1850, 1970, 1980, 1990, 2000 and 2010 using anthropogenic and biomass burning emissions from the IPCC AR5 emission inventory.
Model simulation was evaluated against surface observations of aerosol components from EANET sites and from previous publications for 1990, 2000 and 2010, and comparisons demonstrate a good skill of RIEMS-Chemaero in reproducing spatial features and interannual variations of inorganic aerosol concentrations over East Asia, showing higher inorganic aerosol concentrations over East Asian continent than those over the ocean and increasing tendencies of sulphate and nitrate levels. In general, the model reproduces sulphate well and tends to under-predict nitrate but slightly over-predict ammonium. The model generally tends to under-predict BC and OC concentrations within the domain. Model comparisons with MODIS retrieved AOD in 2000 and 2010, and surface AOD measurements from AERONET in 2010 show that the model is able to reproduce the AOD distribution features reasonably well but tends to generally under-predict the magnitude. Both satellite retrievals and model simulations reflect the largest AOD over north of ECHN and the Sichuan basin. The comparison with AOD at the AERONET sites exhibits an overall correlation coefficient of 0.6 and model results differ by −20% relative to observations.
Surface inorganic aerosol (sulphate, nitrate and ammonium) was very low in 1850 and has mainly distributed over eastern China since 1970, with higher concentrations appearing over the north of eastern China (ECHN) and the Sichuan basin. The surface concentration level increases continuously from 1970 to 2010. The domain and annual mean inorganic aerosol burden in East Asia rose from 1850, experienced a rapid increase from 1970 and peaked in 1990 (18.7 mg m−2), maintained at this level (18.6 mg m−2) in 2000 mainly due to emission control in China, and declined to 18.1 mg m−2 by 2010. In ECHN, the interannual trend of inorganic aerosol burden was close to that in East Asia during 1850–2000, but the burden remained high after 2000 and peaked in 2010 (32.9 mg m−2). Model results also show that sulphate is the major component of inorganic aerosol in East Asia, but its proportion in total inorganic aerosol exhibits a decreasing trend.
High concentrations of surface carbonaceous aerosol (BC and OC) were also mainly distributed over the north of ECHN and the Sichuan basin in China from 1970 to 2010 with increasing values. The domain and annual average burden of carbonaceous aerosol in East Asia reached the peak value of 5.2 mg m−2 in 1980, declining thereafter to 4.6 mg m−2 in 2010, with the burden changing slightly during 1990–2000. OC determined the trend and magnitude of carbonaceous aerosol burden, but its proportion in total carbonaceous aerosol decreased from 1850 to 2010, while BC burden as well as its percentage contribution to total carbonaceous mass increased continuously during the study period.
Though most dust particles are restricted within source regions in northwest China, a large amount of dust can still transport to downwind areas. The simulated highest dust burdens for East Asia and ECHN (222 and 331 mg m−2) both occurred in 1970, while the maximum burden in WCHN (520 mg m−2) was in 2010.
The distribution features of AOD generally follow those of the combination of anthropogenic aerosols and dust. Relatively large AOD was restricted over desert areas in northwest China in 1850. Since 1970, large AOD values have been mainly distributed over eastern China due to anthropogenic aerosols, with the Sichuan basin being the major large AOD centre, followed by the middle reaches of the Yangtze River. Due to heavy dust loadings, large AOD also occurred over the Gobi desert in 1970 and over the Taklimakan desert in 2000 and 2010. In terms of domain and annual average, the AOD value in East Asia showed a great increase from 1850 (0.06) to 1970 (0.16), followed by an almost unchanged period of 1970–1980, and then reached the peak of 0.2 in 2010. The interannual trend of AOD in ECHN is similar to that of East Asia, but with another little-change period of 1990–2000 mainly due to emission control in China.
The ADRFSRF due to all aerosols under all-sky condition is negative over the entire domain. Relatively strong ADRFSRF induced by dust distributed over desert areas in northwest China in 1850 and over the Gobi desert and dust affected downwind areas in 1970. Since 1980, four strong radiative forcing centres have been established over the Taklamakan desert, the Gobi desert, the north of ECHN, and the Sichuan basin. In East Asia, the domain and annual mean ADRFSRF experienced two strengthening periods (1850–1970 and 1980–2000) with the peak value of −11.9 W m−2 in 2000. The long-term trends of ADRFSRF in both ECHN and WCHN were similar to that in East Asia, except that the ADRFSRF in ECHN strengthened continuously after 2000 and reached its maximum of −17.5 W m−2 in 2010.
The ADRFTOA shows not only negative forcing but also positive forcing over some areas due to absorbing aerosols. Positive ADRFTOA dominated East Asia in 1850 due to the dominance of dust. Since 1970, negative forcing became dominant over eastern China, while positive forcing remains strong over west and northeast China. The domain and annual mean ADRFTOA was positive in East Asia (+0.4 W m−2) in 1850, and the value became negative since 1970, continued to its negative maximum (−2.9 W m−2) in 1990, kept on this level (−2.8 W m−2) in 2000, and then weakened thereafter to −2.2 W m−2 in 2010. The ADRFTOA in ECHN generally showed a similar long-term trend to that in East Asia, but it reinforced again after 2000 and reached the maximum in 2010 (−4.8 W m−2). The interannual trend of ADRFTOA in WCHN is identical to that for East Asia. The differences among trends of AOD, ADRFSRF and ADRFTOA in East Asia are results of combination effects of cloud conditions and aerosol optical properties in different years.
Sensitivity simulation was conducted to explore the relative contributions of emission and meteorology to the long-term changes in aerosol concentration and AOD. It is found that monsoon variation may affect aerosol concentration to some extent by altering turbulent diffusion and deposition processes, but the anthropogenic emission increase is the dominant driver determining the variation trend of aerosol concentration and direct radiative forcing in eastern China, where most of the East Asian emissions are located.
Leibensperger et al. (Citation2012) has conducted a study for the United States of America and found that in the USA, a turning point appeared during 1980–1990: after this period, the anthropogenic aerosol concentrations (sulphate, nitrate, ammonium, BC, OC) as well as the aerosol radiative forcing turned from ascending to descending. This study shows that a similar turning period (1990–2000) also exists for East Asia. However, in ECHN, the aerosol concentrations, AOD and aerosol direct radiative forcings all exhibited an increasing trend throughout the study period, although there was the short period 1990–2000 when aerosol levels were relatively stable.
Supplementary figure 1
Download TIFF Image (767 KB)Supplementary figure 2
Download TIFF Image (729.3 KB)Acknowledgements
This study was supported by the ‘Strategic Priority Research Program’ of the Chinese Academy of Sciences (Grant No. XDA05100502), the National 973 Project of China (No. 2010CB950804) and the National Natural Science Foundation of China (No. 41075106). We thank the scientists and staff from the Network Center for EANET for maintaining and offering EANET data, and principle investigators and their staff for establishing and maintaining the six AERONET sites used in this study, the MODIS mission scientists and associated NASA personnel for the production of the MODIS data used in this work, and Dr. Entao Yu and Dr. Tao Wang for providing model results of IAP-AGCM for 1850. The authors are very grateful to the two anonymous reviewers for their valuable comments and suggestions, which helped improve the manuscript.
Notes
To access the supplementary material to this article, please see Supplementary files under Article Tools online.
Related Research Data
References
- Barth M. C , Rasch P. J , Kiehl J. T , Benkovitz C. M , Schwartz S. E . Sulfur chemistry in the National Center for Atmospheric Research Community Climate Model: description, evaluation, features, and sensitivity to aqueous chemistry. J. Geophys. Res. 2000; 105(D1): 1387–1451.
- Bauer S. E , Koch D , Unger N , Metzger S. M , Shindell D. T , co-authors . Nitrate aerosols today and in 2030: a global simulation including aerosols and tropospheric ozone. Atmos. Chem. Phys. 2007; 7: 5043–5059.
- Carlson T. N , Benjamin S. G . Radiative heating rates for Saharan dust. J. Atmos. Sci. 1980; 37(1): 193–213.
- Carmichael G. R , Tang Y , Kurata G , Uno I , Streets D. G , co-authors . Evaluating regional emission estimates using the TRACE-P observations. J. Geophys. Res. 2003; 108: 8810.
- Chang J. S , Brost R. A , Isaksen I. S. A , Madronich S , Middleton P , co-authors . A three-dimensional Eulerian acid deposition model: physical concepts and formulation. J. Geophys. Res. 1987; 92(D12): 14681–14700.
- Chen Z. L , Ge S , Zhang J . Measurement and analysis for atmospheric aerosol particulates in Beijing. Res. Environ. Sci. 1994; 7(3): 1–9. in Chinese.
- Cheng Y. F , Wiedensohler A , Eichler H , Heintzenberg J , Tesche M , co-authors . Relative humidity dependence of aerosol optical properties and direct radiative forcing in the surface boundary layer at Xinken in Pearl River Delta of China: an observation based numerical study. Atmos. Environ. 2008; 42: 6373–6397.
- Chin M , Chu A , Levy R , Remer L , Kaufman Y , co-authors . Aerosol distribution in the Northern Hemisphere during ACE-Asia: results from global model, satellite observations, and Sun photometer measurements. J. Geophys. Res. 2004; 109: 23S90.
- Chin M , Ginoux P , Kinne S , Torres O , Holben B. N , co-authors . Tropospheric aerosol optical thickness from the GOCART Model and comparisons with satellite and sun photometer measurements. J. Atmos. Sci. 2002; 59: 461–483.
- D'Almeida G. A , Koepke P , Shettle E. P . Atmospheric Aerosols: Global Climatology and Radiative Characteristics. 1991; Hampton, Virginia, VA, USA: A Deepak Publishing. 1–561.
- Dickinson R. E , Henderson-Sellers A , Kennedy P. J . Biosphere-Atmosphere Transfer Scheme (BATS) Version 1e as coupled to NCAR Community Climate Model.
- Dickinson R. E , Henderson-Sellers A , Kennedy P. J . Biosphere-Atmosphere Transfer Scheme (BATS) Version 1e as coupled to NCAR Community Climate Model.
- Forster P , Ramaswamy V , Artaxo P , Berntsen T , Betts R , co-authors . Changes in Atmospheric Constituents and in Radiative Forcing. Climate Change 2007: The Physical Science Basis. Contribution of Working Group I to the Fourth Assessment Report of the Intergovernmental Panel on Climate Change. 2007; United Kingdom and New York, NY, USA: Cambridge University Press, Cambridge.
- Fu C. B . Potential impacts of human-induced land cover change on East Asia monsoon. Glob. Planet. Change. 2003; 37: 219–229.
- Fu C , Wang S , Xiong Z , Gutowski W. J , Lee D , co-authors . Regional climate model intercomparison project for Asia. Bull. Am. Meteorol. Soc. 2005; 86: 257–266.
- Fu Y , Liao H . Simulation of the interannual variations of biogenic emissions of volatile organic compounds in China: impacts on tropospheric ozone and secondary organic aerosol. Atmos. Environ. 2012; 59: 170–185.
- Gery M. W , Whitten G. Z , Killus J. P , Dodge M. C . A photochemical kinetics mechanism for urban and regional scale computer modeling. J. Geophys. Res. 1989; 94: 12925–12956.
- Giorgi F , Bi X , Qian Y . Direct radiative forcing and regional climatic effects of anthropogenic aerosols over East Asia: a regional coupled climate-chemistry/aerosol model study. J. Geophys. Res. 2002; 107(D20): 4439.
- Grell G. A . Prognostic evaluation of assumptions used by cumulus parameterizations. Mon. Weather Rev. 1993; 121: 764–787.
- Han X , Zhang M , Han Z , Xin J , Liu X . Simulation of aerosol direct radiative forcing with RAMS-CMAQ in East Asia. Atmos. Environ. 2011; 45: 6576–6592.
- Han Z . Direct radiative effect of aerosols over East Asia with a regional coupled climate/chemistry model. Meteorol. Z. 2010; 19: 287–298.
- Han Z , Ueda H , Matsuda K , Zhang R , Arao K , co-authors . Model study on particle size segregation and deposition during Asian dust events in March 2002. J. Geophys. Res. 2004; 109: 19205.
- Han Z , Zhang R , Wang Q , Wang W , Cao J , co-authors . Regional modeling of organic aerosols over China in summertime. J. Geophys. Res. 2008; 113: 11202.
- Han Z. W , Li J. W , Guo W. D , Xiong Z , Zhang W . A study of dust radiative feedback on dust cycle and meteorology over East Asia by a coupled regional climate-chemistry-aerosol model. Atmos. Environ. 2013; 68: 54–63.
- Han Z. W , Li J. W , Xia X. A , Zhang R. J . Investigation of direct radiative effects of aerosols in dust storm season over East Asia with an online coupled regional climate-chemistry-aerosol model. Atmos. Environ. 2012; 54: 688–699.
- He K , Yang F , Ma Y , Zhang Q , Yao X , co-authors . The characteristics of PM2.5 in Beijing, China. Atmos. Environ. 2001; 35: 4959–4970.
- Hess M , Koepke P , Schuit I . Optical properties of aerosols and clouds: the software package OPAC. Bull. Am. Meteorol. Soc. 1998; 79: 831–844.
- Holloway T , Sakurai T , Han Z , Ehlers S , Spak S. N , co-authors . MICS-Asia II: impact of global emissions on regional air quality in Asia. Atmos. Environ. 2008; 42: 3543–3561.
- Hong S. H , Pan H. L . Nonlocal boundary layer vertical diffusion in a medium-range forecast model. Mon. Weather Rev. 1996; 124: 2322–2339.
- Horowitz L. W . Past, present, and future concentrations of tropospheric ozone and aerosols: methodology, ozone evaluation, and sensitivity to aerosol wet removal. J. Geophys. Res. 2006; 111: 22211.
- Hu M , He L. Y , Zhang Y. H , Wang M , Kim Y. P , co-authors . Seasonal variation of ionic species in fine particles at Qingdao, China. Atmos. Environ. 2002; 36: 5853–5859.
- Huang Y , Chameides W. L , Dickinson R. E . Direct and indirect effects of anthropogenic aerosols on regional precipitation over East Asia. J. Geophys. Res. 2007; 112: 03212.
- Kajino M , Kondo Y . EMTACS: development and regional scale simulation of a size, chemical, mixing type, and soot shape resolved atmospheric particle model. J. Geophys. Res. 2011; 116: 02303.
- Kanakidou M , Seinfeld J. H , Pandis S. N , Barnes I , Dentener F. J , co-authors . Organic aerosol and global climate modelling: a review. Atmos. Chem. Phys. 2005; 5: 1053–1123.
- Keihl J. T , Hack J. J , Bonan G. B , Boville B. A , Briegleb B. P , co-authors . Description of the NCAR Community Climate Model (CCM3). 1996; 1–152. NCAR Tech Note. NCAR/TN-420+STR.
- Kim D , Wang C , Ekman A. M. L , Barth M. C , Rasch P. J . Distribution and direct radiative forcing of carbonaceous and sulfate aerosols in an interactive size-resolving aerosol–climate model. J. Geophys. Res. 2008; 113: 16309.
- Kim J , Yoon S.-C , Jefferson A , Kim S.-K . Aerosol hygroscopic properties during Asian dust, pollution, and biomass burning episodes at Gosan, Korea in April 2001. Atmos. Environ. 2006; 40: 1550–1560.
- Lack D. A , Tie X. X , Bofinger N. D , Wiegand A. N , Madronich S . Seasonal variability of secondary organic aerosol: a global modeling study. J. Geophys. Res. 2004; 109: 03203.
- Lamarque J.-F , Bond T. C , Eyring V , Granier C , Heil A , co-authors . Historical (1850–2000) gridded anthropogenic and biomass burning emissions of reactive gases and aerosols: methodology and application. Atmos. Chem. Phys. 2010; 10: 7017–7039.
- Leibensperger E. M , Mickley L. J , Jacob D. J , Chen W.-T , Seinfeld J. H , co-authors . Climatic effects of 1950–2050 changes in US anthropogenic aerosols – Part 1: aerosol trends and radiative forcing. Atmos. Chem. Phys. 2012; 12: 3333–3348.
- Li J. W , Han Z. W , Zhang R. J . Model study of atmospheric particulates during dust storm period in March 2010 over East Asia. Atmos. Environ. 2011; 45: 3954–3964.
- Li J. W , Han Z. W . A modeling study of seasonal variation of atmospheric aerosols over East Asia. Adv. Atmos. Sci. 2012; 29(1): 101–117.
- Liu H. N , Zhang L , Wu J . A modeling study of the climate effects of sulfate and carbonaceous aerosols over China. Adv. Atmos. Sci. 2010; 27(6): 1276–1288.
- Liu X , Cheng Y , Zhang Y , Jung J , Sugimoto N , co-authors . Influences of relative humidity and particle chemical composition on aerosol scattering properties during the 2006 PRD campaign. Atmos. Environ. 2008; 42: 1525–1536.
- Liu X , Zhang Y , Cheng Y , Hu M , Han T . Aerosol hygroscopicity and its impact on atmospheric visibility and radiative forcing in Guangzhou during the 2006 PRIDE-PRD campaign. Atmos. Environ. 2012; 60: 59–67.
- Liu X , Zhang Y , Jung J , Gu J , Li Y , co-authors . Research on the hygroscopic properties of aerosols by measurement and modeling during CAREBeijing-2006. J. Geophys. Res. 2009; 114: 00G16.
- Louie P. K. K , Watson J. G , Chow J. C , Chen A , Sin D. W. M , co-authors . Seasonal characteristics and regional transport of PM2.5 in Hong Kong. Atmos. Environ. 2005; 39: 1695–1710.
- Malm W. C , Day D. E . Estimates of aerosol species scattering characteristics as a function of relative humidity. Atmos. Environ. 2001; 35: 2845–2860.
- Marmer E , Langmann B , Fagerli H , Vestreng V . Direct shortwave radiative forcing of sulfate aerosol over Europe from 1900 to 2000. J. Geophys. Res. 2007; 112: 23S17.
- Nenes A , Pandis S. N , Pilinis C . ISORROPIA: a new thermodynamic equilibrium model for multiphase multicomponent inorganic aerosols. Aqua. Geochem. 1998; 4: 123–152.
- Ohara T , Akimoto H , Kurokawa J , Horii N , Yamaji K , co-authors . An Asian emission inventory of anthropogenic emission sources for the period 1980–2020. Atmos. Chem. Phys. 2007; 7: 4419–4444.
- Pan X. L , Yan P , Tang J , Ma J. Z , Wang Z. F , co-authors . Observational study of influence of aerosol hygroscopic growth on scattering coefficient over rural area near Beijing mega-city. 2009; 9: 7519–7530. Atmos. Chem. Phys.
- Pitchford M , Malm W , Schichtel B , Kumar N , Lowenthal D , Hand J . Revised algorithm for estimating light extinction from IMPROVE particle speciation data. J. Air Waste Manage. 2007; 57(11): 1326–1336.
- Qian Y , Leung L. R , Ghan S. J , Giorgi F . Regional climate effects of aerosols over China: modeling and observation. Tellus. 2003; 55B: 914–934.
- Randles C. A , Russell L. M , Ramaswamy V . Hygroscopic and optical properties of organic sea salt aerosol and consequences for climate forcing. Geophys. Res. Lett. 2004; 31: 16108.
- Shao Y , Dong C. H . A review on East Asian dust storm climate, modeling and monitoring. Glob. Planet. Change. 2006; 52: 1–22.
- Shao Y , Yang Y , Wang J , Song Z , Leslie L. M , co-authors . Northeast Asian dust storms: real-time numerical prediction and validation. J. Geophys. Res. 2003; 108(D22): 4691.
- Smith S. J , van Aardenne J , Klimont Z , Andres R. J , Volke A , co-authors . Atmos. Chem. Phys. 2011; 11: 1850. 1101–2005. 1116.
- Song C. H , Carmichael G. R . A three-dimensional modeling investigation of the evolution processes of dust and sea-salt particles in East Asia. J. Geophys. Res. 2001; 106(D16): 18131–18154.
- Streets D. G , Bond T. C , Carmichael G. R , Fernandes S. D , Fu Q , co-authors . An inventory of gaseous and primary aerosol emissions in Asia in the year 2000. J. Geophys. Res. 2003; 108(D21): 8809.
- Streets D. G , Waldhoff S. T . Present and future emissions of air pollutants in China: SO2, NOx, and CO. Atmos. Environ. 2000; 34: 363–374.
- Streets D. G , Yu C , Wu Y , Chin M , Zhao Z , co-authors . Aerosol trends over China, 1980–2000. Atmos. Res. 2008; 88: 174–182.
- Tang Y , Carmichael G. R , Seinfeld J. H , Dabdub D , Weber R. J , co-authors . Three-dimensional simulations of inorganic aerosol distributions in East Asia during spring 2001. J. Geophys. Res. 2004; 109: D19S23.
- Walmsley J. L , Wesely M. L . Modification of coded parameterizations of surface resistances to gaseous dry deposition. Atmos. Environ. 1996; 30: 1181–1188.
- Wang G , Wang H , Yu Y , Gao S , Feng J , co-authors . Chemical characterization of water-soluble components of PM10 and PM2.5 atmospheric aerosols in five locations of Nanjing, China. Atmos. Environ. 2003; 37: 2893–2902.
- Wang H , Shi G. Y , Teruo A , Wang B , Zhao T. L . Radiative forcing due to dust aerosol over east Asia-north Pacific region during spring 2001. Chinese Sci. Bull. 2004; 49(20): 2212–2219.
- Wang T , Li S , Shen Y , Deng J , Xie M . Investigations on direct and indirect effect of nitrate on temperature and precipitation in China using a regional climate chemistry modeling system. J. Geophys. Res. 2010; 115: D00K26.
- Wu J , Fu C , Xu Y , Tang J. P , Wang W , Wang Z . Simulation of direct effects of black carbon aerosol on temperature and hydrological cycle in Asia by a Regional Climate Model. Meteorol. Atmos. Phys. 2008; 100: 179–193.
- Xiong Z , Fu C. B , Zhang Q . On the ability of the regional climate model RIEMS to simulate the present climate over Asia. Adv. Atmos. Sci. 2006; 23(5): 784–791.
- Xu J , Bergin M. H , Xu X , Liu G , Zhao J , co-authors . Measurement of aerosol chemical, physical and radiative properties in the Yangtze delta region of China. Atmos. Environ. 2002; 36: 161–173.
- Yamaji K , Ohara T , Akimoto H . Regional-specific emission inventory for NH3, N2O, and CH4 via animal farming in South, Southeast, and East Asia. Atmos. Environ. 2004; 38: 7111–7121.
- Yang H , Yu J. Z , Ho S. S. H , Xu J , Wu W. S , co-authors . The chemical composition of inorganic and carbonaceous materials in PM2.5 in Nanjing, China. Atmos. Environ. 2005; 39: 3735–3749.
- Ye B , Ji X , Yang H , Yao X , Chan C. K , co-authors . Concentration and chemical composition of PM2.5 in Shanghai for a 1-year period. Atmos. Environ. 2003; 37: 499–510.
- Zeng Q. C , Zhang X. H , Liang X. Z , Yuan C. G , Chen S. F . Documentation of IAP (Institute of Atmospheric Physics) Two-Level Atmospheric General Circulation model. 1989
- Zhang H , Shen Z , Wei X , Zhang M , Li Z . Comparison of optical properties of nitrate and sulfate aerosol and the direct radiative forcing due to nitrate in China. Atmos. Res. 2012; 113: 113–125.
- Zhang H , Wang Z. L , Guo P. W , Wang Z. Z . A modeling study of the effects of direct radiative forcing due to carbonaceous aerosol on the climate in East Asia. Adv. Atmos. Sci. 2009; 26(1): 57–66.
- Zhang R , Jing J , Tao J , Hsu S.-C , Wang G , co-authors . Chemical characterization and source apportionment of PM2.5 in Beijing: seasonal perspective. Atmos. Chem. Phys. Discuss. 2013; 13: 9953–10007.
- Zhang X. Y , Gong S. L , Shen Z. X , Mei F. M , Xi X. X , co-authors . Characterization of soil dust aerosol in China and its transport and distribution during 2001 ACE-Asia: 1. network observations. J. Geophys. Res. 2003a; 108(D9): 4261.
- Zhang X. Y , Gong S. L , Zhao T. L , Arimoto R , Wang Y. Q , co-authors . Sources of Asian dust and role of climate change versus desertification in Asian dust emission. Geophys. Res. Lett. 2003b; 30(24): 2272.
- Zhao P , Zhang X , Meng W , Yang B , Fan W , Liu H . Characteristics of inorganic water-soluble ions from aerosols in Beijing-Tianjin-Hebei area. Environ. Sci. 2011; 32(6): 1546–1549. in Chinese.
- Zhuang B , Jiang F , Wang T , Li S , Zhu B . Investigation on the direct radiative effect of fossil fuel black-carbon aerosol over China. Theor. Appl. Climatol. 2011; 104: 301–312.