Abstract
ABSTRACT
The sensitivities of meteorological forecast errors associated with Asian dust transport events to changes in the initial state were evaluated for 46 occurrences that affected the Korean Peninsula from 2005 to 2010. Adjoint-based sensitivities were used to determine these sensitivities. Sensitive regions were located primarily over two regions upstream from the Korean Peninsula: the northern source region, including areas of Mongolia and northern China, and the Tibetan Plateau. Depending on transport trajectories, month, and year, the sensitive regions were located over either the northern source regions or the Tibetan Plateau. That is, the Asian dust forecast in Korea was found to be sensitive to the meteorological fields over the northern source regions, but also those over the Tibetan Plateau even though the latter is not a dust source region or an upstream area according to the transport trajectories. Employing additional observations at existing instrumentation sites or developing new observational sites in both sensitive regions could be beneficial in reducing the atmospheric circulation forecast errors in East Asia, thus improving the accuracy of transport forecasts of Asian dust events affecting the Korean Peninsula.
1. Introduction
Asian dust originates from the deserts of northern China and Mongolia and is transported to East Asia by prevailing winds. Asian dust affects local air quality in areas downstream from the source regions, causing extensive health, environmental, and property damage in East Asian countries, especially China, Korea, and Japan. Asian dust has also been reported to reach as far as the west coast of the United States (e.g. Hacker et al., Citation2001; Husar et al., Citation2001; Gong et al., Citation2006; Zhao et al., Citation2006).
Asian dust phenomena and their forecasts in areas downstream from dust source regions are influenced by the transport characteristics of dusts. By investigating atmospheric circulation patterns associated with the downstream transport of Asian dust, Jhun et al. (Citation1999) showed that the frequency of dust occurrence on the Korean Peninsula differs considerably from that in the dust source regions due to the different atmospheric circulation patterns in these regions. Although the dust emissions are driven by surface winds over the source regions and are transported locally in boundary layers, dust transport events to Korea mostly occur in the free atmosphere. The transport paths connecting the dust source regions to Korea are closely associated with the tropospheric circulations over East Asia. Chung and Park (Citation1997) and Uno et al. (Citation2001) demonstrated that the transport paths of Asian dusts are closely related to extratropical pressure systems (i.e. the locations of extratropical cyclones and anticyclones) over East Asia. Typically, a high-pressure system follows behind a surface frontal cyclone over the Korean Peninsula, accompanying the eastward movement of the 500 hPa westerly trough, during Asian dust events in Korea (e.g. Merrill and Kim, Citation2004; Kim et al., Citation2006; Kim et al., Citation2008b; Kim, Citation2008). Therefore, meteorological forecast errors affecting Asian dust transport forecasts in Korea are primarily associated with extratropical weather systems throughout the troposphere and their forecasts over the Korean peninsula.
Accurate predictions of meteorological fields are crucial for predicting Asian dust events because the air quality models for Asian dust prediction use predicted meteorological fields from numerical weather prediction models as input (Kim et al., Citation2008b). Such a requirement was demonstrated by Zhang et al. (Citation2007) when attempting to predict ozone concentrations in the vicinity of Houston, Texas, and by Liu et al. (Citation2011) when attempting to predict CO2 transport around the globe. Both Zhang et al. (Citation2007) and Liu et al. (Citation2011) found that ozone and CO2 transport uncertainties due to the uncertainties in meteorological fields are significant causes of the total transport error.
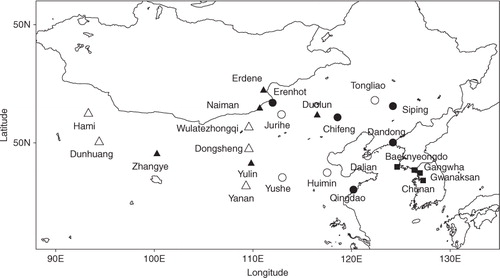
The Korea Meteorological Administration (KMA) collects meteorological and dust (e.g. PM10 concentration) data from surface observation sites owned by the KMA and the China Meteorological Administration (CMA) over the Asian dust source regions for a better representation of initial conditions for Asian dust forecasts, as shown in . However, the observational data over the source regions are insufficient to enable accurate Asian dust prediction. Moreover, the locations of the KMA observational sites over the dust source regions were determined rather subjectively (Kim et al., Citation2008b), specifically by installing stations following the known paths of Asian dust from the source regions to Korea. By investigating the sensitive regions of meteorological forecast errors to initial conditions for two Asian dust events in Korea, Kim et al. (Citation2008b) showed that not only dust source regions but also other upstream regions may be important to obtain correct atmospheric circulation patterns associated with Asian dust events and, thus, more accurate Asian dust forecasts.
Fig. 1 Asian dust monitoring stations over Asian dust source regions operated by the Korea Meteorological Administration (KMA) since 2005 (○) and 2007 () and by the CMA (▵), Asian dust monitoring tower (▴), and four domestic observational sites operated by the KMA (▪). Only four representative observational sites in Korea are shown.
Adaptive observation strategies that employ more objective criteria to decide observational sites may be used to decide where to conduct observations to improve transport forecasts associated with Asian dust events. Adaptive observations are additional observations in sensitive regions that may have the greatest impact on the forecast and are thus expected to decrease the forecast error (Kim et al., Citation2004). Until recently, many studies used adaptive observation strategies to identify sensitive regions for adaptively observing extratropical or tropical cyclones (e.g. Peng and Reynolds, Citation2005, Citation2006; Kim and Jung, Citation2006; Majumdar et al., Citation2006; Wu et al., Citation2007; Kim et al., Citation2008a, Citation2011; Kim and Jung, Citation2009a, Citationb; Jung et al., Citation2010; Park et al., Citation2013).
In contrast to weather events associated with extratropical and tropical cyclones, adaptive observation strategies have rarely been applied to Asian dust. Yumimoto et al. (Citation2008) applied an adjoint inversion of a four-dimensional variational data assimilation system of a regional dust model (RAMS/CFORS-4DVAR) to an Asian dust case by evaluating the impact of dust emission observations at specific sites. In contrast, by investigating adjoint sensitivities of atmospheric circulation forecast errors, Kim et al. (Citation2008b) demonstrated the feasibility of using adaptive observation strategies to design observation network for Asian dust events. Using adjoint-based forecast sensitivities to detect sensitive regions, Kim et al. (Citation2008b) showed that adaptive observations in sensitive upstream regions may be beneficial for short-range forecasts of two Asian dust events observed in Korea. However, to determine permanent or semi-permanent observational sites to improve the forecasts and predictability of Asian dust transport events in Korea, adaptive observation strategies should be applied to numerous Asian dust cases to obtain statistically significant results.
Therefore, in this study, 46 Asian dust events that occurred in East Asia and affected the Korean Peninsula from 2005 to 2010 were chosen to investigate the sensitivity of meteorological forecast errors associated with Asian dust transport events to their initial conditions and to identify statistically sensitive regions for atmospheric circulation forecast errors of the Asian dust transport events affecting Korea. As the Asian dust events affecting the Korean Peninsula and their transport are the main interests of this study, the dust emission mechanisms or processes in the source regions are not considered. However, taking note of the sensitive regions for many Asian dust events might help identify locations for permanent observational sites for future Asian dust events. The sensitive regions are investigated according to the transport trajectories, year, month, and season. To analyse the sensitivity results, the statistical occurrence and trajectory characteristics of the dust cases are also briefly discussed. To investigate the sensitivity to initial conditions, adjoint sensitivities (e.g. Errico, Citation1997) that calculate the gradient of the forecast aspect (i.e. response function) with respect to an initial condition are used, as in Kim et al. (Citation2008b). Section 2 presents the model, cases, and methodologies employed to calculate adjoint sensitivity and for cluster analysis. The results are presented in Section 3, and Section 4 contains a summary and discussion.
2. Methodology
2.1. Model
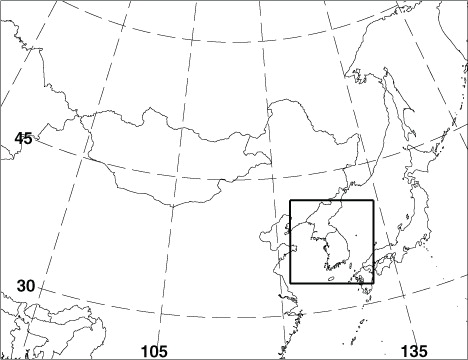
This study uses the fifth-generation Pennsylvania State University/National Center for Atmospheric Research (PSU/NCAR) Mesoscale Model (MM5) together with the MM5 adjoint modelling system (Zou et al., Citation1997) to calculate adjoint sensitivities. The model is a non-hydrostatic model. The model domain for this study is 55×71 horizontal grids (centred at 39°N latitude and 115°E longitude) () with an 80-km horizontal resolution and 14 evenly spaced sigma levels in the vertical from the surface to 50 hPa. The model's initial and lateral boundary conditions are the National Centers for Environmental Prediction (NCEP) final analysis (FNL; 1°×1° global grid) and the Optimum Interpolation Sea Surface Temperature (OISST) version 2 (Reynolds et al., Citation2002). The physical parameterisations used for the non-linear basic state integrations include the Grell convective scheme, the MRF planetary boundary layer scheme, a simple radiation cooling scheme, horizontal and vertical diffusion, and dry convective adjustment. The same physical parameterisations are used in the tangent linear model (TLM) and adjoint model integrations. Large-scale precipitation is the only moist physics scheme used in the TLM and adjoint model integrations, although the Grell convective scheme and the explicit treatment of cloud water, rain, snow, and ice are used in the basic state integrations.
Fig. 2 The model domain for this study. The box over the Korean Peninsula denotes the area where a response function was defined.
2.2. Cases
The Asian dust events affecting the Korean Peninsula were classified from among all Asian dust events in East Asia from 2005 to 2010 by evaluating the maximum PM10 concentrations observed on the southern Korean Peninsula (KMA, Citation2005, Citation2006 Citation2008; National Institute of Meteorological Research, Citation2009, Citation2010, Citation2011). The cases determined to have affected the Korean Peninsula are shown in . Dust origin was determined by investigating satellite remote sensing images (RGB images from the NASA high-resolution meteorological sensor (MODIS) and Infrared Optical Depth Index (IODI) images from MTSAT-1R), surface weather maps, upper atmospheric weather maps (850 and 300 hPa), Hwangsa (Korean for Asian dust) observations, and PM10 concentrations.
Table 1. Asian dust events that affected the Korean Peninsula from 2005 to 2010
For each case, the initial and final time for the forward non-linear model integration and backward adjoint sensitivity calculations were determined by the time interval of maximum PM10 concentrations in the source regions and the Korean Peninsula. The occurrence times of maximum PM10 concentrations were set to match the analysis times (00, 06, 12, and 18 UTC) as follows. If the occurrence times in both regions did not coincide with the analysis times, then the occurrence times were determined to be those closest to the regular analysis times. If the occurrence times were in the middle of the analysis intervals, then the occurrence times were determined to be those analysis times with the greater PM10 concentrations. The occurrence time was determined as outlined because the analysed meteorological field at the final time is necessary to approximate the forecast error (i.e. the difference between the model forecast and the truth) used to calculate the adjoint sensitivity. The analysed meteorological field was taken as a true value in the adjoint sensitivity calculation, as described in Section 2.3.
2.3. Sensitivity and sensitivity frequency
As noted in Section 1, meteorological forecast errors affecting the Asian dust transport forecasts in Korea are primarily associated with extratropical weather systems (i.e. cyclone and accompanying anticyclone systems) and their forecasts over the Korean Peninsula. As the atmospheric circulation forecasts during Asian dust events in Korea are mainly associated with extratropical cyclone forecasts throughout troposphere, the energy norm could be used as a measure of the forecast error, as in previous studies. Kim and Kay (Citation2010) demonstrated that both the energy and low-level pressure forecast error over the Korean Peninsula as forecast aspects of interest (i.e. response function) of the adjoint sensitivity calculation provided similar sensitive regions for an Asian dust event that occurred during 6–8 May 2007 in Korea. As the low-level pressure forecast error is associated with the extratropical pressure patterns, that is also closely associated with Asian dust transport near Korea. However, as noted in Section 1, a high-pressure system behind a surface frontal cyclone over the Korean Peninsula and the accompanying eastward movement of the 500 hPa trough are the main atmospheric circulation patterns during Asian dust events in Korea and need to be predicted accurately. Therefore, as a response function (), we selected an energy-based forecast error measure inside a cube encompassing the tropospheric depth surrounding most of the Korean Peninsula at the verification time, instead of using the low-level pressure forecast error.
The energy norm has been used in many predictability studies of extratropical and tropical cyclones (Rabier et al., Citation1996; Gelaro et al., Citation1998; Klinker et al., Citation1998; Kleist and Morgan, Citation2005; Kim and Jung, Citation2006; Jung and Kim, Citation2009) because it provides a convenient and physical way of combining forecast errors with separate model variables. Vertically, the response function of the energy forecast error is defined from the surface to 300 hPa of the model domain because the forecast errors associated with both the surface weather system and the 500 hPa trough are important for accurate atmospheric transport prediction for Asian dusts. The response function is1
where e
f is the MM5 forecast error at the verification time for each case [i.e. the deviation of the MM5 forecast state (x
f) from the NCEP FNL (x
a)], P is a local projection operator that constrains the response function to a box surrounding the region over the Korean Peninsula, and C is a matrix that converts the response function to dry energy (Zou et al., Citation1997). The detailed formulation of the response function in (1) is2
where U′, V′, W′, θ′, and PP′ are forecast errors of zonal, meridional, vertical winds, potential temperature, and pressure perturbation, respectively; ,
,
, and c
s
are reference values of Brunt–Väisälä frequency, potential temperature, density, and speed of sound, respectively; and Σ and σ are the horizontal domain and vertical coordinate, respectively. As the true state is not known, the NCEP FNL is assumed to be the true state. The dry energy norm is used because it can evaluate the forecast errors associated with the typical atmospheric circulation patterns (i.e. a high-pressure system behind a surface frontal cyclone over the Korean Peninsula and accompanying eastward movement of the 500 hPa trough) during Asian dust events in Korea. The tests using a moist energy norm (not shown) yielded very similar results to those using the dry norm. The sensitivities based on a direct measure of the transport errors may differ from those based on the dry energy norm used in this study, which may add different aspects to Asian dust transport forecasts.
An approximation to the change in R can be obtained as3
where M
T
is an adjoint operator of the TLM M and x
0 is the initial state. From the right side of (3), the adjoint sensitivity of the forecast error to the initial conditions can be obtained by backward integration of the weighted forecast error using the following adjoint model:4
After the term on the left in (4) is calculated for each case, the statistical sensitivity is determined as follows:
The vertically integrated total energy of the adjoint sensitivity is calculated to combine each of its components with a different unit into a single two-dimensional adjoint sensitivity field with a unit of energy (J kg−1) (Langland et al., Citation2002; Kim and Jung, Citation2006; Kim et al., Citation2011).
The sensitive regions are determined for each case by the upper 5% of the above mentioned vertically integrated total energy of the adjoint sensitivities in all grid points.
The sensitivities are normalised by the maximum values of the vertically integrated total energy of the adjoint sensitivities within the sensitive regions for each case.
The sensitivities are composited by accumulating the normalised sensitivities at each grid point for all cases.
The sensitivity frequency is calculated as follows:
After (1) and (2) in the above sensitivity calculation process are completed, the number 1 is assigned to each grid point identified as being within a sensitive region.
The composite sensitivity frequency of each grid point is determined by summing the assigned numbers (or frequency) at each grid point for all cases.
The ratios of linearly and non-linearly evolved temperature and zonal wind perturbation magnitudes in the verification area are calculated for each case to verify the linearity assumption on which the adjoint sensitivity analysis is based. The average ratio for all cases is shown in . As the linearity depends on the perturbation magnitude, initial temperature perturbations of 2K (i.e. the typical analysis error magnitude), 1K, and 0.5K and initial zonal wind component perturbations of 4 m s−1 (i.e. the typical analysis error magnitude), 2 m s−1, and 1 m s−1 were chosen to calculate the ratio. The temperature and zonal wind perturbations were put to the sensitive regions where the magnitude of the adjoint sensitivity is the upper 5% of the total sensitivities around the model vertical level 4 (i.e., approximately 420 hPa in (a) and 715 hPa in (b)) where the maximum sensitivity is located. In terms of ratio, the linearity holds generally well for temperature and zonal wind perturbations (). The perturbations show a generally better agreement as the magnitude of the temperature and zonal wind perturbations becomes smaller. The meridional wind perturbations show very similar results with the zonal wind perturbations (not shown).
Table 2. Ratio of linearly evolved perturbation to nonlinearly evolved perturbation in the projection area, averaged over all cases
2.4. Cluster analysis
To classify Asian dust events according to their transport paths and to investigate the characteristics of sensitivities depending on the transport trajectories, a cluster analysis was applied to all the Asian dust cases classified as having affected the Korean Peninsula from 2005 to 2010. The cluster analysis was performed using the probabilistic cluster technique (Gaffney, Citation2004; Camargo et al., Citation2007) based on the regression mixture model. This clustering method can be applied to trajectories that have different lengths, and the toolbox for the method can be found at http://www.datalab.uci.edu/resources/CCT.
The HYSPLIT_4 (Hybrid Single-Particle Lagrangian Integrated Trajectory_4; Draxler and Hess, Citation1998; Draxler and Rolph, Citation2003; Rolph, Citation2003) model was used to determine the backward trajectories of the meteorological fields forecasted by the MM5 for the Asian dust cases in . Then, the backward trajectories of the forecasted meteorological fields were analysed by cluster analysis. In the HYSPLIT_4 model, the backward trajectory data originate from Seoul (37.6°N latitude and 127°E longitude) when the maximum PM10 concentration is observed in Korea. The trajectory endpoints from the HYSPLIT model were then used as cluster variables.
3. Results
3.1. Statistical characteristics
Most cases occurred in spring from March to May (). Since 2008, the frequency of Asian dust events in December has been comparable to that in the spring months (i.e. March, April, and May) or greater than that in other months. The source regions have been mostly located relatively close to the Korean Peninsula in Inner Mongolia (), which is consistent with the results of Lim and Chun (Citation2006). Manchuria has been the next most common source region and is closer to the Korean Peninsula than the Gobi Desert (). The annual frequency of Asian dust events is similar for each year, although it was slightly higher in 2010 (). The model integration times for 31 cases (i.e. 67% of the total cases) were from 18 to 36 hours (), which is consistent with the majority of source regions being relatively close to the Korean Peninsula, as shown in .
Fig. 3 Monthly occurrence of Asian dust events affecting the Korean Peninsula from 2005 to 2010.
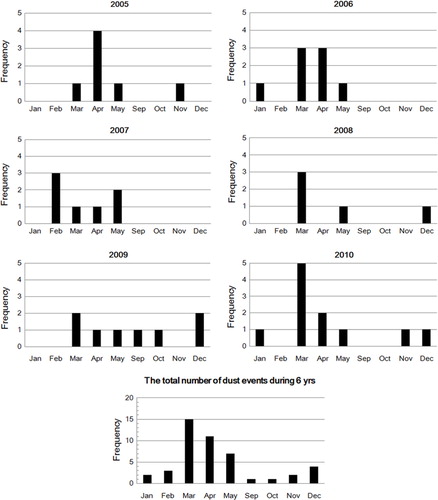
Table 3. Annual frequency distributions of the source regions of Asian dust events that affected the Korean Peninsula from 2005 to 2010
Table 4. Annual frequency distributions of Asian dust events that affected the Korean Peninsula from 2005 to 2010, categorized by the model integration time
3.2. Trajectory analysis
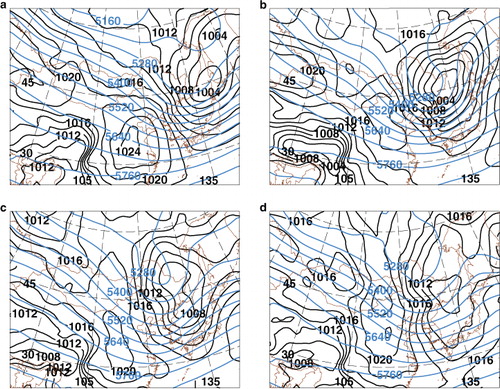
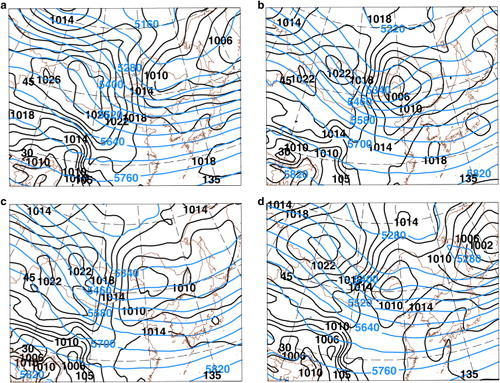
The transport paths of Asian dusts from their source regions to the Korean Peninsula were classified by cluster analysis into four groups, consistent with previous studies (Kim et al., Citation2005; Kim, Citation2008). (a) shows the dust trajectories for all cases in this study, and (b) shows the representative trajectories of clustered groups obtained by regression analysis. In group 1, the dusts originate mostly from Manchuria or Inner Mongolia, cross the northern part of the Yellow Sea between China and Korea, and arrive at the Korean Peninsula (c). The average surface-pressure pattern of group 1 at the dust occurrence time in Korea is characterised by a well-developed anticyclone over the Asian continent and a low-pressure system over northern Japan, including the north-western Pacific (a). The pathway of group 1 is closely associated with the migratory anticyclone in the springtime of East Asia. In group 2, the dusts originate from the Gobi desert or Inner Mongolia, cross the mid-northern part of the Yellow Sea, and then reach the Korean Peninsula (d). In group 3, the dusts originate from the Gobi desert, further north, or the eastern part of China, travel to Shan-tung and the mid-southern part of the Yellow Sea, and then reach the Korean Peninsula (e). In groups 2 and 3, the average surface-pressure patterns near and over the Korean Peninsula are similar and are characterised by an anticyclone in the Asian continent and a low-pressure system over eastern Manchuria (b and c). As the anticyclone in the Asian continent is elongated in the latitudinal direction for group 3, the trajectory of group 3 is southerly declined compared with that of group 2. Group 4 includes dust events with complex trajectories that do not belong to the three distinct groups described above (f and 5d). The trajectories of group 1 are different from those of groups 2 and 3 at the 90% confidence level according to the T 2 test (Wilks, Citation2006; Davis et al., Citation2010). Groups 2 and 3 do not differ greatly for the first 18 hours of the backward trajectories at the 90% confidence level, but they become different in the later trajectories.
Fig. 4 (a) The trajectories of all cases, (b) the representative trajectories of clustered groups using a regression analysis, and the trajectories of: (c) group 1, (d) group 2, (e) group 3, and (f) group 4.
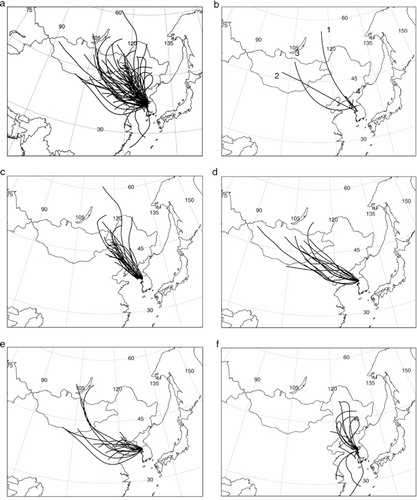
Fig. 5 The average surface-pressure patterns (black line) and 500 hPa geopotential height (blue line) at the occurrence times of maximum PM10 concentrations on the Korean Peninsula for: (a) group 1, (b) group 2, (c) group 3, and (d) group 4.
shows the monthly frequency distributions of the clustered groups. The monthly occurrence of group 1 is much larger than that of the other groups, especially in March, which implies that the Asian dusts that originate from Inner Mongolia and Manchuria and reach the Korean Peninsula within a relatively short time appear most frequently in early spring. shows the frequency distributions of the clustered groups categorised by model integration time. Group 1, which contains 35% of the Asian dust cases, shows relatively short model integration times, including 81% from 18 to 36 hours. The short model integration times of group 1 are consistent with the high frequency of closer source regions in that group, as shown in .
Table 5. Monthly frequency distributions of clustered groups of Asian dust events that affected the Korean Peninsula from 2005 to 2010
Table 6. Frequency distributions of clustered groups of Asian dust events that affected the Korean Peninsula from 2005 to 2010, categorized by the model integration time
3.3. Statistical distribution of sensitivity and sensitivity frequency
This section presents the statistical distributions and frequencies of the adjoint sensitivities for all 46 Asian dust cases. For the forecast error defined in the box in , the adjoint sensitivity for each case is calculated by integrating the adjoint model backward for the period shown in . As noted in Section 3.3, the sensitive region (or grid) for each case is determined by the grid that has the upper 5% of the adjoint sensitivity values among all grid points. For each region determined to be sensitive, the sensitivity distribution and sensitivity frequency distribution are determined as described in Section 3.3.
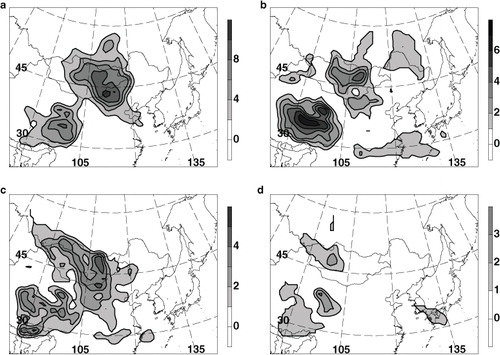
The composite sensitivity and sensitivity frequency are determined by accumulating the normalised sensitivities and sensitivity frequencies for all cases and are shown in . The primary features of the sensitivities (a) and sensitivity frequencies (b) are basically similar and are mainly located over two regions: from northern China to Mongolia including the dust source regions (hereafter, northern source regions) and the Tibetan plateau regions. Both regions are located upstream of the Korean Peninsula. However, the sensitive regions over the Tibetan Plateau do not coincide well with either the dust source regions or the wind origination regions identified by the backward trajectories shown in . This finding implies that the Asian dust forecast is sensitive not only to the meteorological fields over the dust source regions but also to those over the Tibetan Plateau. To assess the forecast error correction by the sensitivities in the Tibetan Plateau, the iterative procedure described in Kim et al. (Citation2008b) was performed. The results show that the perturbations added to the high-sensitivity regions over the Tibetan Plateau reduce the forecast error in the verification region over the Korean Peninsula (not shown). As the accurate prediction of atmospheric circulations in both the mid- to upper levels and the surface is crucial for the prediction of Asian dust transport and because the large sensitivities at the mid-level in the Tibetan Plateau are located upstream of the response function box, the large sensitivities in the Tibetan Plateau contribute to the forecast error of the atmospheric circulation over the Korean Peninsula.
Fig. 6 (a) Composite of the sensitivity field and (b) the sensitivity frequency field for all 46 cases, calculated using the energy forecast error as a response function for adjoint sensitivity calculation. (c) Composite of the sensitivity field and (d) the sensitivity frequency field for all 46 cases, calculated using the low-level pressure forecast error as a response function for adjoint sensitivity calculation.
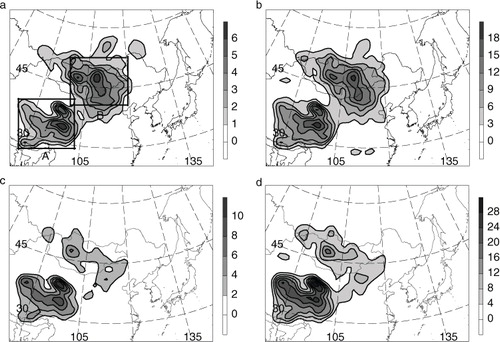
(c) and (d) shows the composite sensitivity and sensitivity frequency for all cases with low-level pressure forecast error as a response function for calculating adjoint sensitivity. As described in Section 2.3, both the energy and low-level pressure forecast error over the Korean Peninsula as response functions of the adjoint sensitivity calculation provide roughly similar sensitive regions, on average, for all cases, with relatively prominent sensitive regions over the Tibetan Plateau for the low-level pressure forecast error response function.
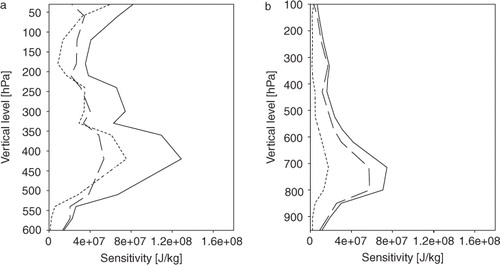
Vertical profiles of the composite sensitivities for both the Tibetan Plateau and northern source regions are shown in . In the Tibetan Plateau regions, the maximum of the composite sensitivities is located at approximately 420 hPa due to the terrain elevation (a). The kinetic energy and potential energy are roughly similar throughout the troposphere in the Tibetan Plateau. In contrast, large sensitivities reside at approximately 700–800 hPa in the northern source regions (b), similar to typical vertical sensitivity patterns for extratropical cyclone development, which implies that the meteorological forecast errors associated with the Asian dust transport to the Korean Peninsula are closely associated with that of extratropical cyclone development around the Korean Peninsula. In other words, the evolution of the anticyclone and cyclone systems upstream and over the Korean Peninsula is a major factor in meteorological forecast errors regarding when Asian dusts are transported to the Korean Peninsula. However, the dominant kinetic energy of the sensitivity in the northern source regions is different from typical vertical sensitivity profiles for extratropical cyclogenesis, which usually exhibit the dominant potential energy. In contrast to extratropical cyclogenesis, which requires the potential energy build-up at the initial stage, the Asian dust transports over the Korean Peninsula are closely associated with the cyclone movement and the accompanying strong pressure gradient regions behind the surface cyclone. Therefore, strong boundary winds associated with the kinetic energy in these regions will have a large impact on the meteorological forecast error over the Korean Peninsula. The statistical vertical energy profiles for many cases in this study are very similar to that in an Asian dust case discussed by Kim and Kay (Citation2010).
Fig. 7 Vertical profiles of the composite sensitivities (solid: total energy; dashed: kinetic energy; and dotted: potential energy) for boxes (a) A and (b) B in (a).
The major features of sensitivities and sensitivity frequencies may change depending on the dust trajectory, month, and year. As the horizontal sensitivity and sensitivity frequency distributions are very similar for the same trajectory group, month, and year for the composite of the 46 cases, as shown in , and as the sensitivity frequency distributions consider the contributions of all cases evenly, only the sensitivity frequency distributions are discussed hereafter.
3.3.1. Sensitivity frequency distributions according to the trajectories
shows the composite sensitivity frequency distributions for each clustered trajectory group. For group 1, the sensitivity frequencies are generally similar to the total sensitivity frequencies shown in (b) (a). Among the two major sensitive regions in (a), the northern source regions coincide well with the trajectories in (c). The average pressure patterns of group 1 at the initial sensitivity time in (a) suggest that the large sensitivity frequency over the northern source region is associated with strong surface-pressure gradients under the upper trough. For group 2, the sensitivity frequencies in the northern source regions are much stronger than those in the Tibetan Plateau (b). The locations of the large sensitivity frequencies in the northern source regions coincide with the trajectory distributions shown in (d). The average pressure pattern of group 2 is characterised by the upper trough extending south-westward and the strong surface-pressure gradient regions over the northern source regions (b). The large sensitivity frequencies over the northern source regions are mainly associated with the strong pressure gradient regions over the northern source regions. For group 3, the sensitivity frequencies are greater in the Tibetan Plateau regions than in the northern source regions, which is consistent with more southerly arc of the trajectories shown in (e) (c). The average pressure pattern of group 3 is characterised by the upper trough extending towards the Tibetan Plateau and strong surface-pressure gradient regions over the northern source regions and the Tibetan Plateau under the trough (c). The smaller sensitivity frequency over the northern source regions for group 3 is consistent with the weaker surface-pressure gradient in that region compared with groups 1 and 2. Therefore, the sensitivity frequencies over the Tibetan Plateau are greater than those over the northern source regions for group 3. Group 4 shows very weak sensitivity frequencies overall, unlike the other groups (d). The influence of the Tibetan Plateau on Asian dust transport forecasting is much greater for groups 1 and 3 than for group 2 because the strong surface-pressure gradient regions reside under the upper trough over the Tibetan Plateau at the initial time for groups 1 and 3, as shown in (a) and (c). This feature was not reported by Kim et al. (Citation2008b) in their investigation of sensitivity distributions for the two Asian dust cases categorised in group 2.
Fig. 8 The composite sensitivity frequency fields for the cases in (a) group 1, (b) group 2, (c) group 3, and (d) group 4.
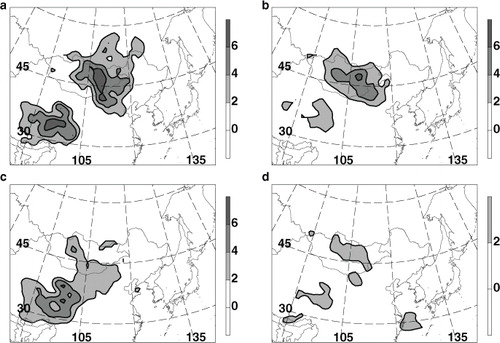
Fig. 9 The average surface-pressure patterns (black line) and 500 hPa geopotential height (blue line) at the initial time of the model integrations for: (a) group 1, (b) group 2, (c) group 3, and (d) group 4.
3.3.2. Sensitivity frequency distributions according to model integration time
shows the sensitivity frequency distributions according to the model integration times. In contrast to the maximum sensitivity frequencies in the northern source regions for the 18–24 hours integration times (a), those for the 30–36 hours integration times are located in the Tibetan Plateau regions (b). The sensitivity frequency distributions associated with the 18–24 hours integration times are mostly related to group 1, whereas a comparatively lesser contribution is made by groups 2 and 3 (not shown). This result implies that some Asian dust cases in the groups with large northern sensitivity frequency distributions reach the Korean Peninsula relatively quickly due to the short distance between the source region and the Korean Peninsula, as shown in . The sensitivity frequency distributions associated with the 30–36 hours integration times are attributed to all groups (). In contrast to groups 1 and 2, which show sensitivities in both the northern source regions and the Tibetan Plateau for the 30–36 hours integration times, group 3 shows sensitivities only in the Tibetan Plateau (not shown), which implies that the southerly declining trajectory group has sensitive regions far from the Korean Peninsula. For model integration times greater than 36 hours, the sensitivity frequencies are rather evenly distributed among the northern and southern regions (c and d).
Fig. 10 The composite sensitivity frequency fields for the cases categorised by model integration times of: (a) 18–24 hours, (b) 30–36 hours, (c) 42–48 hours, and (d) 54–72 hours.
3.3.3. Monthly sensitivity distributions
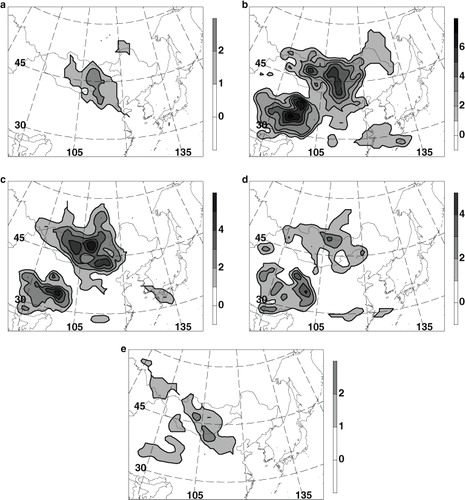
shows the monthly sensitivity frequency distributions. The sensitivity frequencies during winter (i.e. February and December) are located in the northern source regions (a and e), whereas those in the two spring months (i.e. March and April) are located in both regions but with a greater frequency of occurrence in the Tibetan Plateau regions (b and c). This result implies that the sensitivity frequency distributions in spring are influenced by groups 1, 2, and 3, but the major contributor to the sensitivity frequency in spring is group 1, as can be inferred from (a) and . The sensitivity frequency in May is very similar to that of group 3 because of a relatively high occurrence frequency in the Tibetan Plateau regions (d), implying that the sensitivity frequency of the Asian dust events that occurred in May is most closely associated with the southerly declining trajectory groups.
Fig. 11 The composite sensitivity frequency fields for the events that occurred in: (a) February, (b) March, (c) April, (d) May, and (e) December.
Overall, the interannual variability of the sensitivity patterns is low, with the exception of the increased sensitivity for 2010 (not shown).
4. Summary and discussion
The statistical sensitivity distributions (or sensitive regions) for transport forecast errors of Asian dust events that affected the Korean Peninsula were investigated. Sensitivities of the atmospheric circulation forecast errors to changes in the initial state were evaluated for 46 Asian dust cases that affected the Korean Peninsula from 2005 to 2010. Investigating the statistically sensitive regions determined using adjoint-based sensitivities could inform guidelines for selecting locations for permanent or semi-permanent meteorological observational sites for monitoring and forecasting future Asian dust transport events that may affect the Korean Peninsula. The linearity assumption for the adjoint-based sensitivity calculation holds well for these cases.
To understand the statistical sensitivity distributions, the statistical characteristics of the Asian dust events affecting the Korean Peninsula from 2005 to 2010 were also investigated. These events occurred mostly during spring, from March to May, although comparable occurrences have been observed in December since 2008. During this period, the source regions were mostly located in Inner Mongolia and Manchuria, and this trend has become more obvious recently. The annual frequency of Asian dust occurrence was similar for each year except 2010, which had a somewhat higher frequency of occurrence. The model integration times, determined by the occurrence interval between the source region and the Korean Peninsula, ranged mostly from 18 to 36 hours, which is consistent with the high frequency of source regions close to the Korean Peninsula.
To understand the sensitivity frequency distributions in terms of transport trajectories, the transport paths of Asian dust from their source regions to the Korean Peninsula were classified into four groups using cluster analysis. The most frequent trajectory group originated from Inner Mongolia and Manchuria and reached the Korean Peninsula relatively quickly. The next most frequent trajectory group originated from the Gobi Desert, farther north, or the eastern part of China and was transported to Shan-Tung and the mid-southern part of the Yellow Sea before reaching the Korean Peninsula. The third most frequent group originated from the Gobi desert or Inner Mongolia and crossed the mid-northern part of the Yellow Sea before reaching the Korean Peninsula.
The areas most frequently identified as sensitive regions were located over two regions upstream of the Korean Peninsula: the northern source regions (i.e. Mongolia to northern China, including dust source regions) and the Tibetan Plateau. The large sensitivity frequencies in both the northern source regions and the Tibetan Plateau were associated with the strong surface-pressure gradient (i.e. strong surface winds), even though the strong surface gradient regions in the northern source regions were behind the extratropical cyclone system. Within these two areas, the specific locations of the sensitive regions for each Asian dust case depended on transport trajectories, month, and year. Kim et al. (Citation2008b) reported sensitive regions within the northern source regions, but previous research has not identified the sensitive regions over the Tibetan Plateau. As the frequent sensitive regions over the Tibetan Plateau are not coincident with either the northern dust source regions or upstream areas indicated by the transport trajectories, it is important to consider the large sensitivities in the Tibetan Plateau for Asian dust transport forecasts in the Korean Peninsula. Until now, most of the observational sites have been deployed in the dust source regions or following dust trajectories. Thus, the finding that sensitive regions exist in the Tibetan Plateau and other locations not presently instrumented has important and practical implications. Using additional observations or developing new observational sites in the Tibetan Plateau regions and northern source regions may improve the accuracy of meteorological forecasts of Asian dust transport events affecting Korea. Furthermore, evaluating the statistical adjoint sensitivity distributions for Asian dust forecasts throughout East Asia, including China and Japan, would aid in the design of a common observational network for evaluating and forecasting Asian dust events throughout the broader region. The ongoing research assimilating simulated observations for the sensitive regions indicated in this study for many past Asian dust cases would confirm the effectiveness of these regions to atmospheric circulation forecasts during Asian dust transport events in Korea. In addition, the adjoint sensitivity distributions for the dust emission processes of Asian dust events would provide more comprehensive conclusions regarding the sensitive regions of Asian dust forecasts.
Acknowledgements
The authors thank the two anonymous reviewers for their valuable comments. This research was supported by the Korea Meteorological Administration Research and Development Program under grant CATER 2012-2030 and the Basic Science Research Program through the National Research Foundation of Korea (NRF) funded by the Ministry of Education, Science and Technology (2010-0028062).
References
- Camargo S. J. , Robertson A. W. , Gaffney S. J. , Smyth P. , Ghil M . Cluster analysis of typhoon tracks. Part I: general properties. J. Clim. 2007; 20: 3635–3653.
- Chung K.-Y. , Park S.-U . Numerical simulations of yellow sand events observed in Korea: II. Characteristic features of uplift and transport of yellow sand. J. Kor. Meteorol. Soc. 1997; 33: 201–217.
- Davis R. E. , Normile C. P. , Sitka L. , Hondula D. M. , Knight D. B. , co-authors . A comparison of trajectory and air mass approaches to examine ozone variability. Atmos. Environ. 2010; 44: 64–74.
- Draxler R. R. , Hess G. D . An overview of the HYSPLIT_4 modelling system for trajectories, dispersion, and deposition. Aust. Meteorol. Mag. 1998; 47: 295–308.
- Draxler R. R. , Rolph G. D . HYSPLIT (Hybrid Single-Particle Lagrangian Integrated Trajectory) Model Access Via NOAA ARL READY Website. 2003; Silver Spring, MD: NOAA Air Resources Laboratory. ( http://www.arl.noaa.gov/ready/hysplit4.html ) .
- Errico R. M . What is an adjoint model?. Bull. Am. Meteorol. Soc. 1997; 78: 2577–2591.
- Gaffney S. J . Probabilistic Curve-Aligned Clustering and Prediction with Regression Mixture Models. 2004; PhD Thesis. University of California, Irvine, CA. 281.
- Gelaro R. , Buizza R. , Palmer T. N. , Klinker E . Sensitivity analysis of forecast errors and the construction of optimal perturbations using singular vectors. J. Atmos. Sci. 1998; 55: 1012–1037.
- Gong S. L. , Zhang X. Y. , Zhao T. L. , Zhang X. B. , Barrie L. A. , co-authors . A simulated climatology of Asian dust aerosol and its trans-Pacific transport. Part II: interannual variability and climate connections. J. Clim. 2006; 19: 104–122.
- Hacker J. P. , McKendry I. G. , Stull R. B . Modeled downward transport of a passive tracer over Western North America during an Asian dust event in April 1998. J. Appl. Meteorol. 2001; 40: 1617–1628.
- Husar R. B. , Tratt D. M. , Schichtel B. A. , Falke S. R. , Li F. , co-authors . Asian dust events of April 1998. J. Geophys. Res. 2001; 106: 18317–18330.
- Jhun J.-G. , Yeh S.-W. , Kwon M.-H. , Chung Y.-S . Classification of atmospheric circulation patterns associated with long-range transport of yellow sands. J. Kor. Meteorol. Soc. 1999; 35: 575–586.
- Jung B.-J. , Kim H. M . Moist-adjoint based forecast sensitivities for a heavy snowfall event over the Korean peninsula on 4–5 March 2004. J. Geophys. Res. 2009; 114: 15104.
- Jung B.-J. , Kim H. M. , Kim Y.-H. , Jeon E.-H. , Kim K.-H . Observation system experiments for Typhoon Jangmi (200815) observed during T-PARC. Asia. Pac. J. Atmos. Sci. 2010; 46: 305–316.
- Kim H. M. , Jung B.-J . Adjoint-based forecast sensitivities of Typhoon Rusa. Geophys. Res. Lett. 2006; 33: 21813.
- Kim H. M. , Jung B.-J . Singular vector structure and evolution of a recurving tropical cyclone. Mon. Weather Rev. 2009a; 137: 505–524.
- Kim H. M. , Jung B.-J . Influence of moist physics and norms on singular vectors for a tropical cyclone. Mon. Weather Rev. 2009b; 137: 525–543.
- Kim H. M. , Jung B.-J. , Kim Y.-H. , Lee H.-S . Adaptive observation guidance applied to Typhoon Rusa: implications for THORPEX-PARC 2008. Asia. Pac. J. Atmos. Sci. 2008a; 44: 297–312.
- Kim H. M. , Kay J. K . Forecast sensitivity analysis of an Asian dust event occurred on 6–8 May 2007 in Korea. Atmosphere. 2010; 20: 399–414. (in Korean with English abstract).
- Kim H. M. , Kay J. K. , Jung B.-J . Application of adjoint-based forecast sensitivities to Asian dust transport events in Korea. Water. Air. Soil. Pollut. 2008b; 195: 335–343.
- Kim H. M. , Kim S.-M. , Jung B.-J . Real-time adaptive observation guidance using singular vectors for typhoon Jangmi (200815) in T-PARC 2008. Weather. Forecast. 2011; 26: 634–649.
- Kim H. M. , Morgan M. C. , Morss R. E . Evolution of analysis error and adjoint-based sensitivities: implications for adaptive observations. J. Atmos. Sci. 2004; 61: 795–812.
- Kim J . Transport routes and source regions of Asian dust observed in Korea during the past 40 years (1965–2004). Atmos. Environ. 2008; 42: 4778–4789.
- Kim J. , Yoon S.-C. , Jefferson A. , Zahorowski W. , Kang C.-H . Air mass characterization and source region analysis for the Gosan super-site, Korea, during the ACE-Asia 2001 field campaign. Atmos. Environ. 2005; 39: 6513–6523.
- Kim Y.-K. , Song S.-K. , Lee H. W. , Kim C.-H. , Oh I.-B. , co-authors . Characteristics of Asian dust transport based on synoptic meteorological analysis over Korea. J. Air. Waste. Manag. Assoc. 2006; 56: 306–316.
- Kleist D. T. , Morgan M. C . Application of adjoint-derived forecast sensitivities to the 24–25 January 2000 U.S. East coast snowstorm. Mon. Weather Rev. 2005; 133: 3148–3175.
- Klinker E. , Rabier F. , Gelaro R . Estimation of key analysis errors using the adjoint technique. Q. J. Roy. Meteorol. Soc. 1998; 124: 1909–1933.
- Korea Meteorological Administration. Asian Dust Reports in 2005, technical note of observation bureau 2005–6.
- Korea Meteorological Administration. 2006. Asian Dust Reports in 2006, technical note of observation Bureau 2006–6. Korea meteorological administration, Seoul, Republic of Korea, 116 pp.
- Korea Meteorological Administration. 2008. 2Asian dust reports in 2007, technical note of division of typhoon and asian dust. Korea meteorological administration, Seoul, Republic of Korea, 278 pp.
- Langland, R. H., Shapiro, M. A. and Gelaro, R. 2002. Initial condition sensitivity and error growth in forecasts of the 25 January 2000 east coast snowstorm. Mon. Weather Rev. 130, 957.
- Lim J.-Y. , Chun Y . The characteristics of Asian dust events in Northeast Asia during the springtime from 1993 to 2004. Glob. Planet. Change. 2006; 52: 231–247.
- Liu J. , Fung I. , Kalnay E. , Kang J.-S . CO2 transport uncertainties from the uncertainties in meteorological fields. Geophys. Res. Lett. 2011; 38: 12808.
- Majumdar S. J. , Aberson S. D. , Bishop C. H. , Buizza R. , Peng M. S. , co-authors . A comparison of adaptive observing guidance for Atlantic tropical cyclones. Mon. Weather Rev. 2006; 134: 2354–2372.
- Merrill J. T. , Kim J . Meteorological events and transport patterns in ACE-Asia. J. Geophys. Res. 2004; 109: 19S18.
- National Institute of Meteorological Research. Asian dust reports in 2008, technical note of asian dust laboratory.
- National Institute of Meteorological Research. 2010. Asian dust reports in 2009, technical note of asian dust laboratory. Korea meteorological administration, Seoul, Republic of Korea, 236 pp.
- National Institute of Meteorological Research. 2011. Asian dust reports in 2010, technical note of asian dust laboratory. Korea meteorological administration, Seoul, Republic of Korea, 309 pp.
- Park, S.-Y., Kim, H. M., Lee, T.-Y. and Morgan, M. 2013. Statistical distributions of singular vectors for tropical cyclones affecting Korea over a 10-year period. Meteorol. Atmos. Phys. 120, 107.
- Peng M. S. , Reynolds C. A . Double trouble for typhoon forecasters. Geophys. Res. Lett. 2005; 32: 02810.
- Peng M. S. , Reynolds C. A . Sensitivity of tropical cyclone forecasts as revealed by singular vectors. J. Atmos. Sci. 2006; 63: 2508–2528.
- Rabier F. , Klinker E. , Courtier P. , Hollingsworth A . Sensitivity of forecast errors to initial conditions. Q. J. Roy. Meteorol. Soc. 1996; 122: 121–150.
- Reynolds R. W. , Rayner N. A. , Smith T. M. , Stokes D. C. , Wang W . An improved in situ and satellite SST analysis for climate. J. Clim. 2002; 15: 1609–1625.
- Rolph G. D . Real-time Environmental Applications and Display System (READY). 2003; Silver Spring, MD: NOAA Air Resources Laboratory. Website ( http://www.arl.noaa.gov/ready/hysplit4.html ) .
- Uno I. , Amano H. , Emori S. , Kinoshita K. , Matsui I. , Sugimoto N . Trans-Pacific yellow sand transport observed in April 1998: a numerical simulation. J. Geophys. Res. 2001; 106: 18331–18344.
- Wilks D. S . Statistical methods in the atmospheric sciences. 2006; Academic Press, Burlington, MA. 627. 2nd ed.
- Wu C. C. , Chen J.-H. , Lin P.-H. , Chou K.-H . Targeted observations of tropical cyclone movement based on the adjoint-derived sensitivity steering vector. J. Atmos. Sci. 2007; 64: 2611–2626.
- Yumimoto K. , Uno I. , Sugimoto N. , Shimizu A. , Liu Z. , co-authors . Adjoint inversion modeling of Asian dust emission using lidar observations. Atmos. Chem. Phys. 2008; 8: 2869–2884.
- Zhang F. , Bei N. , Nielsen-Gammon J. W. , Li G. , Zhang R. , co-authors . Impacts of meteorological uncertainties on ozone pollution predictability estimated through meteorological and photochemical ensemble forecasts. J. Geophys. Res. 2007; 112: 04304.
- Zhao T. L. , Gong S. L. , Zhang X. Y. , Blanchet J.-P. , Mckendry I. G. , co-authors . A simulated climatology of Asian dust aerosol and its trans-Pacific transport. Part I: mean climate and validation. J. Clim. 2006; 19: 88–103.
- Zou X. , Vandenberghe F. , Pondeca M. , Kuo Y.-H . Introduction to adjoint techniques and the MM5 adjoint modeling system. 1997; 110. NCAR Tech. Note NCAR/TN- 435STR, NCAR, Boulder, CO.