Abstract
We conducted a soil warming experiment in a cool-temperate forested peatland in northern Japan during the snow-free seasons of 2007–2011, to determine whether the soil warming would change the heterotrophic respiration rate and its temperature sensitivity. We elevated the soil temperature by 3°C at 5-cm depth by using overhead infrared heaters and continuously measured hourly soil CO2 fluxes with a 15-channel automated chamber system. The 15 chambers were divided into three groups each with five replications for the control, unwarmed-trenched and warmed-trenched treatments. Soil warming enhanced heterotrophic respiration by 82% (mean of four seasons (2008–2011) observation±SD, 6.84±2.22 µmol C m−2 s−1) as compared to the unwarmed-trenched treatment (3.76±0.98 µmol C m−2 s−1). The sustained enhancement of heterotrophic respiration with soil warming suggests that global warming will accelerate the loss of carbon substantially more from forested peatlands than from other upland forest soils. Soil warming likewise enhanced temperature sensitivity slightly (Q 10, 3.1±0.08 and 3.3±0.06 in the four-season average in unwarmed- and warmed-trenched treatments, respectively), and significant effect was observed in 2009 (p<0.001) and 2010 (p<0.01). However, there was no significant difference in the basal respiration rate at 10°C (R 10, 2.2±0.52 and 2.8±1.2 µmol C m−2 s−1) between treatments, although the values tended to be high by warming throughout the study period. These results suggest that global warming will enhance not only the heterotrophic respiration rate itself but also its Q 10 in forests with high substrate availability and without severe water stress, and predictions for such ecosystems obtained by using models assuming no change in Q 10 are likely to underestimate the carbon release from the soil to the atmosphere in a future warmer environment.
1. Introduction
Temperature sensitivity of soil carbon decomposition and its feedback to climate change have attracted considerable interest for the past two decades, because more than twice as much carbon is stored in the soil as in the atmosphere (IPCC, Citation2007) and because the CO2 efflux from soils is the second largest flux in the terrestrial carbon cycle after gross primary production. The estimated annual CO2 emission from soil was 98 Pg C yr−1 in 2008, exceeding the anthropogenic CO2 release by an order of magnitude (Bond-Lamberty and Thomson, Citation2010). Accordingly, a relatively small increase in soil respiration would provide strong positive feedback to the atmosphere by increasing the amount of atmospheric CO2 (Jenkinson et al., Citation1991; Kirschbaum, Citation1995; Cox et al., Citation2000; Knorr et al., Citation2005). Forests contain about 45% of the global carbon stock, a large part of which is in the forest soils. For this reason, many soil warming experiments have been conducted in forests to clarify the warming effect on the soil respiration rate and its temperature sensitivity. Many of these studies have found that the warming effect decreases with time in experiments conducted over several years, owing to the depletion of substrate availability or acclimation of the decomposer community (Luo et al., Citation2001; Rustad et al., Citation2001; Melillo et al., Citation2002; Davidson and Janssens, Citation2006). Hence, the feedback strength may not be as large as that predicted under the assumption that the temperature sensitivity of soil organic matter (SOM) decomposition remains constant (Friedlingstein et al., Citation2006). However, many of these studies were performed with upland mineral soils, in which conditions are generally favourable for decomposition and carbon densities are relatively low (Davidson and Janssens, Citation2006). In contrast, Bellamy et al. (Citation2005) have shown that recent losses of soil carbon in England and Wales have likely offset absorption of carbon by terrestrial sinks, and that peat and bog soils are losing carbon at a faster rate than upland soils. In addition, the recent experimental evidence has shown that heterotrophic respiration increased in response to warming for at least 8 yr in a subarctic peatland (Dorrepaal et al., Citation2009). Thus, the long-term effect of climate warming on soil carbon is still under debate, and more case studies, especially of ecosystems with soils with high carbon stocks, are required to clarify the effect (Davidson and Janssens, Citation2006).
We conduct a soil warming experiment in a forested peatland to clarify the warming effect on the CO2 efflux from the soil with high carbon stock. For precise evaluation of the warming effect on the soil CO2 efflux and its temperature sensitivity, we perform hourly measurements of the efflux rate with a multichannel automated chamber system throughout the snow-free period during 4 yr and 3 months. Because of the large size and number of chambers used (covering a total of 4.05 m2 per treatment), we reduce the effect of spatial variability. We add overhead infrared heaters to increase the soil temperature at 5-cm depth by 3°C, and apply trenching to separate heterotrophic respiration (microbial SOM decomposition rate without the priming effect of living roots and root deposition) from the total soil CO2 efflux. Several shortcomings are reported on the trenching method by previous studies (Hanson et al., Citation2000; Kuzyakov, 2006), thus the warming effect on the heterotrophic respiration is evaluated after discussion on the possible uncertainties and applicability caused by our trenching. We hypothesise that soil warming will stimulate soil heterotrophic respiration rate in this forest because substrate availability is high due to the high soil carbon stock. We also predicted that warming will alter not only the respiration rate but also the relationship between soil temperature and respiration, which will lead to a change in the temperature sensitivity of respiration (Q 10). Although several studies have questioned the validity of using Q 10 values (Lloyd and Taylor, Citation1994; Kirschbaum, Citation1995; Davidson et al., Citation2006; Bronson et al., Citation2008), use of this parameter allows convenient comparison with the results of previous studies. A major uncertainty in predictions of the future carbon cycle derives from the assumption that the observed temperature sensitivity of soil respiration under the present climatic conditions would not change in a future warmer climate (Luo et al., Citation2001). If Q 10 (or basal rate of soil CO2 efflux at a certain temperature (10°C in this study); R 10) changes as conditions become warmer, then model simulations that assume a constant Q 10 or R 10 would over- or underestimate future soil respiration rates.
2. Materials and methods
2.1. Site description
The experiment was conducted in Teshio Experimental Forest, Hokkaido University, Northern Japan (44°55′N, 142°01′E, 20 m a.s.l.), which has the climatic characteristic of a mid-latitude, cool-temperate ecosystem. The site is a peatland and the surface organic layer is very thick (>40 cm). The site became dry more than 40 yr ago, and the surface litter layer is shallow.
In the late 1970s, a forest plantation was established at the site. To mimic the original vegetation, the site was planted with Abies sachalinensis (F. Schmidt) Mast., Picea jezoensis (Sieb. et Zucc.) Carr., Quercus crispula Blume, Betula ermanii Cham., Betula platyphylla Skatchev var. japonica (Miq.) Hara, and Acer pictum Thunb. subsp. mono (Maxim.) H. Ohashi. In 2009, the tree height was 10–15 m, and the density and basal area were 831 stems ha−1 and 20.7 m2 ha−1, respectively. Evergreen dwarf bamboos (Sasa senanensis Rehd. and Sasa kurilensis (Rupr.) Makino et Shibata; 1.5 m in height) formed a dense undergrowth at the site. Therefore, in October 2006, before the chambers were installed for the measurements, the dense Sasa bamboo within the 1480 m2 fenced experimental site was clear cut, leaving the overstory intact. To diminish the influence of residual decomposing roots, the chambers were not installed until July 2007 to allow the bamboo roots remaining after the cutting to decompose. The forest floor was maintained bamboo-free by the clear cutting throughout the study period.
2.2. Experimental layout and soil warming
We prepared 15 chambers to measure the soil CO2 efflux rate, and were divided into five blocks of three chambers. The three chambers in each block were randomly assigned to one of three treatments: (1) warmed-trenched; (2) unwarmed-trenched; or (3) undisturbed control (neither trenched nor warmed). We thus have five replications for each treatment. We dug a 30-cm-deep trench around all trenched chambers, 10 cm away from each wall, using a hand-held chainsaw, inserted 4-mm-thick PVC boards into the trenches to prevent the growth of roots into the trenched chambers, and then backfilled the remaining space with fine river sand. We removed newly emerged seedlings in all of the 15 chambers every few weeks during the study period. Thus, no form of vegetation was allowed to grow inside the chambers.
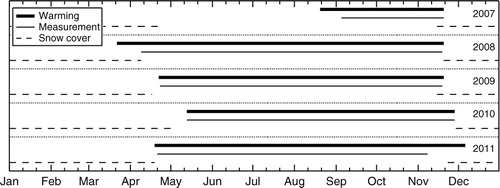
We started soil warming in the warmed-trenched chambers on 20 August 2007, 40 d after setting up the chamber systems and performing the trenching, and continued the warming until snow covered the site (20 November). The warming periods were almost the same with the snow-free periods of the study site, although the warming started 20 d earlier and 11 d after the snow disappearance in 2008 and 2010, respectively, and ended 14 d after the snow accumulation in 2011 (). A frame made of PVC pipes anchored to two sides of the chamber was installed to hold the 58-cm-long, 800-W infrared heating lamps suspended at 1.6 m above the ground. The warming treatment raised the soil temperature within the chamber to 3°C higher than that in the other chambers at 5-cm depth. All chambers were 3 m apart so that the heat would not affect the unwarmed chambers. We did not apply this warming in the snow-covered period, because the radiation heat from the infrared heater causes excess snow melt and the following freeze of the melting water in the soil, especially when the snow surface become close to the heater, which is considered to be unrealistic condition in future warmer climate.
Fig. 1 Warming, measurement and snow-covered periods during 2007–2011.
2.3. Soil CO2 efflux and environment measurements
We used an automated chamber system designed by Liang et al. (Citation2003, Citation2004), modified to operate in a closed mode (Takagi et al., Citation2009; Liang et al., Citation2010). The system consisted of 15 automated chambers (each 0.9 m×0.9 m×0.5 m high) and a control unit. The control unit comprised a 15-channel gas sampler, an infrared gas analyser (IRGA; LI-840, Li-Cor, Lincoln, NE, USA), and a data-logger (CR 1000, Campbell Scientific, Logan, UT, USA). The chambers were made of clear PVC boards (2 mm thick) attached to a 0.9- or 0.5-m-long square frame (cross section was 3 cm×3 cm) made with plastic-coated steel pipe. Each chamber had two PVC lids (4 mm thick) hinged on opposite sides of the chamber. The two lids were automatically opened during non-measurement periods and closed during measurement by two pneumatic cylinders controlled by the data-logger. The opening of the lids during non-measurement periods allowed precipitation and leaf litter to reach the enclosed soil surface, thus maintaining natural conditions within the chamber. Over a 1-hour period, the 15 chambers were closed sequentially; each was closed for 240 seconds each hour. While measurements were being made, two microfans mixed the air inside the chamber, and a micro-diaphragm pump circulated the air at the rate of 0.7 L min−1 through the IRGA, which measured the concentration of CO2 and the water vapour and stored to the logger every 20 seconds.
Air temperature at a height of 25 cm in the centre of the chamber and soil temperature at 5-cm depth were measured at every chamber with type-T thermocouples at 20-second intervals during the whole study period. Volumetric soil water content (SWC) was measured at 1-minute intervals with soil moisture sensors (CS616, Campbell Scientific) at 5-cm depth inside eight chambers (three unwarmed, three warmed, two undisturbed control treatments) during the measurement in 2011. SWC was corrected for the peat soil in accordance with the procedure proposed by Nagare et al. (Citation2011) with a modification for the differing probe circuitry of the CS616 using the calibration of Hansson and Lundin (Citation2006). The 30-minute averages of soil and air temperatures and SWC were all recorded by the logger. In addition, to check the warming efficiency at various soil depths, we observed the soil temperature profile (at depths of 1, 5, 15, 25 and 35 cm) in 2 of the 15 chambers (one unwarmed-trenched and one warmed-trenched chamber) every 20 seconds from 22 August to 7 September 2011, and the 30-minute averaged data were recorded by the logger.
The measurement periods were almost equal to and within the warming periods, although the measurement started 19 d after the start of warming in 2008, and ended 28 d earlier than the end of warming in 2011 (), mainly because of the trouble in the observation system.
Basic meteorological parameters were obtained from the weather station situated 150 m away from the study site. The hourly sum of precipitation was measured using a spilt water tipping bucket (B-071, Nakaasa Sokki Co., Tokyo, Japan) heated during winter. Air temperature was measured every 5 seconds using a platinum resistance thermometer (HMP45D, Vaisala, Helsinki, Finland) installed at 1.5 m from the ground. Solar radiation was measured at a height of 13 m using a thermopile-type pyranometer (CM-6B, Kipp & Zonen, Delft, The Netherlands). Snow depth was measured using an ultrasonic distance meter (SR-50, Campbell Scientific). All meteorological parameters were recorded by a data-logger (CR 10X, Campbell Scientific).
2.4. Data processing and analysis
For each of the 15 chambers, the soil CO2 efflux (F
c; µmol C m−2 s−1) was calculated hourly using the last 10 of 12 concentration data recorded every 20-second interval during 240 seconds by an equation which corrects the effect of soil evaporation on the CO2 efflux rate (LI-COR, Inc., Citation1997). However, the chamber system sometimes failed to measure the changes in the CO2 concentration correctly; for example, slow CO2 increase especially at the beginning of the measurement possibly caused by the delay in the lid-closing or air-drawing, or slow CO2 increase at the end of the measurement possibly caused by the early CO2 saturation in the closed chamber. To determine the quality of the data, we checked the stationarity of the rate of change of CO2 mole fraction (ΔC/Δt: µmol mol−1 s−1). We calculated the average ΔC/Δt for three cases: (a) using 10 measurements, excluding the first two after the measurement chamber was closed; (b) using eight measurements, excluding both the first and the last measurements of case (a) data, and (c) using six measurements, excluding both the first and the last measurements of case (b) data. Under ideal conditions, the ΔC/Δt value obtained by these calculations would be the same for all three cases. We evaluated the quality of ΔC/Δt by comparing ΔC/Δt values calculated for the three cases using the following two discriminants:1
2
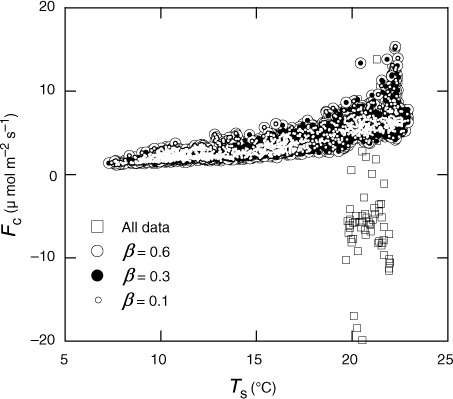
where the subscripts a, b and c correspond to the three cases, and β is the threshold value. We tested several cases for the value of β ( as an example). Almost all the irregular values were removed when we chose 0.3 or 0.6 for β, but few outliers still existed. However, we could obtain clearer relationship between soil temperature (T
s) and F
c if we chose 0.1, but the sample number which passed this criteria decreased markedly (51% compared with 95 and 98% for 0.3 and 0.6, respectively, in the case of ). Thus, we chose 0.3 for β, and then used the ΔC
a
/Δt
a values that passed both criteria (1 and 2) to evaluate the efflux for each chamber, and removed remaining few outliers manually referring events and troubles during the measurement. This threshold value (0.3) means that the data are rejected when differences in the ΔC/Δt values among three (a–c) cases are of the ΔC/Δt value.
Fig. 2 Relationship between soil temperature (T s) and soil CO2 efflux (F c) after outlier detection by eqs. (1) and (2) with three cases for their threshold value (β=0.1, 0.3 and 0.6). Efflux data without outlier detection are also plotted. Data obtained from April to August 2008 at Chamber no. 10 are used.
To examine the temperature sensitivity of F
c, we conducted a regression analysis of the F
c against the soil temperature (T
s) as the environmental variable:3
where R 10 is the basal respiration rate at the reference temperature of 10°C (µmol C m−2 s−1) and Q 10 is the temperature sensitivity of the respiratory flux. Daily R 10 and Q 10 were determined by the least-squares method from hourly F c and T s data within a 15-d moving window (the 7 d previous to and following each measurement day) for each of the 15 chambers.
Repeated-measures ANOVA was used to examine warming effect on monthly averages of T s, F c, Q 10 and R 10 for each snow-free season during 2007–2011 (five replications for each treatment). Between-subject effect was evaluated as warming treatment; within-subject effect was month-of-season. In repeated-measures ANOVA, the sphericity assumption was always violated; to account for this violation, degrees of freedom were Greenhouse–Geisser adjusted. This analysis was conducted with the JMP software (SAS Institute, Cary, NC, USA).
To evaluate the warming effect on F c, we calculated ‘enhancement ratio (%)’ as (warmed F c – unwarmed F c)/unwarmed F c×100. We also determined the effect of soil moisture on the F c, using data obtained in 2011. There was a negative correlation between daily-average soil temperature and moisture for each treatment (−0.63< r<−0.62, n=170). To eliminate the effect of temperature on measured F c, we first calculated the daily-average F c and T s of five chambers for each treatment, and the average F c values were plotted against the average T s to get the regression equation for each treatment using eq. (3). Temperature-normalised F c values were calculated as the ratio of the difference between the measured F c (F cm) and the F c estimated at the observed temperature from the regression curve obtained for each treatment [F ce (T s)] to the measured F c, as (F cm–F ce (T s))/F cm, and was plotted against the daily-average SWC.
2.5. Soil carbon, root biomass and litter-fall measurements
To evaluate the soil carbon content and density in the study site, we sampled the soil next to each of the five control chambers in August 2011, collecting cores of 100 cm3 (5 cm in diameter) from four depths (5, 10, 20 and 40 cm). Dry bulk density was obtained by weighing the samples after oven-drying for 2 d at 80°C. From each soil core, three homogenised samples weighing between 49 and 52 mg were analysed, and the average was computed. Soil carbon content was analysed with an automatic NC analyser (Sumigraph NC-900, Sumika Chemical Analysis Service, Japan) attached to a gas chromatograph (GC-8A, Shimadzu Corp., Japan).
Root biomass in the soil was measured to a depth of 45 cm in three 15-cm-thick soil layers at three of the five soil coring sites. All roots>0.5 mm in diameter in a soil block (15 cm×15 cm×15 cm) from each layer were collected, washed, oven-dried at 80°C for 2 d and weighed.
In May 2011, we set five litter-fall traps (each area is 0.5 m2) made of polyester mesh sheet to collect small litter (leaves, seeds and small branches). In addition, we set a 4 m×25 m plot at the ground surface to collect large (the diameter is>1 cm) branch litter. Trapped litter was collected every month during May–December and weighed after oven-drying at 80°C for several days (until there was no change in the weight).
3. Results
3.1. Soil carbon content, root biomass and litter-fall rate
The soil carbon content (mean±standard deviation) was 99±32, 111±32, 188±22 and 233±45 g kg−1, at depths of 5, 10, 20 and 40 cm, respectively, and the soil carbon density of the surface 30 cm-thick and 50 cm-thick soil layer was 17.6±1.6 and 28.0±3.1 kg C m−2, respectively. The root biomass, 664±64, 156±22 and 41±8 gDW m−2, in the 0–15, 15–30 and 30–45 cm soil layers, respectively, decreased sharply with depth; more than 95% of the roots were in the surface 0–30 cm soil layer. The root carbon contributes only 2% to the total carbon content within surface 30-cm deep in the soil. The annual litter-fall rate was 0.169±0.021 and 0.056 kg C m−2 for small and large litter, respectively, and 0.225 kg C m−2 in total.
3.2. Inter-annual variation of micrometeorology
The annual mean air temperature ranged between 5.6 and 6.5°C during the 5 yr and the highest value was observed in 2010 (, b). The average air temperature during the observation period in 2010 and 2011 was 1.6 and 1.1°C higher than those in the other years, respectively. Annual precipitation ranged between 806 and 1682 mm, and 52–68% of the precipitation was received during the study period. The maximum annual and seasonal values were observed in 2010. In 2010, the site received the lowest solar radiation during the observation period because of the high frequency of precipitation and short snow-free period compared with the other years.
Fig. 3 Inter-annual variation of (a) soil temperature at 5-cm depth (T s) and temperature difference between unwarmed and warmed treatments (T s dif.), (b) soil CO2 efflux (F c) and daily-average air temperature (T a), (c) Q 10, and (d) basal respiration rate at 10°C (R 10). Thick lines are the average of five daily averages and the standard deviation is shown as shades for two trenched treatments. For undisturbed control treatment, only average values are shown as dot lines. The temperature difference is shown as the difference between daily averages of five chambers.
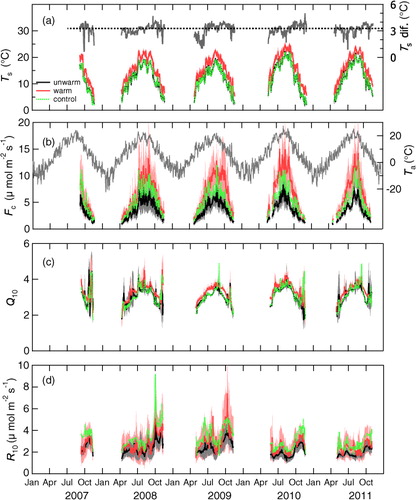
Table 1 Inter-annual variation of micrometeorology
3.3. Soil temperature and moisture
Experimental warming manipulated with infrared heaters significantly elevated soil temperature (p<0.001) (). During the four snow-free seasons of 2008–2011, the average soil temperature in the warmed-trenched chamber was 16.0±0.49°C (range in the daily average, 4.7–25.9°C) at 5-cm depth, which is 3.2°C higher than that of the unwarmed-trenched chambers (12.8±0.22°C; range, 1.2–22.8°C) or 3.3°C higher than that of the undisturbed control chambers (12.7±0.28°C; range, 0.9–22.5°C) (, a). Temperature profile observation revealed that the soil warming effect decreased linearly with the depth in the soil. The warming effect (i.e. temperature difference between unwarmed and warmed soils) decreased to about 1°C at 35-cm depth. However, the temperature difference at 1-cm depth was slightly (0.35°C) higher than the difference at 5-cm depth.
Table 2 F values of repeated-measures ANOVA on the effects of warming, month and their interaction on monthly averages of soil temperature at 5-cm depth (T s), soil CO2 efflux (F c), Q 10 and basal respiration rate at 10°C (R 10)
Table 3 Seasonal average (each measurement period for each year) and the standard deviation of soil temperature at 5-cm depth (T s) and soil CO2 efflux (F c)
Seasonal mean SWC (57±12%; mean±standard deviation of three replicates) obtained at warmed chambers was 5% less than the SWC in the unwarmed-trenched chambers (62±11%). However, owing to the limited replication and the chamber-to-chamber variation, there was no significant difference between the treatments and the seasonal minimum of daily-average SWC was still high for both treatments (40 and 43% for warmed and unwarmed, respectively). Compared with the trenched two treatments, the seasonal mean SWC in the undisturbed control chambers (49%; mean of two replicates) showed lower value, possibly owing to the water uptake by plant roots.
3.4. Soil CO2 efflux and the warming effect
The soil CO2 efflux (F c) increased from the start of the growing season in spring until summer and then decreased towards leaf fall in autumn (b). Soil warming increased the F c consistently across the entire measurement period ( and , ), although the statistical significance was observed only during last three seasons from 2009 to 2011 (). On four-season average during 2008–2011, warming increased the efflux by 82% (or 26% per °C) (6.84±2.22 µmol C m−2 s−1; range in the daily average, 0.92–24.70 µmol C m−2 s−1) compared with the unwarmed chambers (3.76±0.98 µmol C m−2 s−1; range, 0.57–13.79 µmol C m−2 s−1), and by 30% (or around 9% per °C) compared with the control chambers (5.27±2.11 µmol C m−2 s−1; range, 0.70–23.89 µmol C m−2 s−1). The warming effect increased year-by-year and the seasonal average of the enhancement ratio was up to 94–99% in the last 2 yr (2010 and 2011) (, ), when higher average air temperature was observed during measurement period (). The seasonal average of the enhancement ratio was positively correlated with the seasonal average soil temperature during 2008–2011 (r=0.96, n=4, p<0.05). However, there was no apparent seasonal trend in the enhancement ratio throughout the study period (), although there was significant seasonal variation in the warming effect on F c during the last three seasons ().
Fig. 4 Monthly averages of soil CO2 efflux (F c), Q 10 and basal respiration rate at 10°C (R 10). The standard deviation is shown as vertical lines.
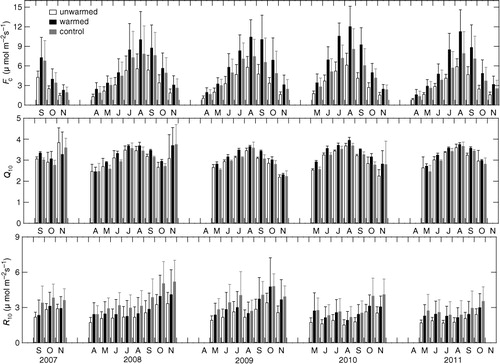
Fig. 5 Inter-annual variation of monthly average ratio of efflux rate in unwarmed-trenched chambers to total soil CO2 efflux (open circles), the residual (total – unwarmed-trenched) to total efflux (closed circles) and monthly average enhancement ratio of trenched efflux by warming (open squares).
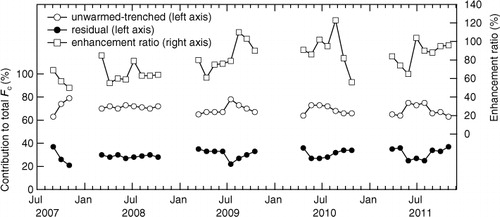
The proportion of unwarmed-trenched F c to control F c tended to be high during June–August in the seasonal variation during the last three seasons (2009–2011) (), but was quite stable in the inter-annual variation ranging 70–73% for the seasonal average of each year during 2008–2011 (). The total F c over the whole study period during 2008–2011 (838 d) was 3.2±0.8, 5.8±1.8 and 4.5±1.8 kg C m−2 in average of five chambers for unwarmed-trenched, warmed-trenched and undisturbed control treatments, respectively ().
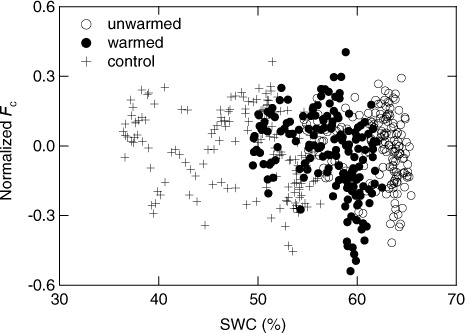
Daily F c increased exponentially with the increase in daily-average soil temperature in 2011 (), and decreases in normalised daily F c ((F cm−F ce (T s))/F cm) were observed in some high SWC days for all treatments (). However, there was no distinct trend in the relationship between normalised F c and the SWC for all treatments.
Fig. 6 Relationship between daily-average soil CO2 efflux (F c) and soil temperature at 5-cm depth (T s) in 2011 (n=5). Regression equations in the figure were obtained by the least-squares method using eq. (3).
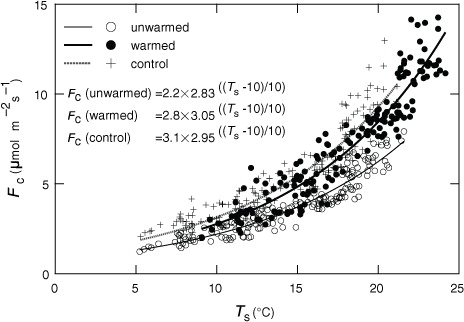
Fig. 7 Relationship between temperature-normalised daily-average F c and the soil water content (SWC). See text for the determination of temperature-normalised F c.
3.5. Temperature sensitivity and the warming effect
Examination of seasonal variation in Q 10 and R 10 ( and ) showed that Q 10 tended to be higher in summer, except for high values observed just after snow melt and just before snow accumulation, whereas R 10 tended to be higher in autumn. Significant warming effect was observed in the seasonal averages of Q 10 in 2009 (p<0.001) and 2010 (p<0.01), but not in 2007, 2008 and 2011 (). However, there was no significant warming effect on R 10 throughout the study period, because of the large variation among chambers, although the values tended to be high by warming (2.2±0.52 and 2.8±1.2 µmol C m−2 s−1 in the four-season average in unwarmed and warmed treatments, respectively) ( and , ). Q 10 in undisturbed control treatment (3.1±0.09 in the four-season average) was almost the same with that in unwarmed treatment ( and , ), while R 10 in control treatment (3.2±1.1 µmol C m−2 s−1 in the four-season average) was higher than that in unwarmed treatment and even higher than that in warmed treatment, because of the contribution of rhizospheric respiration.
Table 4 Seasonal average (each measurement period for each year) and standard deviation of Q 10 and basal respiration rate at 10°C (R 10)
4. Discussion
We applied trenching technique to separate heterotrophic (SOM-derived CO2 efflux) from rhizospheric (combination of root activity and the activity of microorganisms in the rhizosphere) respiration. Several short-comings on applying trenching method have been reported, such as initial CO2 flush caused by stimulating root decomposition by trenching and following decrease in the efflux rate by restraint of microorganism activities due to the elimination of priming effect of living root and its deposition on the microorganisms. In addition, trenching tends to increase the soil water by eliminating the root uptake (Hanson et al., Citation2000; Kuzuyakov, Citation2006).
Because we started the efflux measurement 9 months after the clear cut of dense undergrowth, Sasa bamboo, and the forest floor was maintained bamboo-free throughout the study period, the effect of initial CO2 flush is considered to be limited (Luan et al., Citation2011). Although the observed efflux in 2007 at trenched chamber might have been affected by the fast decomposition of cut roots by the trenching because the trenching itself was conducted 2 months before the measurement, the root biomass within the surface 30-cm soil layer observed outside the trench in 2011 was 820 gDW m−2 and was ca. 2% of soil carbon in the layer, thus the effect is considered not to be significant. Supporting this consideration, there was no distinct decreasing trend in the ratio of trenched to untrenched soil CO2 efflux throughout the four snow-free season observation () and the seasonal averages were stable (HR in ). This implies that the CO2 efflux from trenched treatment maintained a constant contribution to the total soil CO2 efflux during the four snow-free seasons and initial CO2 flush by decomposed roots had affected little to the amount of the CO2 efflux from the trenched treatments.
Uncertainties also arise as to the contribution of rhizospheric respiration below the trenching depth (30 cm), although our root biomass survey showed that roots below 30 cm accounted for only a minor portion (<5%) of the total root biomass within the surface 45-cm soil layer. Respiration by roots in the deep layer would lead to the overestimation of SOM-derived CO2 efflux from trenched treatments, and underestimation of rhizospheric respiration when it is determined as the difference in the efflux rate between trenched and untrenched treatments.
Involving these uncertainties on adopting trenching technique, we regarded the CO2 efflux obtained at trenched treatments as the SOM decomposition rate by microorganisms without the priming effect of living roots and root deposition and defined it as heterotrophic respiration hereafter [SOM-derived CO2 basal respiration in the definition by Kuzuyakov (Citation2006)], and discussed the warming effect on the heterotrophic respiration comparing efflux obtained from unwarmed- and warmed-trenched treatments. As the warming treatment was more effective at surface shallow layer in the soil, and the temperature increase decreased to ca. 1°C at 35-cm depth, the observed warming effect is considered to be mostly caused by the change in the microbial SOM decomposition at surface soil layer. Our trenching increased SWC; however, the effect on the heterotrophic respiration could be small because there was no distinct trend in the relationship between temperature-normalised F c and the SWC for all treatments and the range of the normalised F c was similar for both trenched and control treatments (). However, we abandoned quantitative evaluation of the rhizospheric respiration rate, and of contribution of heterotrophic and rhizospheric respiration to total soil respiration using the difference in the CO2 efflux between trenched and untrenched treatments, although the difference was used as a qualitative index of activities of roots and the microorganisms in the rhizosphere (, HR in ).
Our warming experiment increased the heterotrophic respiration by 82% ( and 3 ), which is higher than that reported by Melillo et al. (Citation2002), who found a 28% increase in soil respiration over 6 yr with a 5°C increase in soil temperature in an even-aged mixed forest. Similarly, Rustad et al. (Citation2001), who compiled data from seven forested ecosystems in their meta-analysis, reported a 7–46% rise in the soil CO2 efflux in response to 2–5 yr of experimental warming (1.5–6.0°C increase in soil temperature). In addition, Niinistö et al. (Citation2004) reported 27–43% rise in soil CO2 efflux during a 4-yr warming experiment (3–6°C increase in air temperature) in a 20-yr-old Scots pine forest, and Bronson et al. (Citation2008) found that the soil CO2 efflux was increased by 24 and 11% in the first and second year, respectively, by soil warming (5°C increase in soil temperature) in a black spruce forest. Schindlbacher et al. (Citation2009) reported a 39 and 45% increase in the soil heterotrophic respiration in the first and second year, respectively, by soil warming (4°C increase in soil temperature) in a mature forest dominated by Norway spruce.
In this study, not only did we find a high percentage increase in heterotrophic respiration rate in response to soil warming, we also did not observe any decreasing trend in the warming effect on the respiration rate during our study period (, ), although it is difficult to determine whether the higher warming effect in 2010–2011 was caused by the higher temperature or by the elapsed time effect. In contrast to our observation, many previous studies report that the warming effect decreased after several years because of substrate depletion or acclimation of the decomposer community. Melillo et al. (Citation2002) reported that the warming effect decreased after 6 yr of warming and that in the 10th yr the soil respiration showed no significant response to warming. Based on their meta-analysis, Rustad et al. (Citation2001) observed a significant positive effect of warming on the soil respiration during the initial 3 yr of an experiment but no significant effect in later years. Bronson et al. (Citation2008) reported that the initial increase in the soil CO2 efflux diminished over time even in a 2-yr warming experiment. Strömgren (Citation2001) found that the soil CO2 effluxes were not significantly different between heated and control plots in the fifth year of warming.
Chamber-to-chamber variation in the efflux rate would partly contribute to the large warming effect obtained in our study as inferred from large standard deviation in the efflux rate of warmed chambers. The average efflux rate decreased by 7–15% in warmed chambers if we obtained the seasonal and four-season averages of three chambers after excluding maximum and minimum efflux rate of five replicates, although the change was within ±5% for unwarmed efflux. In this case, the four-season average and the standard deviation were 3.90±0.72 and 6.05±0.31 µmol C m−2 s−1 for unwarmed and warmed efflux, respectively, and the enhancement ratio decreased to 55%. It is difficult to determine whether this large chamber–to-chamber variation originally had existed before the experiment or enhanced by warming (possibly both) because we failed to get efflux data before the warming experiment; however, we need to mention that our results include these uncertainties owing to the spatial variation, although the results still show a large and sustained warming effect compared with previous studies.
The high percentage increase in heterotrophic respiration rate throughout our warming experiment can be attributable to two specific environmental factors at our study site, namely, the large substrate availability and the high soil water content. Our study site is a peatland that was drained more than 40 yr ago. As a result, there is a very thick surface organic layer and no distinct soil stratification. The carbon content of the top 30-cm-thick soil layer (17.6±1.6 kg C m−2) is similar to the mean value in the surface layer of Japanese peatland soils (17.2 kg C m−2, Morisada et al., Citation2004) and much higher than the mean global estimate of 11.3 kg C m−2 for the 100-cm-thick surface soil layer (Sombroek et al., Citation1993). The soil heterotrophic respiration rate of 3.2 and 5.8 kg C m−2 at unwarmed and warmed trenched treatments, respectively, during the four snow-free seasons from 2008 to 2011 (838 d) accounts for 18 and 33% of the measured soil carbon content in the surface 30-cm-thick layer. This proportion seems not to be negligible; however, because the thickness of the peat soil was more than 40 cm, the proportion could be 11 and 19% of the carbon content in the surface 50-cm-thick layer. Moreover, litter-fall continuously supplied carbon to the soil during the study period (0.225 kg C m−2 snow-free period−1 in 2011). If we assume the same litter-fall rate for the other years, then 0.9 kg C m−2 of substrate would have been added during the four seasons to the measured soil carbon content, thus, respiration would not seriously deplete the available substrate. In addition, because the SWC was constantly high throughout the study period even in the warmed treatment, and there was no distinct relationship between F c and SWC for all treatments (), microbial activity would not have been stressed by a soil water deficit.
In support of our findings, repeated soil inventories in England and Wales during the last 25 yr have shown that peat soils and bogs lose carbon at a faster rate than upland soils (Bellamy et al., Citation2005). They revealed that peat soils lost carbon an order of magnitude faster than brown soils and man-made soils. In addition, Dorrepaal et al. (Citation2009) found that approximately 1°C of warming accelerated total ecosystem respiration rates on average by 60% in the spring and 52% in the summer in a subarctic peatland and that this effect was sustained for at least 8 yr, where at least 69% of the increase in respiration rate originated from carbon in peat towards the bottom (25–50 cm) of the active layer above the permafrost. Welker et al. (Citation2004) also reported that 9-yr experimental warming using open-top chamber (1–3°C increase in the summertime air and soil surface temperature) increased the ecosystem respiration in three tundra ecosystems, although decrease in the net CO2 absorption rate was observed only one of the three sites because of the larger increase in the gross ecosystem photosynthesis by the warming in the other two sites. Ise et al. (Citation2008) reported that in a boreal old black spruce forest and in fen sites (northern study area of the Boreal Ecosystem-Atmosphere Study), peat decomposition was highly sensitive to warming. They performed a simulation that revealed that 4°C of warming would cause a 40% loss of soil organic carbon from shallow peat and an 86% loss from deep peat, leading them to conclude that peatlands will quickly respond to the expected warming in this century by losing labile soil organic carbon during dry periods.
We determined seasonal variation in daily Q 10 and R 10 values and evaluated the warming effect on these values, because seasonal variation in the microbial community structure and the activity is reflected in the seasonal variation of the temperature sensitivities (Lipson, Citation2007). This analysis showed that warming slightly but significantly increased Q 10 in 2009 and 2010. However, there was no significant warming effect on R 10 throughout study period, although the average R 10 of warmed chambers tended to be high compared with that of unwarmed chambers ().
Previous studies have reported that warming either decreases Q 10 or does not alter it at all. Luo et al. (Citation2001) observed reductions in Q 10 under an induced temperature increase in a tallgrass prairie, and they suggest that decomposers became acclimated to climate warming or that the substrate supply was altered. Strömgren (Citation2001), Zhou et al. (Citation2007) and Bronson et al. (Citation2008) also reported that Q 10 was lower in heated than in control treatments. Niinistö et al. (Citation2004) found no significant difference in Q 10 values between warming and control treatments during a 4-yr experiment (although Q 10 was smaller in the warming plots than in the control plots), but they reported a significant increase in the basal respiration rate in the final year of their experiment. However, Reth et al. (Citation2009) reported sustained stimulation of soil respiration and temperature sensitivity after >10 yr of experimental warming of a cropland soil. Thus, the high substrate availability without severe water stress of our study site may have contributed to the slight increases in Q 10 and higher R 10 in our experiment. It is difficult to determine the mechanisms associated with the increases in Q 10 caused by soil warming, however, a change in the substrate composition could be a possible explanation. Conant et al. (Citation2008) analysed data from three independent sources (their laboratory incubation experiment, reanalysis of data from reported soil incubation studies, comparison between cultivated and grassland soils) by using their novel approach that accounts for changes in SOM quality during experiment, and confirmed that temperature sensitivity (corrected Q 10) increases with decreasing SOM lability. Based on their findings, we can attribute the Q 10 increase to the enhancement of SOM decomposition by warming and consequent decrease in the labile SOM because of its faster decomposition compared with more resistant SOM. Enhancement of soil microbial activities or a change in the composition of the microbial community could be other factors; however, further investigations should address these possibilities.
In conclusion, soil warming increased not only F c but also its temperature sensitivity in our forested peatland. This suggests that in a future warmer climate, the carbon release will be greater and the carbon sequestration potential will be weakened in ecosystems with high substrate availability and without severe water stress, and predictions for such ecosystems obtained by using models assuming no change in Q 10 are likely to underestimate the carbon release from the soil to the atmosphere in a future warmer environment.
5. Acknowledgements
This research was financially supported by the Global Environment Research Fund (B-073) and the Global Environment Research Account for National Institutes (Evaluation of the Potential Effect of Global Warming on Soil Carbon Emission of Japanese Forest Ecosystems) of the Ministry of the Environment, by a Grant-in-Aid for Scientific Research (no. 22310019) from the Japanese Ministry of Education, Culture, Sports, Science and Technology, and by the A3 Foresight Program (CarboEastAsia) of the Japan Society for the Promotion of Sciences. The authors thank Dr. O. Kishida and the staff of Teshio Experimental Forest for their support.
Related Research Data
References
- Bellamy P. H , Loveland P. J , Bradley R. I , Lark R. M , Kirk G. J. D . Carbon losses from all soils across England and Wales 1978–2003. Nature. 2005; 437: 245–248.
- Bond-Lamberty B , Thomson A . Temperature-associated increases in the global soil respiration record. Nature. 2010; 464: 579–582.
- Bronson D. R , Gower S. T , Tanner M , Linder S , Van Herk I . Response of soil surface CO2 flux in a boreal forest to ecosystem warming. Glob. Chang. Biol. 2008; 14: 856–867.
- Conant R. T , Drijber R. A , Haddix M. L , Parton W. J , Paul E. A , co-authors . Sensitivity of organic matter decomposition to warming varies with its quality. Glob. Chang. Biol. 2008; 14: 868–877.
- Cox P. M , Betts R. A , Jones C. D , Spall S. A , Totterdell I. J . Acceleration of global warming due to carbon-cycle feedbacks in a coupled climate model. Nature. 2000; 408: 184–187.
- Davidson E. A , Janssens I. A . Temperature sensitivity of soil carbon decomposition and feedbacks to climate change. Nature. 2006; 440: 165–173.
- Davidson E. A , Janssens I. A , Luo Y . On the variability of respiration in terrestrial ecosystems: moving beyond Q10 . Glob. Chang. Biol. 2006; 12: 154–164.
- Dorrepaal E , Toet S , Van Longtestijn R. S. P , Swart E , Van de Weg M. J , co-authors . Carbon respiration from subsurface peat accelerated by climate warming in the subarctic. Nature. 2009; 460: 616–619.
- Friedlingstein P , Cox P , Betts R , Bopp L , Von Bloh W , co-authors . Climate-carbon cycle feedback analysis: results from the C4MIP model intercomparison. J. Clim. 2006; 19: 3337–3353.
- Hanson P. J , Edwards N. T , Garten C. T , Andrews J. A . Separating root and soil microbial contributions to soil respiration: a review of methods and observations. Biogeochemistry. 2000; 48: 115–146.
- Hansson K , Lundin L. C . Water content reflectometer application to construction materials and its relation to time domain reflectometry. Vadose Zone J. 2006; 5: 459–468.
- IPCC. Solomon S , Qin D , Manning M , Chen Z , Marquis M , co-editors . Climate Change 2007: the physical science basis. Contribution of Working Group I to the Fourth Assessment Report of the Intergovernmental Panel on Climate Change.
- Ise, T., Dunn, A. L., Wofsy, S. C. and Moorcroft, P. R. 2008. High sensitivity of peat decomposition to climate change through water-table feedback. Nat. Geosci. 1, 763–766..
- Jenkinson D. S , Adams D. E , Wild A . Model estimates of CO2 emissions from soil in response to global warming. Nature. 1991; 351: 304–306.
- Kirschbaum M. U. F . The temperature dependence of soil organic matter decomposition, and the effect of global warming on soil organic-C storage. Soil Biol. Biochem. 1995; 27: 753–760.
- Knorr W , Prentice I. C , House J. I , Holland E. A . Long-term sensitivity of soil carbon turnover to warming. Nature. 2005; 433: 298–301.
- Kuzuyakov Y . Sources of CO2 efflux from soil and review of partitioning methods. Soil Biol. Biochem. 2006; 38: 425–448.
- Liang N , Hirano T , Zheng Z.-M , Tang J , Fujinuma Y . Soil CO2 efflux of a larch forest in northern Japan. Biogeosciences. 2010; 7: 3447–3457.
- Liang N , Inoue G , Fujinuma Y . A multichannel automated chamber system for continuous measurement of forest soil CO2 efflux. Tree Physiol. 2003; 23: 825–832.
- Liang N , Nakadai T , Hirano T , Qu L , Koike T , co-authors . In situ comparison of four approaches to estimating soil CO2 efflux in a northern larch (Larix kaempferi Sarg.) forest. Agr. Forest Meteorol. 2004; 123: 97–117.
- Li-COR, Inc. 6400-09 Soil Flux Chamber Instruction Manual. 1997; Lincoln, NE: LI-COR. Publication. no. 9710-119.
- Lipson D. A . Relationships between temperature responses and bacterial community structure along seasonal and altitudinal gradients. FEMS Microb. Ecol. 2007; 59: 418–427.
- Lloyd J , Taylor J. A . On the temperature dependence of soil respiration. Funct. Ecol. 1994; 8: 315–323.
- Luan J , Liu S , Wang J , Zhu X , Shi Z . Rhizoshperic and heterotrophic respiration of a warm-temperature oak chronosequence in China. Soil Biol. Biochem. 2011; 27: 503–512.
- Luo Y , Wan S , Hui D , Wallace L. L . Acclimatization of soil respiration to warming in a tall grass prairie. Nature. 2001; 413: 622–625.
- Melillo J. M , Steudler P. A , Aber J. D , Newkirk K , Lux H , co-authors . Soil warming and carbon-cycle feedbacks to the climate system. Science. 2002; 298: 2173–2176.
- Morisada K , Ono K , Kanomata H . Organic carbon stock in forest soils in Japan. Geoderma. 2004; 119: 21–32.
- Nagare R. M , Schincariol R. A , Quinton W. L , Hayashi M . Laboratory calibration of time domain reflectometry to determine moisture content in undisturbed peat samples. Eur. J. Soil Sci. 2011; 62: 505–515.
- Niinistö S. M , Silvola J , Kellomäki S . Soil CO2 efflux in a boreal pine forest under atmospheric CO2 enrichment and air warming. Glob. Chang. Biol. 2004; 10: 1363–1376.
- Reth S , Graf W , Reichstein M , Munch J. C . Sustained stimulation of soil respiration after 10 years of experimental warming. Environ. Res. Lett. 2009; 4: 024005.
- Rustad L. E , Campbell J. L , Marion G. M , Norby R. J , Mitchell M. J , co-authors . A meta-analysis of the response of soil respiration, net nitrogen mineralization, and aboveground plant growth to experimental ecosystem warming. Oecologia. 2001; 126: 543–562.
- Schindlbacher A , Zechmeister-Boltenstern S , Jandl R . Carbon losses due to soil warming: do autotrophic and heterotrophic soil respiration respond equally?. Glob. Chang. Biol. 2009; 15: 901–913.
- Sombroek W. G , Nachtergaele F. O , Hebel A . Amounts, dynamics and sequestering of carbon in tropical and subtropical soils. AMBIO. 1993; 22: 417–426.
- Strömgren M . Soil-surface CO2 flux and growth in a boreal Norway spruce stand, Effects of soil warming and nutrition. 2001; Uppsala: Acta Universitatia Agriculturae Sueciae, Silvestria 220, Swedish University of Agricultural Sciences. 44. ISBN 91-576-6304-1 Doctoral thesis.
- Takagi K , Fukuzawa K , Liang N , Kayama M , Nomura M , co-authors . Change in CO2 balance under a series of forestry activities in a cool-temperate mixed forest with dense undergrowth. Glob. Chang. Biol. 2009; 15: 1275–1288.
- Welker J. M , Fahnestock J. T , Henry G. H. R , O'Dea K. W , Chimner R. A . CO2 exchange in three Canadian High Arctic ecosystems: response to long-term experimental warming. Glob. Chang. Biol. 2004; 10: 1981–1995.
- Zhou X , Wan S , Luo Y . Source components and interannual variability of soil CO2 efflux under experimental warming and clipping in a grassland ecosystem. Glob. Chang. Biol. 2007; 13: 761–775.