Abstract
Coastal regions around the globe represent a major source for anthropogenic aerosols in the atmosphere, but the surface characteristics may not be optimal for the Moderate Resolution Imaging Spectroradiometer (MODIS) algorithms designed for aerosol retrievals over dark land or ocean surfaces. Using data collected from 62 coastal stations worldwide by the Aerosol Robotic Network (AERONET) in 2002–2011, statistical assessments of uncertainties are conducted for coastal aerosol optical depth (AOD) retrieved from MODIS measurements aboard the Aqua satellite (i.e., the Collection 5.1 MYD04 data product generated by the MODIS atmosphere group). It is found that coastal AODs (at 550 nm) characterised respectively by the Dark Land algorithm and the Dark Ocean algorithm all exhibit a log-normal distribution, which contrasts to the near-normal distribution of their corresponding biases. After data filtering using quality flags, the MODIS AODs from both the Dark Land and Dark Ocean algorithms over coastal regions are highly correlated with AERONET AODs (R 2≈0.8), but both have larger uncertainties than their counterparts (of MODIS AODs) over land and open ocean. Overall, the Dark Ocean algorithm overestimates the AERONET coastal AOD by 0.021 for AOD < 0.25 and underestimates it by 0.029 for AOD > 0.25. This dichotomy is shown to be related to the ocean-surface wind speed and cloud-contamination effects on the MODIS aerosol retrievals. Consequently, an empirical correction scheme is formulated that uses cloud fraction and sea-surface wind speed from Modern Era Retrospective-Analysis for Research and Applications (MERRA) to correct the AOD bias from the Dark Ocean algorithm, and it is shown to be effective over the majority of the coastal AERONET stations to (a) simultaneously reduce both the mean and the spread of the bias and (b) improve the trend analysis of AOD. Further correlation analysis performed after such an empirical bias correction shows that the MODIS AOD is also likely impacted by the concentration of suspended particulate matter in coastal waters, which is not taken into account during the MODIS AOD retrievals. While mathematically the MODIS AODs over the global coastal AERONET sites show statistically significant discrepancies (p<1%) from their respective AERONET-measured counterparts in terms of mean and frequency, different applications of MODIS AODs in climate and air-quality studies often have their own tolerances of uncertainties. Nevertheless, it is recommended that an improved treatment of varying sea-surface wind and sediment over coastal waters be an integral part in the continuous evolution of the MODIS AOD retrieval algorithms.
1. Introduction
Aerosols play an important role in the Earth's energy balance and hydrological cycle (Charlson et al., Citation1992) through scattering and absorbing radiation (direct affect), as well as by influencing cloud radiative effects through the modification of their microphysical properties in the atmosphere (indirect affect). These airborne particles also reduce visibility and affect human health (Samet et al., Citation2000). The Intergovernmental Panel on Climate Change (IPCC) in their fourth assessment reports that the aerosol direct and indirect effects can render a cooling powerful enough to offset the warming from the anthropogenic CO2 by almost one-third (IPCC, Citation2007). However, this estimate is considered to have the largest uncertainties in the climate models, and a further reduction of such large uncertainties requires observation-based characterisation of aerosol properties on a global scale (IPCC, Citation2007). One key aerosol property that satellite remote sensing has been providing globally and that is used widely by the research community in the past decade is aerosol optical depth (AOD), a parameter that can be considered as a first-order indicator of columnar aerosol mass and aerosol forcing (Remer et al., Citation2005). Hence, the quantitative description of AOD uncertainty characteristics is critical for an improved understanding of the aerosol impact on climate (IPCC, Citation2007), as well as for monitoring the surface particulate matter concentrations and their effects on air quality (Hoff and Christopher, Citation2009).
Various studies have found that the uncertainties in the instantaneous AOD retrievals from satellite sensors such as Moderate Resolution Imaging Spectroradiometer (MODIS) and Multi-Angle Imaging SpectroRadiometer (MISR) are generally within the (pre-launch) expected error (EE) envelope that is often characterised as a linear function of AOD itself. For example, in comparison with world-wide AOD measured from Aerosol Robotic Network (AERONET), MODIS AOD product is shown to have an EE envelope of ±(0.05 + 0.15AODaeronet) over land and ±(0.03 + 0.05AODaeronet) over the ocean (Remer et al., Citation2005; Levy et al., Citation2007, Citation2010; Kahn et al., 2011). As these equations parameterise the retrieval uncertainty as a function of AODaeronet, their applicability for most AOD retrievals from satellites is constrained by the very limited spatial coverage of AERONET, although in practice many studies have used the AOD retrieval value itself in these equations to infer its corresponding uncertainty (Yu et al., Citation2006 and references therein). Furthermore, the estimate of the EE envelope is based upon the MODIS-AERONET AOD comparison over the whole globe. Therefore, it does not reflect variation of retrieval uncertainties due to the change of land surface type and atmospheric conditions (Hyer et al., Citation2011) nor does it contain any information related to the mean and the spread of the AOD biases (i.e. probability density function (PDF) of bias; Li et al., Citation2007). At regional scales, such as over the semi-arid western US or over east Asia during the spring dust season, the mean bias of MODIS AOD is shown to be positive, and the AOD error is larger and often outside of the global EE envelope (Drury et al., Citation2008; Wang et al., Citation2010). It is further noted that assessment of PDFs of AODs and AOD bias is highly relevant to questions related to the reliability of representing extreme AOD events in satellite-based AOD climatology and/or air-quality applications. Consequently, the characteristics of satellite-based AOD uncertainty cannot be fully revealed without an analysis at the regional scale and a characterisation beyond the uncertainty envelope to include more statistical parameters (such as PDF of biases).
This study focuses on the characterisation of MODIS AOD uncertainty over the coastal regions because: (a) The MODIS AOD product over the coastal region is a simple union of the retrievals from algorithms that are designed for either over land only or over open ocean only, and (as discussed below) neither algorithm has a dedicated scheme to characterise the surface reflectance over the coastal region that is often influenced by a sand–water mixture and water reflectance contributed by the underlying sea shore and suspended matter in the coastal ocean; (b) the coastal region is often of high importance to its local economic development through either tourism or serving as a hub for freight transportation (Tibbetts, Citation2002). Therefore, the assessment of the MODIS AOD product over the coastal region is critical for studying the trend of regional anthropogenic AOD and air pollution.
Only AODs retrieved by the MODIS Collection 5.1 dark surface algorithms, that is, the MODIS Dark Ocean algorithm and the MODIS Dark Target (hereafter Dark Land) algorithm are evaluated in this study. Both the Dark Ocean and Dark Land algorithms use the cloud-free Top Of the Atmosphere (TOA) reflectances that are measured at resolutions ranging from 250 m (in the red and near-infrared (NIR) wavelengths) to 500 m (in the visible, NIR, shortwave NIR) and are then aggregated to boxes of 20×20 (500-m resolution) pixels or equivalent to 10×10 km resolution at nadir for aerosol retrievals (Remer et al., Citation2005). The Dark Ocean algorithm is used for retrieval if all pixels within the 20×20 pixel box are water; otherwise, the Dark Land algorithm is used. Determining if a pixel is over land or over water is based on the MYD35 1-km data that contains information about surface type (Remer et al., Citation2005).
To date, a simple union of the AODs retrieved from the Dark Land and Dark Ocean algorithms makes up the MODIS Level 2 Land_And_Ocean AOD dataset that is popularly used by the research community. However, within a repeat cycle of 16 days, a box of MODIS 20×20 pixels over the coast can be exactly equal to 10×10 km2 (of ocean surface) when viewed by MODIS at nadir, but can also be equivalent to an area of 20×48 km2 area when viewed by MODIS at the high viewing zenith angle. In the first (nadir) case, the Dark Ocean algorithm can be applicable; but in the latter case, the 20×20 pixels can possibly contain one or more land pixel(s), and the Dark Land algorithm is applied (Remer et al., Citation2005). Consequently, assessment of MODIS AODs retrieved over coastal regions differs from the assessment in other regions because it requires evaluation to be conducted separately for Dark Land and Dark Ocean algorithms but likely with the same set of AERONET data along the coast.
In addition, to examine the performance of Dark Ocean along the coast, this study will also look into the assumptions made by the MODIS Dark Ocean algorithm related to the specification of the water-leaving radiance and configuration of the rough ocean-surface model that computes sun glint patterns and reflectance due to white caps (Kleidman et al., Citation2012). The spectral water-leaving radiances are influenced by suspended materials in the water column and by the shallow ocean floor and can vary significantly from open ocean to coastal ocean and from pixel to pixel. However, such variations are not considered in the current MODIS aerosol algorithm that assumes 0.0 water-leaving reflectance for all but the 550-nm band, where a value of 0.005 is assumed (Remer et al., Citation2005). The potential impact of this assumption on MODIS AOD retrievals is analysed here by relating the MODIS AOD bias to the water-leaving radiances (or their equivalent reflectance) retrieved independently by the algorithm developed in the MODIS Ocean Biology Processing Group (OBPG, http://oceancolor.gsfc.nasa.gov), or hereafter Ocean Color Algorithm.
The sun glint pattern and the reflectance contribution from the white caps are both estimated in the Dark Ocean algorithm with a Cox and Munk (Citation1954) rough ocean-surface model assuming a constant 6 ms−1 wind speed (Tanré et al., Citation1997). This assumption is shown to lead to retrieval errors over the open oceans (Kleidman et al., Citation2012), and an empirical method for correcting AOD errors due to this assumption and cloud contamination has been proposed (Zhang and Reid, Citation2006; Shi et al., Citation2011), primarily for the purpose of data assimilation of AOD over the open ocean. While this empirical method is shown to be effective to reduce the RMSE in the MODIS-AERONET AOD comparisons, two questions remain and will be addressed here: (a) the extent to which such correction reduces both the mean and the spread of the MODIS AOD biases and (b) the implications of such correction on the regional AOD trend analysis, by using analysis over the AEROENT site as an example.
Since exactly the same Dark Ocean and Dark Land algorithms are applied to retrieve AOD from both MODIS/Terra and MODIS/Aqua, here we only evaluate the uncertainty of MODIS/Aqua AOD to avoid the issues related to MODIS/Terra calibration (Levy et al., Citation2010). We introduce the data used in this study in Section 2, evaluate the performance of the MODIS Dark Ocean and Dark Land aerosol algorithms over coastal regions in Section 3, present the analysis of how water-leaving radiance, sea-surface wind and cloud impact the MODIS Land_And_Ocean data set in Section 4, discuss the impact of the empirical correction on trend analysis in Section 5, and finally summarise the findings in Section 6.
2. Data description, collocation and classification for AERONET coastal sites
An overview of the data products used for this research is provided in the first part of this section, including the MODIS aerosol algorithms and AOD product, AERONET aerosol measurements, sea-surface wind speed, and MODIS-normalised water-leaving radiance datasets retrieved from the MODIS Ocean Color algorithm. This is followed by the discussion of the processes used for collocating MODIS and AERONET AOD.
2.1. MODIS and AERONET AOD products
MODIS Level 2 Collection 5.1 MYD04 aerosol data from 4 July 2002 through 10 January 2011 are used. MODIS AOD is reported at seven wavelengths (470 nm, 550 nm, 660 nm, 870 nm, 1200 nm, 1600 nm and 2100 nm) for the MYD04 Dark Ocean algorithm and four wavelengths (470 nm, 550 nm, 660 nm and 2100 nm) for the Dark Land algorithm. The 550-nm wavelength is used for comparison with AERONET because it is consistent with the primary wavelength used by many climate and chemistry transport models (Kinne, Citation2003) as well as previous MODIS validation studies (Ichoku et al., Citation2005; Remer et al., Citation2005; Levy et al., Citation2007, Citation2010). Note that: (a) vegetated surfaces are not ‘dark’ at the 550-nm wavelength and, therefore, the AOD at this wavelength over land is derived from the retrieved AODs at the 470-nm and 660-nm channels (Levy et al., Citation2010) and (b) the MODIS Dark Ocean product provides two AOD datasets, one from the inversion using the best-fitting aerosol model and another from the average of inversions using several well-fitting models (ATBD-Citation2006; found online at http://modis-atmos.gsfc.nasa.gov/MOD04_L2/index.html); the latter is used for this research. The quality of each MODIS AOD retrieval is represented by its associated quality flag ranging from 3 (high confidence) to 0 (low or no confidence) (Levy et al., Citation2010). On a global scale, it has been shown that 66% of those AOD retrievals with quality flag three over land and 1, 2 or 3 over ocean have the EE envelopes respectively of ±(0.05 + 0.15AODaeronet) over the land and ±(0.03 + 0.05AODaeronet) over ocean (Remer et al., Citation2005; Levy et al., Citation2010).
The Land_And_Ocean AOD dataset is generated from a union of AODs retrieved respectively by the Dark Land and Dark Ocean algorithms. It is noted, however, that Collection 5.1 has two different variable names for Land_And_Ocean AOD; one is the ‘Image_Optical_Depth_Land_And_Ocean’ that has no QA involved in its production and another is ‘Optical_Depth_Land_And_Ocean’ that requires quality flags > 0 over land and≥0 over ocean (ATBD, Citation2006); the latter data variable is consequently used here. However, unlike the individual Land and Ocean AOD datasets, the combination product does not report QA flags.
AERONET AOD is derived from direct sun photometer measurements in some or all of the following seven different spectral bands centred at 340, 380, 440, 500, 670, 940 and 1020 nm (Holben et al., Citation1998). AERONET measures the extinction of direct beam solar radiation and applies the Beer–Lambert–Bouguer law to determine AOD (Holben et al., Citation1998) with uncertainties on the order of 0.01–0.02 (Eck et al., Citation1999). Only quality-assured and cloud-screened AERONET Level 2 data are used in this study to evaluate the MODIS aerosol product (Smirnov et al., Citation2000). To facilitate the comparison with MODIS, AERONET AOD measurements are interpolated to the 550-nm wavelength from multiple AERONET wavelengths using a quadratic fit on a log–log scale (Eck et al., Citation1999).
2.2. Sea-surface wind speed data
Sea-surface wind data (u and v components of the wind at ~2 m above the surface) is extracted from the Modern Era Retrospective-Analysis for Research and Applications (MERRA) meteorological database (tavg1_2d_flx_Nx; http://disc.sci.gsfc.nasa.gov/mdisc/, downloaded March 2012). This time-averaged hourly data are at 1/2° latitude by 2/3° longitude resolution and is re-analysed through the Goddard Earth Observing System-5 Data Assimilation System (GEOS-5 DAS) version 5.2.0 that includes a set of physics packages for the atmospheric general circulation model (Rienecker et al., Citation2011). The wind-related inputs into the MERRA system include wind speed data from Radiosondes, Pilot Balloon (PIBAL) measured winds, MODIS, Geostationary Operational Environmental Satellites (GOES), Special Sensor Microwave/Imager (SSM/I), Tropical Rainfall Measuring Mission (TRMM) Microwave Imager (TMI), NASA's Quick Scatterometer (QuickSCAT) and others (Rienecker et al., Citation2011). MERRA has been found to be one of the ‘best performing’ reanalysis products for ocean-surface turbulent flux and wind stress parameters (Brunke et al., Citation2011), and its near-surface wind speeds are shown to have biases within 0.5 ms−1 (Kennedy et al., Citation2011).
2.3. MODIS remote-sensing reflectance (Rrs) data for ocean surface
In order to evaluate whether the MODIS AOD over the ocean derived by the MYD04 Dark Ocean algorithm (which assumes constant ocean-leaving radiance) is influenced by the non-constant ocean reflectance, remote-sensing reflectance data (Rrs) for the ocean surface are obtained from the NASA GSFC Ocean Biology Processing Group (OBPG, http://oceancolor.gsfc.nasa.gov; http://oceandata.sci.gsfc.nasa.gov/) for the same time period as the MODIS AOD data presented above. The daily Rrs data are at 9-km resolution for 10 MODIS bands centred at 412, 443, 469, 488, 531, 547, 555, 645, 667, 678 nm. Rrs (with a unit of sr−1) is defined as the ratio between the normalised water-leaving radiance and the extraterrestrial solar irradiance (Gordon and Clark, Citation1981). The normalised water-leaving radiance is approximately the radiance that would exit the ocean in the absence of atmosphere with the Sun at zenith (Gordon, Citation1997). Hence, Rrs is not dependent on the Sun-viewing geometry, but primarily regulated by the water including its associated phytoplankton pigments, suspended particulate matter and dissolved organic matter (or yellow substances) in the ocean surface (Gordon and Clark, Citation1981; Gordon and Wang, Citation1994). Rrs is a standard parameter that is used as the input in many ocean-color algorithms for deriving the Chlorophyll-a pigment concentration and suspended particulate matter concentration (Bailey et al., Citation2010).
In contrast to the MYD04 Dark Ocean algorithm, MODIS Ocean Color algorithm takes a different approach to derive aerosol properties and Rrs (this is the counterpart of the land-surface reflectance). For the open ocean where Rrs in the NIR is negligible, aerosol properties are derived in the NIR and then extrapolated to the visible using pre-established look-up tables (LUTs) (Gordon and Wang, Citation1994). For the coastal ocean where Rrs in the NIR is no longer negligible, an iterative approach is used to determine both aerosol properties and Rrs simultaneously (Stumpf et al., Citation2003; Bailey et al., Citation2010). The aerosol LUTs are based on ~ 80 aerosol models that are derived from AERONET climatology and are parameterised by relative humidity (8 categories) and fine-mode fraction (10 categories) (Ahmad et al., Citation2010). These aerosol models contrast with what is used in the MODIS aerosol retrieval algorithm over the ocean (Remer et al., Citation2005) that consists of four fine-mode aerosols and five coarse-mode aerosols, but disregard the impact of relative humidity and treat the fine-mode AOD as a retrieval parameter. The difference in the aerosol models may in part contribute to the difference of AOD retrieved from the Ocean Color algorithm as well as those from the aerosol algorithm over the ocean. Nevertheless, to assure accurate Rrs retrievals, data are not processed in the Ocean Color algorithm if the retrieved AOD at 869 nm is > 0.3. Recent analysis shows that Rrs over the coastal region has a systematic negative bias of 2–3% (in comparison with in situ data) except at 667 nm where the bias is ~−25% (Goyensa et al., Citation2013). Similar to Mi et al. (Citation2007) and Li et al. (Citation2007), future studies for further evaluation of Rrs can also be made through atmospheric correction by using AERONET-measured AOD and aerosol single scattering properties.
2.4. MODIS-AERONET collocation and coastal site classification
The spatially and temporally collocated MODIS and AERONET data pairs spanning the years 2002–2011 for the full record of MODIS/Aqua are acquired through the Multi-Sensor Aerosol Products Sampling System (MAPSS, http://giovanni.gsfc.nasa.gov/mapss/) (Ichoku et al., Citation2002; Petrenko et al., Citation2012). Two methods of MODIS-AERONET comparison from MAPSS collocations are available for use in this study. The first is the mean method in which AERONET measurements within ±30 minutes of the MODIS overpass time are averaged and compared against MODIS AOD retrievals averaged within a 55-km diameter circular region centred over the AERONET sites, with the possibility of data filtering based on the mode of the quality flags associated with the AOD retrievals (Ichoku et al., Citation2002; Petrenko et al., Citation2012). The second is the central method in which the MODIS AOD retrieval closest to the AERONET site is paired with the AERONET measurement that is closest to the MODIS overpass time. A recent study by Petrenko et al. (Citation2012) shows little difference between the central and mean methods in terms of their comparison statistics (such as correlation) with AERONET AOD. Therefore, to be consistent with previous research and also to increase data samples in the evaluation, the mean method is used for the remainder of this research.
Over the approximately 9-yr (2002–2011) record of Aqua-MODIS and AERONET AOD pairs, ~26% of the AERONET stations are found to have MODIS retrievals from both the Dark Ocean and Dark Land algorithms (which is consistent with Ichoku et al., Citation2002), and consequently those sites are designated as coastal. However, only sites that have at least 15 high quality (QA flag 3 for Land and flags 1, 2 or 3 for Ocean) out of a maximum of 25 possible MODIS AOD retrievals in a MAPSS sampling region, from both the Dark Land and Dark Ocean algorithms, during collocated AERONET AOD measurements are incorporated into this analysis. Coastal sites range from approximately 13-km offshore (Venice AERONET site) to 15-km inland (Lecce_University AERONET site). All other AERONET sites are designated as non-coastal, being either Land only or Ocean only.
3. Overall performance of MODIS AOD in coastal vs. non-coastal regions
The MODIS-AERONET AOD pairs are examined on a global scale and split into three categories. The first includes all AERONET sites (global), the second consists of only coastal AERONET sites (coastal) and the third is made up of only non-coastal sites (non-coastal). We use multiple metrics to statistically evaluate the MODIS AOD uncertainty with respect to AOD measured by AERONET.
3.1. Metrics for comparing MODIS and AERONET AOD
The first type of metric is a combination of parameters that are commonly used to describe the relationship between two variables including: bias, mean, standard deviation, correlation, statistical significance, and best-fit [ordinary-least-square (OLS)] regressions. MODIS AOD bias is calculated by subtracting AERONET AOD from the paired MODIS AOD (respectively for Land, Ocean and Land_And_Ocean dataset). The mean bias is calculated by averaging the bias at each AERONET site for the full study period of 2002–2011. Furthermore, the correlation, variance and root mean square difference (RMSD) between MODIS AOD and AERONET AOD are combined to generate the well-known Taylor Diagram to aid the visualisation of the differences found in the comparison. The Taylor Diagram uses a 2D polar plot to demonstrate three pieces of information that are interconnected, in which radius represents normalised standard deviations, polar angle represents correlation coefficient (R) and the radius of the circles centred on point ‘REF’ (i.e., radius of 1) along the x-axis indicates normalised RMSD. As will be shown in the next section, the Taylor Diagram is particularly useful for visualising the error characteristics of each of the MODIS aerosol algorithms over varying surface types.
While the first type of metric is useful, it is primarily based upon OLS regression that is presented here to be consistent with previous research. However, OLS may not be the most appropriate technique for evaluating MODIS uncertainty with respect to AERONET, and the statistics from it may not be sufficient to fully describe the goodness of fit between two data sets, especially when the population in the datasets are not normally distributed (Wilks, Citation2011). The AOD frequencies over coastal sites (and non-coastal sites, not shown) are not normally distributed () and are indeed log-normal (), which is consistent with previous studies (O'Neill et al., Citation2000). Two parameters, µ and σ, representing the mean and standard deviation of the logarithm of AODs, respectively, are identified and shown in to fully describe a log-normal PDF. The actual frequency for AOD values between τ and τ+Δτ can be obtained by integrating the PDF over the range τ to τ+Δτ, and then multiplying the integral by the total number of sample data points. Note that approximately 400 MODIS AOD retrievals (out of 46 548 retrievals paired with AERONET over the coastal regions) are found to have negative AOD values; those retrievals are not physical and are excluded in the fit of a log-normal distribution, but are included in other analyses (for bias, correlation, standard deviation and RMSD) as recommend in Remer et al. (Citation2005). Using a χ2 test we find that the log-normal PDFs fit each AOD distribution at a statistically significant level (). Because of the log-normal PDF of AODs, the high correlation and/or small bias, even at the statistically significant level, does not necessarily warrant that the fit between the PDF of AERONET and MODIS AODs is statistically significant.
Fig. 1 Frequency (left vertical axis) and PDFs (right vertical axis) of coastal AODs in 2002–2011. Plots are derived from AODs at 62 coastal AERONET sites and collocated MODIS retrievals over those sites. µ is the log-normal location parameter and σ is the log-normal scale parameter, and the mean is the average AOD over the whole time period. The subplots show the frequency of quality-filtered (A) AERONET AODs, (B) MODIS Land_And_Ocean AODs, (C) AERONET AODs only where a paired MODIS AOD from the Dark Land algorithm exists, (D) MODIS AOD from Dark Land algorithm, (E) AERONET AODs only where a paired MODIS AOD from the Dark Ocean algorithm exists and (F) MODIS AODs from Dark Ocean algorithm.
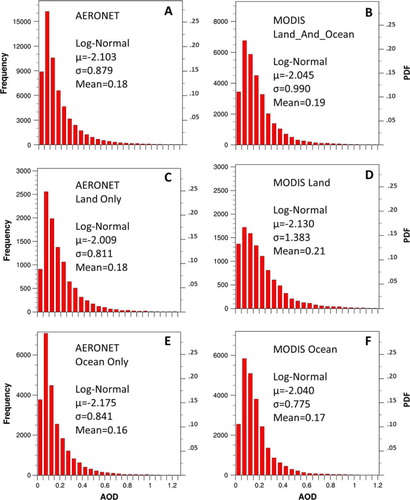
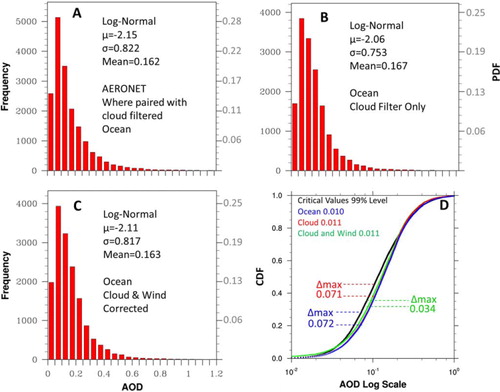
Fig. 2 Frequency (left vertical axis) and PDFs (right vertical axis) of the coastal AODs from (A) AERONET, (B) MODIS Land_And_Ocean, (C) MODIS Dark Ocean algorithm and (D) MODIS Dark Land algorithm. All MODIS AODs were filtered with quality flag for the span of 2002–2011. The p-values indicate statistical significance of fit between frequency distributions derived from the lognormal PDFs (with corresponding parameters shown in ) and actual frequency distribution (e.g. the bars in red). See text for details. (A) Shows only those AERONET AODs, that correspond to valid MODIS AOD retrievals.
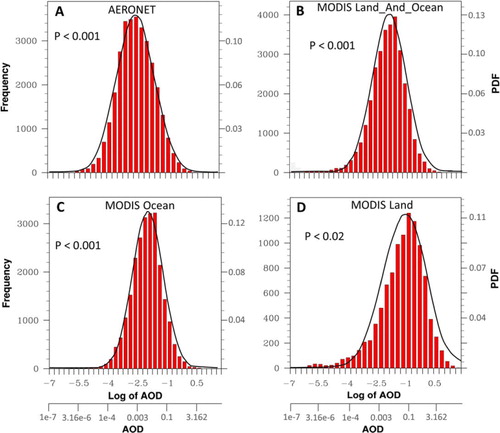
To determine whether the (log-normal) PDFs of MODIS AOD data fit with that of the AERONET measurements at a statistically significant level, a second type of statistic metrics is used that consists of a t-test for difference of mean for paired data, a likelihood ratio test and a Kolmogorov–Smirnov (K–S) test. In the t test for difference of mean for paired data, statistical significance is then applied to
where is the mean bias, µ
Δ is the difference between the means for each variable (e.g. MODIS AOD or AERONET AOD) and
is the sample variance of the bias for a total of n pairs (Wilks, Citation2011). The p-value (less than 0.01) indicates at which statistically significant level (99%) the null hypothesis is not true, or the difference between means for the paired data is significant.
A likelihood ratio test is a parametric test to determine the likelihood that the MODIS AODs could have been drawn from the same log-normal distribution as the AERONET AODs. To perform this test, it is necessary to fit log-normal distributions separately to each MODIS algorithm and AERONET, and compare these two distributions with the single log-normal distribution fit using both sets of data (Wilks, Citation2011). The general form of the likelihood test statistics is
where and
are the likelihood functions and L is the log-likelihood. For our case, the test statistic is equal to
where the PDFs are a function of µ, σ and τ. The parameters µ and σ for each PDF are derived from the analysis in Section 3 (). Since there are four parameters used to estimate the individual AERONET and MODIS distributions and two for the null hypothesis that MODIS and AERONET AOD data are from the same PDF (PDFMODIS
and
AERONET), is evaluated with the χ2 table for degrees of freedom (of v=2).
Since the likelihood test only evaluates the goodness of fit among log-normal PDFs that themselves are an approximation of the actual PDF, the K–S test is used to further compare the cumulative distribution functions (CDFs) of each of the MODIS algorithms to that of AERONET. The test statistic is represented by the maximum difference between the MODIS and AERONET CDFs:
When D is greater than the critical value, , the null hypothesis (the two CDFs show a good fit) is rejected at the 99% confidence level. By analysing the fit between the MODIS and AERONET PDFs and CDFs, our evaluation goes beyond the bias and correlation tests that have been used commonly in the past to evaluate MODIS AOD uncertainty, and hence, provides a more robust statistical assessment and a more complete description of the uncertainties in MODIS AOD retrievals.
3.2. Coastal vs. non-coastal MODIS AOD evaluation
As mentioned in Section 2, the Land_And_Ocean AOD dataset does not have its own QA, and is therefore, filtered in this study using the MODIS science team's recommendations that retrievals originating from the Dark Land algorithm have a flag equal to 3 and those originating from the Dark Ocean algorithm have a flag greater than 0. This QA filtering is similar to what is used for the Land_And_Ocean AOD dataset. Note that the mean AOD calculated from the Land_And_Ocean dataset may not be equal to the mean AOD calculated from the separate Land or Ocean datasets because the mean of the Land_And_Ocean dataset, within the 55-km region around AERONET, may include MODIS pixels originating from either (or both) the Dark Ocean and Dark Land algorithms.
After quality flag filtering, MODIS AODs are highly correlated with the paired AODs from AERONET with R 2 greater than 0.8 regardless of whether AODs are retrieved over costal or non-coastal region (respectively shown in top and bottom row in , ). The high correlations found here are consistent with those found by Levy et al. (Citation2010). R 2 for the Ocean AOD, Land AOD and Land_And_Ocean AOD dataset are also greater than 0.8 (respectively shown in three columns in , ). MODIS AOD retrievals from the Ocean algorithm on a global scale have R 2 of 0.81 that is less than the R 2 of 0.85 for non-coastal open-ocean sites, but similar to the R 2 of 0.80 for coastal sites (). In contrast, shows that little change in correlation with AERONET AOD is found for AODs from the MODIS Dark Land algorithms over the coastal (R 2 of 0.795), non-coastal (R 2 of 0.795) and global evaluations (R 2 of 0.793). This contrast suggests room for improvement in the Dark Ocean algorithm over coastal regions, which is further supported by the fact that the linear regression interception found for the Dark Ocean algorithm is positive over coastal sites at 0.034, an order of magnitude larger than the counterpart for non-coastal sites at −0.001 (). However, consistent with past analyses (Kahn et al., Citation2005, 2007, 2011; Remer et al., Citation2005; Levy et al., Citation2007, Citation2010; Mi et al., Citation2007 and others), the Ocean AOD correlations are greater than the Land AOD correlation in all (coastal, non-coastal and global) categories ().
Fig. 3 Scatter plot of AERONET AOD (x-axis) and the quality flag filtered MODIS AOD (y-axis) for 2002–2011. In (A), (B) and (C), AODs in y-axis are respectively derived from MODIS Land_And_Ocean, Land and Ocean products over the non-coastal AERONET stations. (D), (E) and (F) are respectively the same as (A), (B) and (C) but over the coastal AERONET stations. In each scatter plot, also shown is the coefficient of determination (R 2), mean bias, the number of MODIS-AERONET collocated data points (N), the density of points (color bar), the best-fit linear regression equation (solid black line), the 1:1 line (dashed black line), and the expected error (EE) envelope (red dashed line) for MODIS AOD explained in Section 3.2.
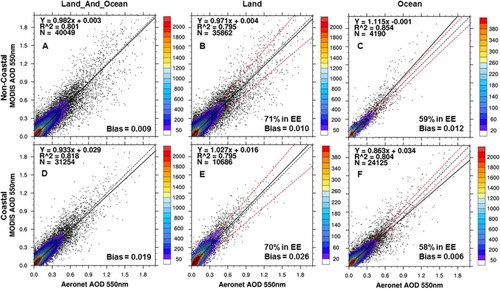
Table 1. Regression statistics for the MODIS AOD products with respect to AERONET
also shows that the AODs over coastal and non-coastal regions retrieved from the Dark Land algorithm both fall within the expected uncertainty envelope greater than 66% of the time (b and e), but the counterparts from the Dark Ocean algorithm only fall within the EE envelope ~58% of time, which is lower than 66% that is revealed from past studies of MODIS collection 4 that do not separate the AERONET-MODIS AOD comparisons into coastal and non-coastal regions (Remer et al., Citation2005). Nevertheless, since the uncertainty envelope for the Dark Ocean algorithm is smaller than that for Dark Land algorithm, its bias is still smaller in magnitude than the Dark Land algorithm ().
While a small bias (often < 0.03, ) of AOD overall is consistent with past research (Remer et al., Citation2005; Levy et al., Citation2010), for the same type of dataset (e.g. from Dark Ocean algorithm, Dark Land algorithm and combined Land_And_Ocean), a larger bias of AOD is apparent over the coastal regions than over non-coastal regions (d–f). It is noted that for AOD from the Dark Ocean algorithm, the overall bias (0.012) along the coast is larger than the counterparts (0.006) over the open ocean (f vs. 3c). However, this does not reflect the two counteracting errors over the coast, where AOD retrievals that are larger than 0.25 are actually being underestimated, on average, by 0.029, and AOD retrievals smaller than 0.25 are overestimated, on average, by 0.021 (). Using a t test for difference we find that regardless of the MODIS product (i.e. Ocean, Land, Land_And_Ocean), the AOD bias over coastal regions is statistically significant with a p-value much less than 0.01.
Table 2. MODIS AOD mean bias for all AERONET coastal stations
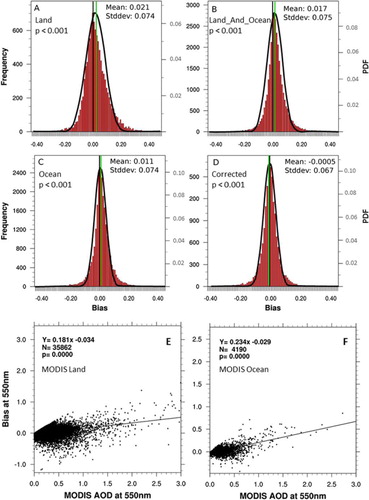
It is also interesting to find that the PDF of bias for all of the datasets (Dark Ocean algorithm, Dark Land algorithm and Land_And_Ocean) show the normal distribution (). The contrast between the log-normal PDF of AOD and the normal PDF of AOD bias suggests that the actual bias of MODIS instantaneous AOD is not a simple linear function of AOD (i.e. with a constant slope) as indicated in the EE envelope. The relationship between AOD bias and AOD should be non-linear because: (a) moderately large AOD sometimes have large signal and result in less uncertainty in the retrieval and (b) many other factors (other than AOD), such as viewing geometry and boundary conditions, can complicate the retrieval uncertainty.
Fig. 4 Frequency (left y-axis) and PDFs (right y-axis) of MODIS AOD biases from the (A) Dark Land algorithm, (B) Land_And_Ocean dataset, (C) Dark Ocean algorithm and (D) the corrected Dark Ocean algorithm. The pictured data are for all coastal AERONET sites in 2002–2011. The thin black and green lines respectively show zero bias and mean bias for each panel. (E) Regression of bias at 550 nm in MODIS AOD at 550 nm for Dark Land and (F) for Dark Ocean.
In order to gain insight into the locality of the bias, a plot of bias at different coastal stations is shown in . AODs retrieved from the Dark Land algorithm are shown to have a significantly larger bias than the AODs from the Dark Ocean algorithm for most of the coastal AERONET sites. This is expected because of the inherent difficulties in characterising land surfaces in general. The average MODIS AOD bias for the Dark Land algorithm over coastal sites is 0.026 at the statistically significant level (p<0.01) and shows little dependence on AOD amount (). However, the bias does show large variation amongst different coastal AERONET sites (), likely reflecting the high variation of surface characteristics along the global coast. In addition, the aerosol single scattering properties or aerosol models used in the MODIS algorithm can be a source of uncertainty. However, independent evaluation of such uncertainty sources is challenging because these aerosol models are based upon AERONET climatology, and the detailed in situ data of aerosol properties over the AERONET site are lacking (Li et al., Citation2009).
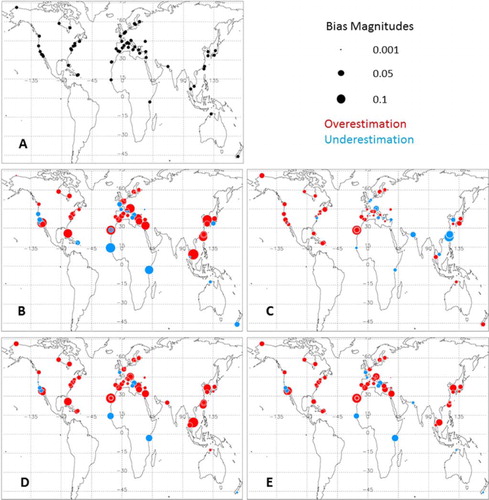
Fig. 5 (A) Map of the location of all 62 coastal AERONET sites analysed in the study. Also shown are the maps of MODIS AOD bias (with respect to AERONET AOD) at each of these coastal sites respectively for: (B) MODIS Land AODs dataset filtered with quality flag, (C) MODIS Ocean AODs dataset filtered with quality flag; (D) MODIS Land_And_Ocean AODs without any quality filtering; (E) MODIS Land_And_Ocean AODs after using the quality filtering method described in Section 4. Bias calculations are based on ~9 years (2002–2011) of collocated MODIS and AERONET AOD data. Blue indicates an underestimation (e.g. negative bias) in MODIS AOD and red indicates overestimation (positive bias). Common legend for (B)–(E) is shown on the left of (A).
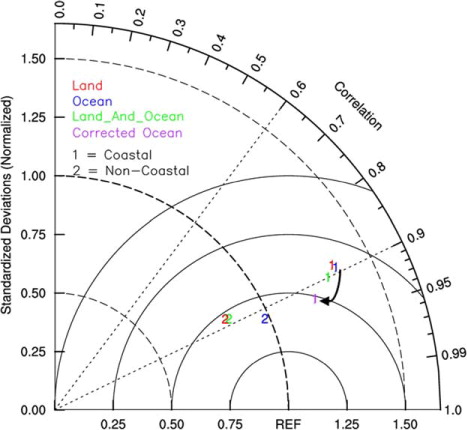
The Taylor Diagram () visualises the overall performance of different sets of MODIS AOD data in a single figure. The MODIS-AERONET AOD correlation coefficient (R) visibly decreases for coastal retrievals compared to non-coastal retrievals, especially from the Dark Ocean algorithm (). Furthermore, the normalised standard deviations of MODIS AOD increase from ~0.8 for non-coastal retrievals to 1.3 for coastal retrievals (), indicating that MODIS AOD is less capable of capturing the temporal variation of AERONET AOD over the coastal sites. By the same token, also demonstrates that the Dark Ocean algorithm over the open ocean (non-coastal) captures the variation in AOD better than the other algorithms, because its resultant representation in the Taylor diagram is the closest point to ‘REF’ and, thus, has the best performance with respect to AERONET. It is shown that all of the MODIS AOD retrievals over the coast, regardless of algorithm, cluster farthest away from the ‘REF’ point, indicating a need for refinement of the MODIS product over coastal regions ().
Fig. 6 Taylor diagram comparing ~2002–2011 quality-flag-filtered MODIS AOD retrievals and AERONET AOD observations. Coastal MODIS AOD retrievals are listed with a 1 and Non-Coastal AODs are shown with a 2. The MODIS Ocean, Land, Land_And_Ocean and empirically corrected Ocean (Section 5) AODs are represented by blue, red, green and purple, respectively. The arrow represents the effect of the empirical correction on the MODIS Ocean dataset.
To further determine how well the MODIS aerosol products represent the climatology observed from AERONET, the PDFs from the MODIS products are compared against the PDF from AERONET. The likelihood test returns a test statistic ϕ as described in Section 3.1. The test statistic is compared to a critical value to determine the likelihood that the MODIS AOD PDF fits the PDF from AERONET AOD. The critical value for the χ2 statistics with v=2 degrees of freedom at the 99% confidence level is 9.210, where anything greater than this value results in rejection of the null hypothesis that the PDFs may come from the same distribution. We find that the test statistics are 23.03, 29.77 and 22.98 for the quality-filtered MODIS Dark Land, Dark Ocean and Land_And_Ocean datasets, respectively. Hence, the PDFs from the MODIS algorithms statistically differ from the PDFs of AERONET AOD over coastal regions. This finding suggests that from a mathematical point of view, MODIS AOD statistics may not fully represent the nature of AOD climatology described by AERONET, although the implications of such finding to the real applications in climate studies depend on how much uncertainty these applications can tolerate. The likelihood test is useful to compare PDFs that are parameterised to fit observation data, but not the actual histogram of MODIS AOD. To more fully describe the fit between MODIS and AERONET data, our analysis is extended to actual CDFs as well.
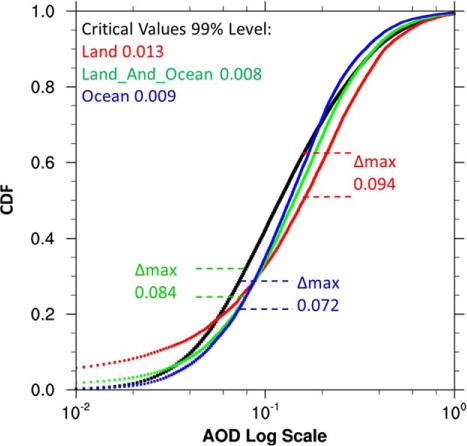
displays the results of the K–S test and maximum difference for the CDFs from each quality-filtered MODIS algorithm with respect to the CDF from AERONET. The critical values (described in Section 3.1) needed to verify that the MODIS Dark Land, Dark Ocean and Land_And_Ocean AOD CDFs fit the counterpart of the AERONET AOD, at the 99% confidence level, are 0.013, 0.009 and 0.008, respectively (). It is clear in that the maximum departures of the CDFs from each of the MODIS AOD products and AERONET AOD observations are greater than the corresponding critical values. Hence, the null hypothesis (i.e., CDFs from MODIS AODs and AERONET AODs are drawn from the same data population) must be rejected and the CDFs from each of the MODIS algorithms differ from the AERONET CDF at the 99% confidence level. This finding only strengthens the conclusion from the previous tests that MODIS AOD PDFs statistically differ from their AERONET counterparts, although it should be reiterated that the implications of such findings for real applications depend on how much uncertainty these applications can tolerate.
Fig. 7 Cumulative distribution functions (CDF) of AOD derived from AERONET (black), and corresponding paired MODIS AODs derived respectively from MODIS Land (red), Ocean (blue) and Land_And_Ocean (green) AODs after filtering with quality flag. Maximum differences (Δmax) between the AERONET CDF and MODIS CDFs are shown by the two dashed horizontal lines and their values are denoted by the labels in their respective colors. Statistics are based upon MODIS aerosol observations in 2002–2011 over the coastal regions. Critical values for the K–S test are also denoted in the top left of the figure and are described in the text (Section 3.1).
3.3. Impact of QA filtering on Land_And_Ocean AOD
For completeness, the effect of QA filtering on the analysis is presented here. The filtering criteria recommended by the MODIS team improves the global MODIS Land_And_Ocean correlation (R 2) with AERONET from 0.74 to 0.80 () and reduces the AOD bias by 34% for coastal regions from 0.029 to 0.019 (). Focusing on the high AOD events (AOD > 0.25) over the coast, the bias is reduced even more (by 62%) from 0.026 to 0.010 (). However, as a result of the filtering, the number of MODIS-AERONET AOD pairs is reduced from 113 152 to 71 303 globally (or by 37%). The quality-filtered Land_And_Ocean dataset has a regression equation of τ M=0.964τ A+0.014 on a global scale over the full record of MODIS () and τ M=0.933τ A+0.028 over coastal regions (). The reduction in bias from the quality filtering can be further observed in d vs. 5e, and an increase in correlation is found on a global scale. However, as discussed in the previous section, even after the quality flag filter, the coastal regions still show poorer MODIS performance compared to the non-coastal retrievals. The result suggests that a dedicated algorithm for coastal retrievals may be needed in lieu of the current Dark Land and Dark Ocean algorithms used for the MODIS aerosol retrievals. It is noted that with the release of MODIS Collection 6, the Optical_Depth_Land_And_Ocean data will be created by applying the same QA filtering technique as used in this study (as also recommended by the MODIS aerosol science team) rather than the current removal of AOD retrievals with zero flag in Collection 5.1.
4. Wind, cloud and water-leaving radiance impacts on MYD04 Dark Ocean algorithm
Different sources of errors may impact the MODIS Ocean retrievals, particularly the surface characteristic assumptions made by the algorithm, and the uncertainty in the cloud-mask algorithm designed specifically for the MODIS Ocean product that classifies a pixel as cloud free. We separately examine the impact of the sources of errors on the MODIS performance over the coastal regions. We expand the cloud contamination and near-surface wind speed analysis that was conducted by Shi et al. (Citation2011), who examined primarily the global oceans, to focus on coastal retrievals and to analyze the impact of water-leaving radiance contributed by the pigments and suspended particulate matter in coastal water on the MODIS AOD retrieval.
4.1. Cloud impact
Using the AEROENT AOD that is spatially paired with MODIS AOD at the pixel level (e.g., the central method in MAPSS), past studies showed the impact of cloud contamination in the MODIS AOD retrievals over the ocean (Zhang and Reid, Citation2006; Shi et al., Citation2011). A similar investigation is conducted here for the MODIS Collection 5.1 product, with a focus on coastal AERONET stations and analysing the statistics based upon the AERONET-MODIS paired AODs and the mean cloud fraction that are, in turn, created with the mean method from MAPSS based on the Cloud_Fraction_Ocean dataset available in the MODIS aerosol products.
The Cloud_Fraction_Ocean is a diagnostic dataset that is generated as a by-product of the MODIS Dark Ocean aerosol retrieval algorithms; this dataset indicates the fraction of cloudy sub-pixels in the complete set of 400 sub-pixels at 500-m resolution used to retrieve a single 10-km AOD pixel. To determine such cloudy sub-pixels, the MODIS Dark Ocean algorithm inspects the brightness of each sub-pixel in relation to the brightness of its eight neighboring sub-pixels; the pixel is labeled as cloudy if the standard deviation in this group of 9 sub-pixels exceeds 0.0025 (Remer et al., Citation2005). Such spatial variability test helps to identify clouds that usually appear ‘bumpy’ as opposed to aerosol plumes that tend to appear ‘smooth’. Still, additional spectral and brightness tests are carried out to identify (a) dust plumes that may also appear ‘bumpy’ and could be possibly misidentified as clouds and (b) thin cirrus clouds that may appear smooth and be mistaken for aerosol plumes. Finally, a group of tests is performed to identify sediments and sun glint. It should be noted that unlike in MODIS Collection 4, cloud fraction in MODIS Collection 5.1 does not include pixels identified as dust, cirrus, sediment, internal water or sunglint. While the MODIS team deems this dataset experimental and emphasises that it does not always represent the actual cloud fraction, this ancillary information is an integral part of the retrieval algorithm, which ultimately affect the product uncertainty.
In this study, multiple thresholds (80%, 70% and standard QA flag) for cloud fraction above which the AOD will be considered to have large error and should be filtered out in the analysis, are tested, and the corresponding results are given in . The analysis reveals that the 70% threshold can greatly reduce bias while only reducing the number of retrievals by 16% globally and 14% over coastal regions (). For the cloud fraction threshold of 70% (80%), the reduction of bias for coastal sites is 100% (67%), and for non-coastal sites it is 58% (33%) ().
Table 3. MODIS AOD bias with respect to AERONET AOD for both coastal and open-ocean sites
While shows consistent results with Zhang and Reid (Citation2006) and Shi et al. (Citation2011) that the removal of MODIS over-ocean AODs associated with a cloud fraction larger than a threshold of 80% can significantly reduce the bias in AOD estimates, a more detailed examination also shows that the cloud fraction filter leads to an even more negative bias for AODs over 0.25 and reduces the positive bias for AOD less than 0.25 (). Zhang and Reid (Citation2006, Citation2010) demonstrate that the cloud contamination causes MODIS overestimation due to the high reflectivity of clouds in the visible spectrum, and therefore, filtering AOD retrievals by cloud fraction would lead to an overall decrease in MODIS AOD. The same physical interpretation is true for MODIS Collection 5.1; however, the negative bias persistence for AOD over 0.25 requires another explanation. A possible cause of the more negative bias (AOD > 0.25) after cloud filtering () is that cloud contamination has a greater influence, proportionally, on lower AOD retrievals than on higher AODs (Kleidman et al., Citation2012). Thus, the cloud-contamination filter removes some of the high AOD events that are minimally impacted by high cloud fractions, and may skew the results to a more negative bias. This impact needs to be evaluated in future studies.
4.2. Wind speed impact
In addition to cloud contamination, past studies also showed a systematic increase of MODIS error as a function of wind speed for retrievals over the open ocean. This dependence is most apparent when wind speed deviates from the 6 ms−1 speed assumed for the rough ocean surface and white cap parameterisations within the MODIS Dark Ocean algorithm (Zhang and Reid, Citation2010; Shi et al., Citation2011; Kleidman et al., Citation2012). Previous work on wind climatologies suggests that surface wind speeds over coastal regions are frequently slower than 6 ms−1 (Martín et al., Citation1999; Lavagnini et al., Citation2005). To quantify the impact of the surface wind speed on coastal aerosol retrievals, we stratify the analysis of MODIS-AERONET biases (before and after cloud-contamination filtering) as a function of ocean-surface wind speed. At every coastal AERONET site, each MODIS AOD bias is paired spatially and temporally with the corresponding horizontal wind speed from 2 meters above the surface that is taken from the MERRA re-analysis.
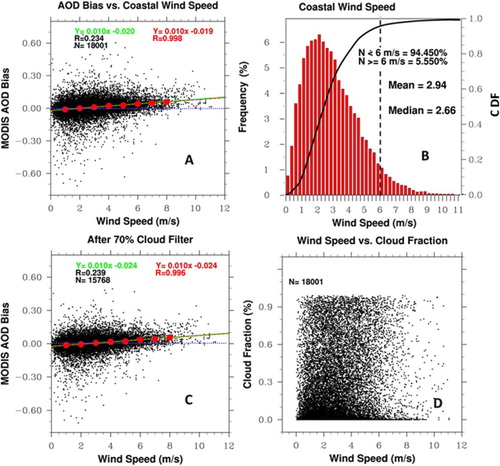
Shown in is a linear best fit of τ bias=0.010v−0.020 before cloud filtering, where τ bias is the MODIS AOD bias and v is the wind speed. The positive correlation between bias and wind speed is consistent with the previous work (Zhang and Reid, Citation2010; Shi et al., Citation2011; Kleidman et al., Citation2012) and can be quantitatively understood from the following two factors: (a) wind speeds over coastal regions are frequently (94% of the time) less than 6 ms−1 at MODIS overpass time (b) and (b) slower wind speeds lead to more negative MODIS bias, while faster wind speeds lead to positive bias (a). While factor (a) explains, in part, the negative bias for the AOD (greater than 0.25) retrieved from the Dark Ocean algorithm, factor (b) can be used to interpret the overestimation in MODIS AOD for AOD less than 0.25 over the coast. High AOD near the coast may occur during high wind conditions that can generate more sea salt particles or may be associated with a frontal passage moving aerosols; in either case, such high winds can lead to error in MODIS AOD retrievals. This effect on MODIS retrievals needs be studied further before any concrete conclusions are drawn. However, with the known impact of cloud contamination, we conducted a similar analysis after filtering out the MODIS AOD retrievals with cloud fractions greater than 70%, and found that τ bias=0.010v−0.024 (c).
Fig. 8 (A) Scatter plot of horizontal wind speeds that are 2 meters above the surface from MERRA (x-axis) and the biases in the quality-flag-filtered AODs. (B) The frequency (left y-axis) and CDF (right y-axis) of coastal wind speeds during MODIS overpass times. (C): same as (A) but for the bias of MODIS AOD after 70% cloud fraction filter. (D) Scatter plot of the wind speed and cloud fraction pairs for each AOD retrieval from MODIS Dark Ocean algorithm. The analysis is for all coastal sites (62 AERONET sites) and for the years ~2002–2011. R is the Pearson linear correlation coefficient (R), N is the number of retrievals and Y is the regression equation. In (A) and (C), red dots show the MODIS biases binned to 1 ms−1 intervals, and their corresponding regression lines and correlation coefficient are denoted in red as well; the blue dotted line is a reference of zero bias.
Geographically, a statistically significant correlation between MODIS AOD bias and wind speed is found at 46 out of the total of 62 coastal AERONET sites (a). From those statistically significant sites, 40 are found to have a negative MODIS bias as the wind speed approaches 0 (c) and 45 are found to have a regression with a positive slope that indicates a systematic positive bias in MODIS AOD as wind speeds increase (d). However, those 16 AERONET sites that do not show a statistically significant correlation between MODIS bias and wind speed have two main characteristics in common: (a) the MODIS AOD correlation with AERONET AOD is less than the average correlation for the coastal group; (b) all of the AERONET sites are close to the coastline (i.e. within 5 km) except Bac_Lieu which is ~8.5 km from the coastline. Characteristic (a) suggests that the retrieval errors at these sites are not systematic, and characteristic (b) indicates that the rough ocean-surface model may not be appropriate to estimate the surface reflectance in the first place, which is supported by the analysis in the following section.
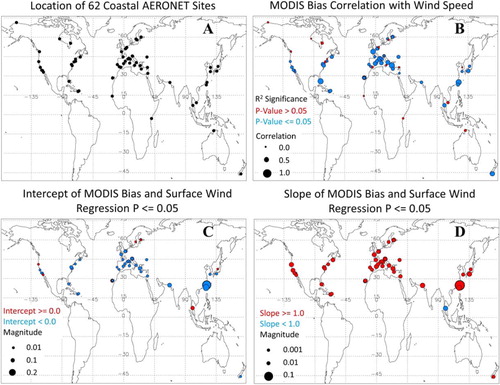
Fig. 9 (A) Location of each coastal AERONET site, (B) the correlation between sea-surface wind speed and the biases in quality-flag-filtered AODs from MODIS Dark Ocean algorithm, (C) and (D) the y-intercept and slope in the linear regression equation between the MODIS AOD bias and wind speed. Blue color represents statistically significant values in (B) and negative intercepts and slopes in (C) and (D), respectively. Red represents statistically insignificant values in (B) and positive intercepts and slopes in (C) and (D). Magnitude scales are shown by size of the circles, and are provided in each panel for clarity. (C) and (D) show only sites with p-value ≤ 0.05 (46 out of the possible 62 sites). Results are for the date record of 2002–2011.
4.3. Bias correction for wind speed and clouds
Zhang and Reid (Citation2006) showed that empirical correction of wind and cloud effect can reduce the absolute bias in the MODIS AOD product. To further evaluate the empirical correction on the MODIS AOD uncertainty characteristics, we study the change of mean and PDF of MODIS AOD bias before and after the correction. Because the wind speed and cloud fraction are not correlated (d), a correction scheme that accounts for each factor independently is applied to MODIS QA-filtered AOD. By including the MERRA wind speed at approximately the time of each MODIS AOD retrieval, the MODIS AOD bias is estimated from regression equation, τ bias=0.010v–0.024 found in Section 4.2 (after filtering AODs with 70% or more cloud fraction) and is subsequently subtracted from the corresponding AOD to create an empirically corrected AOD.
A reduction in the overall MODIS AOD bias for the Dark Ocean algorithm over the coast is found, with a change of mean bias from +0.011 for the standard quality-flag-filtered MODIS product to −0.0005 for the cloud- and wind-corrected AOD (). Furthermore, for AOD events less than 0.25, the bias is reduced from +0.021 to +0.0098, and for AOD events greater than 0.25 the bias is reduced from −0.029 to −0.027 (). In addition, the empirical correction reduces spread (or geometric standard deviation) of bias in the Land_And_Ocean dataset from 0.074 to 0.067 (d). As a result of reducing the mean and spread of the bias by the empirical corrections, it is evident in the Taylor diagram that the empirical corrections improve the MODIS AOD correlation with AERONET and reduce the variance in observation, indicating that the temporal variation of AERONET AOD is better captured by the corrected product. Furthermore, after both cloud and wind correction, the MODIS frequency shows a better fit to the AERONET distribution than the standard MODIS Ocean product (). Although the corrected MODIS AOD CDF does not pass the K–S test with a maximum difference of 0.024 and a critical value of 0.011, at the 99% confidence level, the correction does show an improvement by reducing the maximum difference between the AERONET CDF and the standard MODIS product ().
Fig. 10 Frequency distribution of quality assured (A) AERONET AOD over coastal regions that have an MODIS Dark Ocean algorithm collocated retrieval, (B) AOD from MODIS Dark Ocean algorithm after cloud fraction and quality flag filtering only, (C) AOD from MODIS Dark Ocean algorithm after cloud fraction filtering (70%), wind speed bias correction and quality flag filtering. (D): same as except the cumulative distribution function (CDF) is derived from the frequency distributions, respectively, in (A)–(C) and c, and shown correspondingly as black, red and blue color, respectively.
It is noted that in the above correction of the AOD retrieval errors due to the sea-surface wind speed, the possible enhancement of whitecaps near coastal lines due to wave breaking is not considered. Although wind may blow off the top of the near-shore wave breaking to form whitecaps, there is no evidence that for the same wind speed whitecap occurrence is a function of distance from the shore (Kenneth Voss, University of Miami, personal communication). This is because wind interacts more with the shorter scale waves or roughness, which is only slightly influenced by the bottom of the ocean. The wind data used in this study is about 1°×1° resolution that does not resolve small-scale changes in winds (Remer et al., Citation2005). Furthermore, by evaluating the MODIS AOD at 50 km×50 km resolution, the effect of the coastal enhancement of whitecaps can be minimised, and at this resolution the production of whitecaps, on the first order, is regulated by the sea-surface wind speed.
4.4. Impact of sediments on the residual bias
Finally, the effectiveness of using a rough ocean-surface model (designed for open ocean or case 1 water) to model the surface reflectance at the coastal (case 2) water is evaluated. In the MODIS Dark Ocean algorithm, a sediment masking procedure is applied before the retrieval is conducted. This procedure computes the expected TOA reflectance at 550 nm based upon a power law fit from the TOA reflectances at 470, 1200, 1600, 2100 nm wavelengths, and any pixel with measured TOA reflectance at 550 nm larger than the expected counterpart by 0.01 is flagged as sediment-dominant pixel and is not included in the retrieval (Li et al., Citation2003). Furthermore, the MODIS Dark Ocean algorithm assumes that water-leaving radiance contributed by the pigments is 0.005 at 550 nm and 0.0 at all other wavelengths (Remer et al., Citation2005).
Apparently, similar to any threshold-based method (such as for cloud screening), the fixed thresholds used in the sediment mask may result in retrieval biases. Miller and McKee (Citation2004) found that the total suspended matter in the coastal waters is linearly and positively proportional to and hence can be derived from the MODIS (band 1) TOA reflectance at 645 nm. Similarly, Hu et al. (Citation2004) found high correlation between surface reflectance at 645 nm and water turbidity in a turbid estuary. Consequently, analysis is conducted to correlate MODIS Dark Ocean AOD basis (after the empirical correction in Section 4.3) with Rrs645 (), with the latter obtained from the NASA OBPG (http://oceancolor.gsfc.nasa.gov).
Fig. 11 Scatter plot of the bias for coastal MODIS AOD (retrieved by the Dark Ocean algorithm) as a function of the Rrs (Sr−1) at 645 nm. Also shown is the best linear fit equation, the statistical significance (p-value) of the fit and number of data points (N).
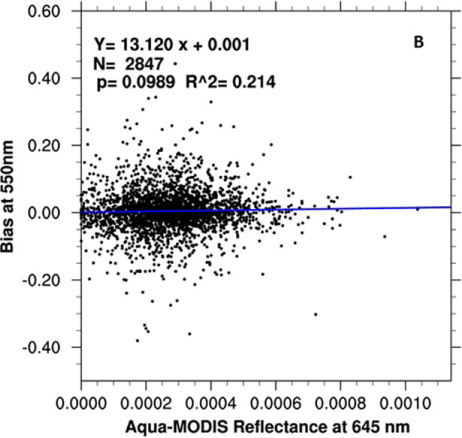
reveals a positive linear correlation between the MODIS AOD bias and Rrs645, but with nearly-zero (0.001) intercept. This can be explained by the fact that at 645 nm, increases in suspended matter lead to increases in Rrs645, and such increases can be falsely interpreted as aerosol contributions by the AOD retrieval algorithm, leading to an overestimation (positive bias) in the retrieved AOD. The zero intercept suggests that the MODIS retrieval algorithm with the assumption of zero water-leaving radiance works well for the open ocean. In addition to the positive bias, in coastal regions it is also possible that some sediment-rich pixels are missed by the sediment masking algorithm (Li et al., Citation2003). Admittedly, the analysis here is to indicate the possibility that MODIS AOD over the ocean can be affected by the mismatch between true ocean-surface reflectance and what is currently assumed for the AOD retrieval algorithms, and further studies including the use of realistic surface reflectance, from either field measurements or the MODIS OBPG processing, are highly needed.
5. The impact of empirical corrections on AOD trend analysis
Quantification of the uncertainty in the AOD trend analysis can be challenging because of the effect of time autocorrelation in the datasets, the effect from large anomalies of the general circulation (such as ENSO) and the aggregation of uncertainties in the instantaneous measurements in the temporal and spatial averages. While a thorough analysis of these issues is beyond the scope of this study, we demonstrate the importance of characterisation and correcting the bias in the instantaneous AOD for the trend analysis. Notably, Zhang and Reid (Citation2010) showed that correction of cloud and wind effect on AOD has little impact on the trend of global mean of AOD. Hence, our focus here will be on the AOD trend at AERONET stations; annual AOD trend is computed for each coastal AERONET station from the three datasets including AERONET AOD, MODIS QA-filtered AOD retrieved from the Dark Ocean algorithm (hereafter Ocean AOD), and MODIS QA-filtered empirically corrected AOD retrieved from the Dark Ocean algorithm (hereafter corrected Ocean AOD). Similar to our past study of surface wind trend (Holt and Wang, Citation2012), the trend computed here is based upon the OLS regression with correction of time autocorrelation. Only those stations that have a minimum of 4 yr of AERONET data are used in the trend analysis.
Overall, AERONET trends found in this study over the Eastern USA and Europe show a slightly decreasing AOD pattern around −0.005 AOD yr−1, which is comparable with Hsu et al. (Citation2012). Two AERONET sites (‘Dunkerque’ at 51.035N and 2.368W, ‘Karachi’ at 24.87N and 67.03E), whose AOD trends are representative of their corresponding regional AOD trend found in Hsu et al., (Citation2012) are chosen to demonstrate the differences in the trends computed for MODIS Ocean AOD and MODIS Ocean corrected AOD (). At Dunkerque, the annual AOD trends from AERONET, MODIS Dark Ocean algorithm and MODIS corrected are −0.005, −0.003 and −0.005, respectively. At Karachithe annual AOD trends from AERONET, MODIS Dark Ocean algorithm and MODIS corrected are −0.017, −0.007 and −0.016, respectively ().
Fig. 12 (A) Spatial distribution of the trend of annual AOD at different AERONET sites that have at least 6 yr of data during 2002–2010. Blue indicates negative AOD trends while red indicates positive AOD trends. The size of the circle is relatively proportional to the absolute value of the trend. (B) The relative difference (in%) between annual AOD trends computed with MODIS before and after the empirical correction, defined as the (∣Trend_modis_corrected − Trend_aeronet∣ − ∣Trend_modis − Trend_aeronet∣)/∣Trend_aeronet∣; negative value is shown in blue, and indicates that Trend_modis_corrected is closer to Trend_aeronet than Trend_modis; positive value is shown in red, and indicates that Trend_modis_corrected is further away from Trend_aeronet than Trend_modis. See Section 5 for details.
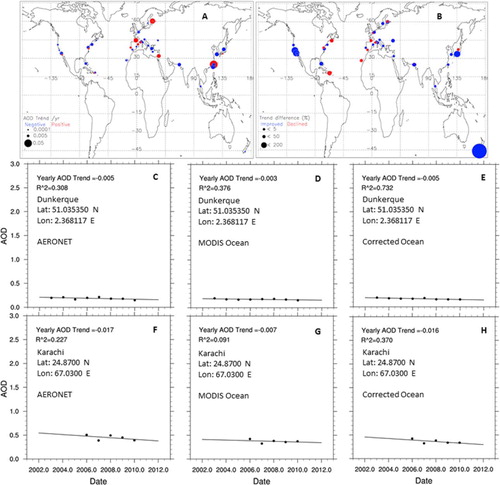
Geographically, it is evident that most of the MODIS-derived AOD trends fit more closely with their respective AERONET counterparts. This implies that either a sampling bias is present in the MODIS AOD observations over the coastal AERONET sites, or a trend in wind speed or cloud fraction may exist. It is beyond the objective and scope of this article to examine these aspects in great detail.
6. Conclusions and discussion
Aqua-MODIS AOD products retrieved during ~9 yr are evaluated using spatially and temporally collocated AERONET AOD data. Specific focus in the analysis is given to the coastal regions of the world due to their complex surface characteristics and their dominant contribution to the loading of anthropogenic aerosols in the atmosphere. Our findings can be summarised into the following points.
Over the coast, the MODIS dark surface aerosol algorithms show increased uncertainty with respect to non-coastal regions. After filtering by quality flags, the MODIS AODs retrieved by the Dark Land and Dark Ocean are highly correlated with AERONET (with R 2≈0.8), but only the Dark Land algorithm AODs fall within the EE envelope greater than 66% of the time. Furthermore, quality-filtered MODIS AODs from all of the datasets (Dark Land, Dark Ocean and Land_And_Ocean) show statistically significant discrepancies with respect to their counterparts from AERONET in terms of both mean and frequency, suggesting the need for improvement in MODIS retrieval algorithms over the coast.
Analysis clearly demonstrates that the MODIS MYD04 Dark Ocean algorithm has three error sources over coastal regions, respectively related to the cloud mask, assumption of sea-surface wind speed, and treatment of the sediment contribution to the water-leaving radiance. The overestimation of AOD due to cloud contamination and the underestimation of AOD due to the use of constant 6 ms−1 wind speed, which are found over the coastal region, are in agreement with Zhang and Reid's (Citation2006, Citation2010) global MODIS AOD analysis. Based upon MERRA data, we found that wind speeds over the coastal ocean are frequently lower than the 6 ms−1 assumed by the MODIS Dark Ocean algorithm, which indicates that the surface reflectance is smaller than what is used in the Dark Ocean algorithm for the coastal regions. It is noted that the algorithm for MODIS Collection 6 will account for the variations in sea-surface wind speed when estimating ocean-surface reflectance (personal communication with R. Levy). After empirical correction of cloud and sea-surface wind speed, the residual bias is found to be affected by the pigment and suspended particulate matter along the coastal water that are respectively characterised by the remote-sensing reflectance at different wavelengths. MODIS AOD has an increased bias when suspended matter in coastal water is higher. The analyses show that the sediment mask used in the MODIS algorithm is not very effective in removing sediment edges and the assumption of zero contribution by the suspended matter to the water-leaving radiance at longer wavelengths is not applicable to the coastal waters.
The bias for MODIS AOD before and after empirical correction is characterised beyond the mean bias. In contrast to the log-normal distribution of AOD, the MODIS AOD bias does indeed have a normal distribution, which suggests that the instantaneous bias is not a simple linear function of the MODIS AOD value itself. The proposed empirical correction for the cloud and sea-surface wind speed reduces both the mean and spread of MODIS AOD bias, and it is shown to have important implications for trend analyses.
It should be noted that while our analysis of retrieval error sources is based upon the physical reasoning and supported by the statistical results, the statistical significance is mainly evaluated from the mathematical point of view. The implications of these statistical results to the applications of AOD for climate studies or air-quality monitoring should be interpreted with caution because each application has its own requirement for data accuracy and tolerance of uncertainty. Nevertheless, a full characterisation of MODIS AOD biases (including their mean and spread) as well as an analysis of retrieval error sources for the formulation of empirical correction schemes are both needed to reduce and quantify the uncertainty in the utility of MODIS AOD for climate and air-quality studies (Li et al., Citation2007). As the MODIS retrieval algorithms continue to evolve and improve, their uncertainty analysis framework should also evolve towards a full characterisation of its bias statistics and error sources. It is recommended that the proposed treatment of the sediment mask and contribution of the sediments to the water-leaving radiances should be an integral part in the near-future refinement of MODIS aerosol algorithm.
7. Acknowledgments
Funding for this research was provided by NASA GSFC, NASA Nebraska Space Grant Consortium and the Department of Earth and Atmospheric Sciences at the University of Nebraska-Lincoln. The authors thank the NASA GEO-CAPE science definition team for the useful discussions on aerosols and uncertainties. Jun Wang also acknowledges the NASA Radiation Science Program and Atmospheric Composition and Analysis Program for support. Our final thought is for Gregory Leptoukh who tragically passed away during this research. Without his vision and foresight this project would have never been possible.
Related Research Data
References
- ATBD. Algorithm for Remote Sensing of Tropospheric Aerosol from MODIS: Collection 5. 2006. Product ID: MOD04/MYD04. Online at: http://modis.gsfc.nasa.gov/data/atbd/atbd_mod02.pdf .
- Ahmad Z , Franz B. A , Charles C. R , Kwiatkowska E. J , Werdell J , co-authors . New aerosol models for the retrieval of aerosol optical thickness and normalized water-leaving radiances from the SeaWiFS and MODIS sensors over coastal regions and open oceans. Appl. Opt. 2010; 49: 5545–5560.
- Bailey S. W , Franz B. A , Werdell P. J . Estimations of near-infrared water-leaving reflectance for satellite ocean color data processing. Optic Express. 2010; 18: 7521–7527.
- Brunke M , Wang Z , Zeng X , Bosilovich M , Shie C.-L . An Assessment of the Uncertainties in ocean surface turbulent fluxes in 11 reanalysis, satellite-derived, and combined global datasets. J. Clim. 2011; 24: 5469–5493.
- Charlson R , Shwartz S , Hales J , Cess R , Coakley J , co-authors . Climate forcing by anthropogenic aerosols. Science. 1992; 255: 423–430.
- Cox C , Munk W . Statistics of the sea surface derived from sun glitter. J. Marit. Sci. 1954; 13: 198–227.
- Drury E , Jacob D. J , Wang J , Spurr R. J. D , Chance K . Improved algorithm for MODIS satellite retrievals of aerosol optical depths over land. J. Geophys. Res. 2008; 113: 16204.
- Eck T , Holben B , Reid J , Dubovik O . Wavelength dependence of the optical depth of biomass burning, urban, and desert dust aerosols. J. Geophys. Res. 1999; 104: 31333–31349.
- Gordon H. R . Atomspheric correction of ocean color imagery in the earth observing system era. J. Geophys. Res. 1997; 102(102): 17081–17106.
- Gordon H. R , Clark D. K . Clear water radiances for atmospheric correction of coastal zone color scanner imagery. Appl Optic. 1981; 20: 4175–4180.
- Gordon H. R , Wang M . Retrieval of water-leaving radiance and aerosol optical thickness over the oceans with SeaWiFS: a preliminary algorithm. Appl. Opt. 1994; 33: 443–452.
- Goyensa C , Jameta C , Schroederb C . Evaluation of four atmospheric correction algorithms for MODIS-Aqua images over contrasted coastal waters. Remote Sens. Environ. 2013; 131: 63–75.
- Hoff R , Christopher S. A . Remote sensing of particulate matter air pollution from space: have we reached the promised land?. J. Air Waste Manage. Assoc. 2009; 59: 642–675.
- Holben B , Eck T , Slutsker I , Tanre D , Buis J. P , co-authors . AERONET – a federated instrument network and data archive for aerosol characterization. Remote Sens. Environ. 1998; 66: 1–16.
- Holt E , Wang J . Trends of wind speed at wind turbine height of 80 m over the contiguous United States using the North American Regional Reanalysis (NARR). J. Appl. Meteorol. Climatol. 2012; 51: 2188–2202.
- Hsu N. C , Gautam R , Sayer A. M , Bettenhausen C , Li C , co-authors . Global and regional trends of aerosol optical depth over land and ocean using SeaWiFS measurements from 1997 to 2010. Atmos. Chem. Phys. Discuss. 2012; 12: 8465–8501.
- Hu C , Chen Z , Clayton T. D , Swarzenski P , Brock J. C , co-authors . Assessment of estuarine water-quality indicators using MODIS medium-resolution bands: initial results from Tampa Bay, Florida. Remote Sens. Environ. 2004; 93: 423–441.
- Hyer E. J , Reid J. S , Zhang J . An over-land aerosol optical depth data set for data assimilation by filtering, correction, and aggregation of MODIS Collection 5 optical depth retrievals. Atmos. Meas. Tech. 2011; 4: 379–408.
- Ichoku C , Chu D , Mattoo S , Kaufman Y , Remer L , co-authors . A spatio-temporal approach for global validation and analysis of MODIS aerosol products. Geophys. Res. Lett. 2002; 29: 1–4.
- Ichoku C , Remer L. A , Eck T. F . Quantitative evaluation and intercomparison of morning and afternoon Moderate Resolution Imaging Spectroradiometer (MODIS) aerosol measurements from Terra and Aqua. J. Geophys. Res. 2005; 110: 10S03.
- IPCC. Solomon S , Qin D , Manning M , Chen Z , Marquis M , co-authors . Contribution of working group I to the Fourth Assessment Report of the intergovernmental panel on climate change. Climate Change 2007: The Physical Science Basis.
- Kahn R. A , Gaitley B. J , Martonchik J. V , Diner D. J , Crean K. A , co-authors . Multiangle Imaging Spectroradiometer (MISR) global aerosol optical depth validation based on 2 years of coincident Aerosol Robotic Network (AERONET) observations. J. Geophys. Res. 2005; 110: 1–16.
- Kennedy A , Dong X , Xi B , Xie S , Zhang Y , co-authors . A comparison of MERRA and NARR reanalyses with the DOE ARM SGP Data. J. Climate. 2011; 24: 4541–4557.
- Kinne S . Monthly averages of aerosol properties: a global comparison among models, satellite data, and AERONET ground data. J. Geophys. Res. 2003; 108: 4634, D20.
- Kleidman R , Smirnov A , Levy R , Mattoo S , Tanre D . Evaluation and wind speed dependence of MODIS aerosol retrievals over open ocean. IEEE Trans. Geosci. Remote Sens. 2012; 50: 429–435.
- Lavagnini A , Sempreviva A , Transerici C , Accadia C , Casaioli M , co-authors . Offshore wind climatology over the Mediterranean basin. Wind Energy. 2005; 9: 251–266.
- Levy R , Remer L , Dubovik O . Global aerosol optical properties and application to Moderate Resolution Imaging Spectroradiometer aerosol retrieval over land. J. Geophys. Res. 2007; 112: 1–15.
- Levy R , Remer L , Kleidman R , Mattoo S , Ichoku C , co-authors . Global evaluation of the Collection 5 MODIS dark-target aerosol products over land. Atmos. Chem. Phys. 2010; 10: 10399–10420.
- Li R.-R , Kaufman Y , Gao B.-C , Davis C . Remote sensing of suspended sediments and shallow coastal waters. IEEE Trans. Geosci. Remote Sens. 2003; 41: 559–566.
- Li Z , Niu F , Lee K.-H , Xin J , Hao W.-M , co-authors . Validation and understanding of Moderate Resolution Imaging Spectroradiometer aerosol products (C5) using ground-based measurements from the handheld Sun photometer network in China. J. Geophys. Res. 2007; 112: 22S07.
- Li Z , Zhao X , Kahn R , Mishchenko M , Remer L , co-authors . Uncertainties in satellite remote sensing of aerosols and impact on monitoring its long-term trend: a review and perspective. Ann. Geophys. 2009; 27: 1–16.
- Martín M , Cremades L , Santabàrbara J . Analysis and modeling of time series of surface wind speed and direction. Int. J. Climatol. 1999; 19: 197–209.
- Mi W , Li Z , Xia X , Holben B , Levy R , co-authors . Evaluation of the Moderate Resolution Imaging Spectroradiometer aerosol products at two Aerosol Robotic Network stations in China. J. Geophys. Res. 2007; 112: 1–14.
- Miller R. L , McKee B. A . Using MODIS Terra 250 m imagery to map concentrations of suspended matter in coastal waters. Remote Sens. Environ. 2004; 93: 259–266.
- O'Neill N. T , Ignatov A , Holben B. N , Eck T. F . The lognormal distribution as a reference for reporting aerosol optical depth statistics; empirical tests using multi-year, multi-site AERONET sunphotometer data. Geophys. Res. Lett. 2000; 27: 3333–3336.
- Petrenko M , Ichoku C , Leptoukh G . Multi-sensor aerosol products sampling system (MAPSS). Atmos. Meas. Tech. 2012; 5: 913–926.
- Remer L , Kaufman Y , Tanré D , Mattoo S , Chu D , co-authors . The MODIS aerosol algorithms, products, and validation. J. Atmos. Sci. 2005; 62: 947–973.
- Rienecker M , Suarez M , Gelaro R , Todling R , Bacmeister J , co-authors . MERRA – NASA's modern-era retrospective analysis for research and applications. J. Climate. 2011; 24: 3624–3648.
- Samet J , Zegar S , Dominici F , Curriero F , Coursac I , co-authors . The National Morbidity, Mortality, and Air Pollution Study Part II: Morbidity and Mortality from Air Pollution in the United States. 2000; Health Effects Institute, Cambridge, MA. 94, 2000.
- Shi Y , Zhang J , Reid R , Holben B , Hyer E , co-authors . An analysis of the collection 5 MODIS over-ocean aerosol optical depth product for its implication in aerosol assimilation. Atmos. Chem. Phys. 2011; 11: 557–565.
- Smirnov A , Holben B. N , Eck T. F , Dubovik O , Slutsker I . Cloud-screening and quality control algorithms for the AERONET database. Remote Sens. Environ. 2000; 73: 337–349.
- Stumpf R. P , Arone R. A , Gould R. W , Ransibrahmanakul V , Hooker S. B , Firestone E. R . A partially coupled ocean-atmosphere model for retrieval of water-leaving radiance from SeaWiFS in coastal waters. SeaWiFS Postlaunch Technical Report Series. 2003; MD, NASA Goddard Space Flight Center: Greenbelt. 51–59. Chap. 9, NASA/TM-2003-206892, volume 22.
- Tanré D , Kaufman Y. J , Herman M , Mattoo S . Remote sensing of aerosol properties over oceans using the MODIS/EOS spectral radiances. J. Geophys. Res. 1997; 102: 16971–16988.
- Tibbetts J . Coastal cities: living on the edge. Environ. Health Perspect. 2002; 110: 674–681.
- Wang J , Xu X , Spurr R , Wang Y , Drury E . Improved algorithm for MODIS satellite retrievals of aerosol optical thickness over land in dusty atmosphere: implications for air quality monitoring in China. Remote Sens. Environ. 2010; 114: 2575–2583.
- Wilks D. S . Frequentist Statistical Inference, in Statistical Methods in the Atmospheric Sciences. 2011; 3rd ed, Academic Press, San Diego, CA.
- Yu H , Kaufman Y , Chin M , Feingold G , Remer L , co-authors . A review of measurement-based assessment of aerosol direct radiative effect and forcing. Atmos. Chem. Phys. 2006; 6: 613–666.
- Zhang J , Reid J . MODIS aerosol product analysis for data assimilation: assessment of over-ocean level 2 aerosol optical thickness retrievals. J. Geophys. Res. 2006; 111: 1–17.
- Zhang J , Reid J . A decadal regional and global trend analysis of the aerosol optical depth using a data-assimilation grade over-water MODIS and Level 2 MISR aerosol products. Atmos. Chem. Phys. 2010; 10: 18879–18917.