Abstract
Tropospheric methyl bromide (CH3Br) is the largest source of bromine to the stratosphere and plays an important role in ozone depletion. Here, the first stable bromine isotope composition (δ81Br) of atmospheric CH3Br is presented. The δ81Br of higher concentration Stockholm samples and free air subarctic Abisko samples suggest a source/background value of −0.04±0.28‰ ranging up to +1.75±0.12‰. The Stockholm δ81Br versus concentration relationship corresponds to an apparent isotope enrichment factor of −4.7±3.7‰, representing the combined reaction sink. This study demonstrates the scientific potential of atmospheric δ81Br measurements, which in the future may be combined with other isotope systems in a top-down inverse approach to further understand key source and sink processes of methyl bromide.
To access the supplementary material to this article, please see Supplementary files under Article Tools online.
1. Introduction
Methyl bromide (CH3Br) is the main source of bromine to the stratosphere. There, Br can catalyse ozone loss. CH3Br has an average tropospheric mixing ratio of about 8 ppt (parts per trillion) and an atmospheric lifetime of 0.8 years (Montzka et al., Citation2011). The Montreal Protocol has led to cuts in the anthropogenic production of methyl bromide and thus to a decrease of the atmospheric Br load (Montzka et al., Citation2003). However, CH3Br is also produced by a broad range of natural sources, such as macroalgae (Laturnus, Citation2001), salt marshes (Rhew et al., Citation2000), rice paddies (Redeker et al., Citation2000) and peatlands (White et al., Citation2005), amongst others. Ocean uptake and decomposition by atmospheric OH radicals are currently believed to greatly outweigh known sources. Thus, the atmospheric CH3Br budget remains unbalanced, as either the magnitude of sinks is overestimated or sources are underestimated or have not yet been identified (Yvon-Lewis et al., Citation2009).
Stable isotope systematics may add further constraints to the global budget of CH3Br. Stable carbon isotope (δ13C) analysis of CH3Br has been reported for atmospheric free air (Bill et al., Citation2004), emissions from salt marshes (Bill et al., Citation2002) and industrially produced CH3Br (McCauley et al., Citation1999). Atmospheric δ13C signatures (−43±2‰ VPDB, Vienna Pee-Dee Belemnite) are indistinguishable from salt marsh emissions (−43.1±1.5‰ VPDB) and anthropogenic CH3Br (−43‰ to −66.4‰ VPDB) at present limit the source-diagnostic value of δ13C-CH3Br used in isolation. Hence, for methyl bromide, further insights to the source and sink dynamics may require the use of the additional isotope systems of stable hydrogen and/or bromine.
We have recently developed a novel cryosampling method for collecting large volumes of CH3Br from the atmosphere (CitationThornton et al., in press) and a sensitive analytical method for stable bromine isotopes in CH3Br (Horst et al., Citation2011). Here, we report on the first exploratory application of δ81Br to ambient CH3Br in temperate-boreal suburban Stockholm, Sweden and a well-studied subarctic wetland/permafrost site near Abisko, Sweden.
2. Methodology
2.1. Sampling sites
Two studies were accomplished in 2011. The first sampling site was in Stordalen Mire, located in the Stordalen Nature Reserve 10 km east of Abisko in subarctic northern Sweden (68.354°N, 19.048°E, 359 m above sea level). Stordalen Mire is a 25 ha peat palsa plateau system with raised hummocks, uplifted by permafrost interspersed with wet fens (Callaghan et al., Citation2010). The area is surrounded by birch forest and bordered by lakes to the northwest and southeast. The annual mean temperature is 0.7°C and annual precipitation is about 300 mm. Due to decadal scale temperature increases, the permafrost underlying the peatland is currently thawing, which may have a major influence on the future release of CH3Br and other gases (Christensen et al., Citation2004), although a recent study suggests that Stordalen is a net sink of CH3Br based on field chamber measurements (Hardacre et al., Citation2009). Generally, air at this site, north of the Arctic Circle, can be expected to have less recent anthropogenic influences than air in Stockholm.
The second sampling site, Stockholm University, is located about 4 km north of central Stockholm in a semi-forested park-like area. The Stockholm area has numerous lakes and borders on the Baltic Sea; local air masses frequently come from mainland Europe. Our measurement site was located on a balcony on the fifth floor of the Geosciences building (59.366°N, 18.058°E), about 10 m above ground level (35 m above sea level).
2.2. Field sampling
We used a cryogenic collection system previously described by CitationThornton et al. (in press), capable of isolating CH3Br from several cubic metres of air to yield the amounts necessary for Br isotope analysis (~20 ng Br/measurement) without causing any isotope fractionation. Samples of 2.7–4.8 m3 were taken from the free air as well as from soil air (only Stordalen Mire). Briefly, a KNF 145 diaphragm vacuum pump (KNF Neuberger GmbH, Freiburg, Germany) was used to pull air through a 1-L liquid-nitrogen-cooled cryotrap at a flow rate of 15 L/min. The air stream was dried using a Drierite® trap. After sampling, the cryotrap was heated to 50°C and the concentrated CH3Br sample transferred to a 2.58-L stainless steel canister (OPSIS AB, Furulund, Sweden) equipped with a bellows valve (Nupro Company, Willoughby, OH). During transfer to the canister, CO2 was removed by using a 100-mL Carbosorb®-trap.
For the Abisko free air samples from Stordalen Mire, a stainless steel tube was used to sample air 3.5 m above ground. We collected air only under turbulent boundary layer (BL) conditions to minimise the potential influence of local soil exchange. The four atmospheric samples collected on 2–3 August 2011 are thus referred to as ‘Abisko free air’ samples. Additionally, we collected five samples of air from the ground at Stordalen on 3–5 August 2011. A polypropylene probe (5 cm i.d., perforated with 3 mm holes over the lowermost 15 cm length) was introduced into dry and uplifted soil areas (palsa) with the perforations starting at a depth of 15–20 cm. Frozen soil and high soil water content hampered deeper sampling. A 16 m2 polyethylene sheet was used to cover the ground around the probe, with its edges ballasted to minimise intrusion of atmospheric air. The cylindrical volume of soil under the tarp (assuming the shortest distance from the probe to the edge) was more than 3.8 m3 for the observed unfrozen soil depth of at least 30 cm. Pore volumes can be up to 90% in peatland systems (e.g. Letts et al., Citation2000), hence the atmospheric influence on sampled air was considered to be small. The soil air was then pumped from the probe into the cryosampling system in the same manner as the atmospheric samples. These are referred to as ‘dry’ soil air samples. For two more samples, we covered moss-dominated damp areas (sphagnum) with the polyethylene sheet and collected from the air under it. The probe was again placed in the middle of the sheet but not pushed into the soil. In that way, we sampled air that was in contact with the soil surface and the plants only to test if there would be any isotopic shift in comparison to the atmospheric samples. These are referred to as ‘damp’ soil air samples.
Six samples of 4.8 m3 were collected on the Stockholm University campus between 29 September and 19 October 2011 (). They were sampled and stored in the same manner as the Abisko free air samples. We refer to these as ‘Stockholm free air’ samples.
Table 1 Results from concentration and isotope measurements
2.3. Clean up and quantification
Although the cryosampler removes O2, N2, Ar and the majority of CO2, the remaining interfering components of the atmospheric matrix had to be removed before Br isotope analysis could be carried out. This was performed by using preparative gas chromatography on a packed column (CitationThornton et al., in press). Briefly, the sample gas was transferred from the canisters to a liquid-nitrogen-cooled pre-concentration trap and from there released onto the packed column by rapid heating. After separation the CH3Br peak was heart-cut and transferred to a liquid-nitrogen-cooled stainless steel loop. Five percent of the sample was redirected over a custom-made split to the mass spectrometer for peak detection. After transfer, the loop was sealed with end caps and stored in a freezer at −20°C until further analysis.
The collected samples were quantified, before purification for isotope analyses, by injecting a 1-mL aliquot from the sample canisters on the gas chromatography (GC) system equipped with a DB-1 column and an on-column cryofocussing device (SMART CRYO, Weatherford Laboratories, Houston, TX). After heating the trap, the compounds were released onto the column and analysed with quadrupole mass spectrometry using m/z 94 for quantification. The GC was operated at isothermal conditions (80°C, 3 psi). For the Stockholm samples, the propagated error estimate () comprised the analytical uncertainty (1σ) for four single analyses per sample being usually smaller than 5%. The cryosampling caused an additional uncertainty of 10%, which was calculated from four individual replicates. The Abisko samples were quantified only during the purification procedure and the analytical uncertainty was determined from two individual analyses (1σ between 5 and 10%).
For Br isotope determination, the collected amounts of CH3Br would usually allow each sample to be analysed only once on the GC/MCICPMS system (Gas chromatography/multicollector inductively coupled plasma mass spectrometry), although some samples were large enough for multiple injections. Samples were extracted from the storage loops using a 10-mL gas-tight syringe (Hamilton, Reno, NV) and septa fitted at both ends of the loop. The injected samples were separated on a DB-624 column (Agilent, Santa Clara, CA) and introduced to the plasma. Two detectors (Ax0 and H1) were aligned for the simultaneous detection of masses 79 and 81. The results were recorded into an Excel® sheet. This method yields a precision of <0.1‰ for Br amounts of 40 ng and <0.7‰ for 5 ng of Br. The Br-isotope method is described in detail in CitationHorst et al. (2011).
2.4. Bromine isotope analysis
Isotope analysis was performed using gas-chromatography inductively coupled plasma multicollector mass spectrometry (GC/MCICPMS) as detailed by CitationHorst et al. (2011). The Br isotope ratio (R=81Br/79Br) between the sample and a standard reference material is reported as follows:
Bromine isotope data are conventionally referenced against standard mean ocean bromide (SMOB). Our internal laboratory standard is a commercially available CH3Br purchased from Sigma Aldrich Sweden AB (Stockholm, Sweden; Catalog No. 65950), with a δ81Br of +0.12±0.02‰ (n=3). Referencing versus SMOB was carried out as a commercial service by the Environmental Isotope Laboratory at the University of Waterloo (Canada) using continuous-flow isotope-ratio mass spectrometry (CF-irMS; Shouakar-Stash et al., Citation2005).
2.5. Back-trajectories
Five-day back-trajectories (BTs) were calculated using the NOAA HYSPLIT_4 model (Draxler and Hess, Citation1997; Draxler, Citation1999) to identify the travel paths of the air masses 5 d before sampling and to calculate BL heights. Five single trajectories were calculated for every sample in time steps of 1 hour bracketing the whole sampling time of 4 hours. The starting height was set to 50 m for Abisko free air samples and to 100 m for the Stockholm samples.
3. Results and discussion
A total of 15 air samples were collected in this first study of the bromine isotope composition of ambient CH3Br. In Abisko, the four free air samples taken at the beginning of August had an isotopic range of −0.14‰ to +0.48‰. The three dry soil air samples showed δ81Br values of −0.25‰ to +0.88‰ while the two damp-soil air samples had isotopic values of +0.04 and +1.42‰. The six September–October atmospheric samples taken in Stockholm yielded δ81Br that ranged from −0.47‰ to +1.75‰ SMOB (see ). Generally, the δ81Br of the Stockholm free air samples spanned over a wider range than the Abisko free air samples. The concentration for Stockholm was on average 14.4 ppt±2.1 ppt. The average concentration for Abisko samples was 9.8 ppt±3.1 ppt. The mixing ratios from damp-soil sites were indistinguishable from free air samples (9.3 ppt±1.1 ppt) while the dry soil samples showed lower mixing ratios of 4.5 ppt±2 ppt. This cryosampling procedure is optimised for the high-volume sampling and elaborate subsequent handling necessary for isotope analysis. Such high-volume sampling leads to relatively larger uncertainties in the CH3Br quantification; the concentration measurements were primarily to provide a check for proper operation of the cryosampling system. However, they also give a rough idea of relative ambient CH3Br concentrations.
3.1. Meteorological setting
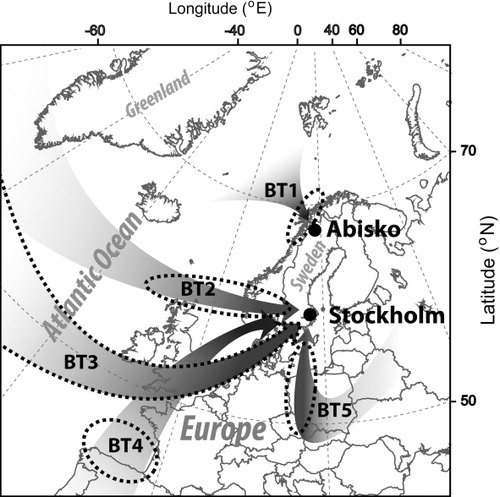
BTs were assessed to investigate the near-term origin of the air masses reaching the sampling points (detailed in Figs. S1.1–S1.10, SI). Given an atmospheric lifetime for CH3Br of about 0.8 years, BTs are likely only informative if they had passed recently over a major source region and if the air masses at that point were in contact with the BL as indicated with dotted ellipses in . Three samples (11–13), described by BT 2 in , have a similar origin. Air masses travelled from Greenland over the Atlantic Ocean to Stockholm touching the north of the British Isles. Despite the same travel path, the residence time in the BL varied from 30 hours prior to arrival for sample 11 to 120 hours for sample 13. The recent air masses of sample 10 (BT 4) had their origin in the northwestern Iberian coastal region and were transported rapidly from there in the free atmosphere towards the north. Sample 14 air masses (BT 5) indicate a south to north travel path from Central Europe and contact with the mixed layer during the last 40 hours before arrival. Sample 15 (BT 3) was along the 5-d travel time in contact with the BL. It took a track over southern British Isles/northern Europe. This may have provided some opportunity for recent influence by anthropogenic sources to its CH3Br load. However, given the long lifetime of CH3Br (0.8 years) only large nearby sources could have altered the isotopic composition and mixing ratios. For the Abisko free air samples (BT 1), all of the BTs were similar. They travelled slowly over the Norwegian–Greenland Sea and crossed the Norwegian mountains during the preceding 5 d, staying generally within the BL below 500 m altitude.
Fig. 1 Back trajectories (BTs) of sampled air, as determined by HYSPLIT4 model. The arrows are describing the path of the air mass BTs and the dotted ellipses are indicating the area where it was last in contact with the ground (i.e. in the boundary layer). The BT 3 contact region is described by the entire arrow (dotted margins).
3.2. Free air concentrations of methyl bromide
The free air mixing ratios for both sampling sites show higher values compared to the long-term middle/high-latitude background concentrations from the AGAGE station Mace Head, Ireland (7.3–7.6 ppt for August–October) located more than 2000 km away. Air masses sampled in Stockholm may have been affected by CH3Br enrichment from recent sources. The Abisko free air samples were statistically indistinguishable from the average background values (p-value 0.4), suggesting that this subarctic site only received minor amounts from local CH3Br sources.
In Abisko, additionally to free air samples, soil air samples were taken for dry (three samples) and damp- (two samples) soil areas. One of the damp samples (No. 8) is not considered in the subsequent statistical evaluation because a leak around the probe caused sampling of large amounts of pure free air (>50%), which did not undergo soil/plant exchange as intended. The soil air samples (dry+damp) showed a lower mean concentration of 5.4 ppt in comparison to mean free air mixing ratios (9.8 ppt) at the 90% confidence interval (Student's t-test, p-value 0.09) ( and ). The lower soil air concentrations suggested a net soil uptake of CH3Br, which might be due to biological processes and/or oxidation (e.g. Harper et al., Citation2000). This agrees with the findings of Hardacre et al. (Citation2009) who investigated methyl halide exchange on the Stordalen Mire and observed these sites to be an overall weak CH3Br sink (−25 ng m−2 h−1) for all types of investigated soil (dry, damp and wet).
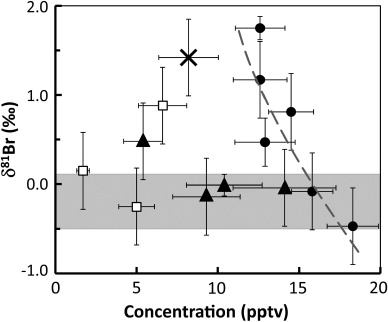
Fig. 2 Methyl bromide isotope composition as a function of concentration for Stockholm free air (filled circles), Abisko free air (open squares), Abisko dry soil air (filled triangles) and Abisko damp-soil air (cross). A logarithmic regression line (dashed, grey) shows the enrichment in δ81Br as the CH3Br concentration decreased in the Stockholm free air. The grey-shaded area indicates the lowest values found throughout both field campaigns and indicates a range of suggested background composition.
3.3. Free air bromine isotope composition
Several features indicative of CH3Br sources and sinks were apparent in the δ81Br-CH3Br signals observed for both the subarctic soil and the free air at both sites. First, we note that the isotopically least-enriched (i.e. lowest δ81Br) values in each soil and free air system were in the range of −0.5 to +0.1‰ ( and Fig. 2), representing a putative δ81Br source range. For instance, the mean of the Abisko free air samples and the two least isotopically enriched (or least degraded; see the following text) Stockholm free air samples yielded a δ81Br value of −0.04±0.24‰. This field-data low range end-member value for δ81Br were quite similar to +0.12±0.05‰ constrained for three commercially available CH3Br (Horst et al., Citation2011) although, again, mixing with other sources and decomposition might have changed the initial δ81Br.
The Stockholm free air samples showed an inverse relationship between mixing ratios and δ81Br values (correlation coefficient −0.86). This trend of enrichment in δ81Br with decreasing concentrations may be consistent with a significant influence on the overall fate of atmospheric CH3Br from sink processes that induce a kinetic isotope effect (KIE; corresponding to the isotope enrichment factor ɛ=[1−KIE]×1000‰), for example the combined effects of atmospheric as well as biological processes (e.g. microbiological transhalogenation/degradation in soils) (Harper et al., Citation2000). While sinks in soils and the ocean are likely to be important (e.g. Yvon-Lewis et al., Citation2009), the rate-limiting step in those processes is the net partitioning between air – soil air and air–seawater; such phase partitioning is unlikely to induce a substantial KIE (Huang et al., Citation1999). Laboratory experiments have demonstrated vapour-phase reactions of CH3Cl with Cl and OH radicals inducing a strong KIE for stable carbon isotopes in the remaining methyl halide substrate pool (Gola et al., Citation2005). We derived an apparent isotope enrichment factor (ɛ app) for the Stockholm free air δ81Br-CH3Br dataset (i.e. linear regression of the natural logarithm of the δ81Br+1000 vs. the concentration expressed as the logarithm of the remaining fraction from the highest measured mixing ratio of the Stockholm campaign; see Fig. S2, SI) of ɛ app=−4.7±3.7‰ (95% confidence interval). This ɛ app thus includes effects presumably by all removal reactions in the atmosphere, acting to enrich the δ81Br of the decreasing CH3Br pool. Removal due to partitioning into soil and the ocean decreases the mixing ratio presumably with a much smaller, if any, effect on the δ81Br of the remaining atmospheric CH3Br.
The reasons for ɛ app value for δ81Br-CH3Br of ~−5‰ being substantially lower than the previously noted ɛ for δ13C-CH3Cl of −59±3.7‰ (Gola et al., Citation2005), is likely to reflect dilution of the CH3Br concentration by non-fractionating sink processes, the mass dependency (smaller shifts for heavier atoms) and the characteristics of the primary tropospheric isotope fractionating atmospheric sink (e.g. the reaction with the hydroxyl radical). A calculated indicative primary ɛ Br for the abstraction of the bromine atom (−0.25‰<ɛ<0‰; see Supplementary Information 1 calculations) showed that the observed ɛ app was likely too large to be consistent with just a mass-dependent isotope fractionation associated with the hydroxyl radical sink. The atmospheric hydroxyl radical reaction occurs at one of the hydrogen atoms, and would be expected to induce a secondary, if any, KIE for the bromine group in the CH3Br molecule. Such secondary effects are generally smaller than the primary effects (Wolfsberg, Citation1960), although specific data for the present case are not available in the literature. Hence, the observed ɛ app is more likely to reflect some unidentified reaction with a larger isotope effect. Photolysis with concomitant mass-independent isotope fractionation (Gao and Marcus, Citation2001; Laube et al., Citation2010) has the potential to cause unexpectedly large isotope effects but is not a major loss process in the troposphere. Large effects for chlorine isotopes have also been found for natural deposits of perchlorate, with measured δ37Cl values in the range −15‰ to −10‰ (Bohlke et al., Citation2005). However, that KIE may result from the perchlorate source/formation rather than from sink processes.
Isotopic data may also be assessed with a two-component mixing model, where δ81Br values are plotted versus the reciprocal concentrations (also known as a Keeling plot). The linear regression (δ81Br=70.1±19.8 · 1/conc. −4.3±1.4, R 2=0.76; Fig. S3, SI) can be extrapolated and viewed as a mixing line between two end members: (i) a combined source signature (conc.=∞); and (ii) background CH3Br (8 ppt). For our observations, the corresponding extrapolated δ81Br values would be: (i) −4‰±4‰ (95% confidence interval) for the source; and (ii) +4‰±3‰ for the background. Known anthropogenic source signatures (+0.12‰±0.05‰) are in the higher estimated δ81Br range and the Abisko free air samples, which might reflect background air because of their low concentration, were in the high end of these crude and extrapolated δ81Br estimates of background values. The aforementioned degradation/sink effects may have had an impact on the slope of the mixing line (increasing the slope) and caused an under-/overestimation of source/ background δ81Br values. This mixing plot can only provide a very vague view on conceivable combined source and sink signatures until further studies confirm or invalidate this estimate. Taken together, the Stockholm free air data indicate that the combination of sink processes induces an isotope effect in atmospheric CH3Br and in combination with mixing effects cause distinct δ81Br signatures.
The Abisko free air samples, which collected air with similar northern North Atlantic BTs, showed a relatively narrow δ81Br range (0.62‰) and concentrations comparable to longer term background values at for example Mace Head. The mean δ81Br was +0.07±0.24‰, which was nearly the same as for industrially-produced CH3Br (+0.12‰) and close to the presumably least-degraded source signature for the Stockholm campaign. Thus, there was no statistically significant degradation or mixing trend (i.e. correlation) amongst these four delta values.
For the Abisko soil air samples, the Br isotopic signatures showed a wider spread (+1.77‰) than the free air sample values (). The soil air samples also tended on average to be more enriched (+0.55‰ SMOB), although this was not statistically significant (Student's t-test, p-value 0.28). This tendency in the isotopic composition may be the sum of all microbial/enzymatic degradation as well as production mechanisms. However, the data presented here only give a very first preliminary view on a conceivable bulk isotope effect due to processes in the soil. Isotope fractionation of the actual processes will be the subject of future studies. Taken together and consistent with the study by Hardacre et al. (Citation2009), particularly the concentration trend suggests that there is a net uptake of CH3Br by these subarctic soils.
4. Conclusions
This study contributes a baseline view of bromine isotopes in atmospheric methyl bromide. The results demonstrate δ81Br isotope signatures from different atmospheric source regions spanning a δ81Br range from −0.47‰ to +1.75‰ SMOB. The δ81Br versus concentration relationship indicates a mixing trend and isotope-fractionating processes acting as a sink of atmospheric CH3Br. The field-based estimate of the apparent isotope enrichment factor suggests that there are additional sink processes inducing a higher ɛ than the hydroxyl radical reaction and uptake in soil and/or oceanic water. The coupled δ81Br-concentration measurements in subarctic soil systems and free air support the conclusion of an earlier study that these wetlands act as a weak net sink for CH3Br.
5. Acknowledgments
This research was funded as part of the HVOCSIA (Halogenated Volatile Organic Compound-Specific Isotope Analysis) project by the Swedish Research Council (VR grant 311-2007-8381). Örjan Gustafsson acknowledges financial support as an Academy Research Fellow from the Swedish Royal Academy of Sciences through a grant from the Knut and Alice Wallenberg Foundation. Brett Thornton acknowledges funding from the Bolin Centre for Climate Research. The authors thank Julia Steinbach for field assistance in collecting the Stordalen samples.
Notes
To access the supplementary material to this article, please see Supplementary files under Article Tools online.
Related Research Data
References
- Bill M , Conrad M. E , Goldstein A. H . Stable carbon isotope composition of atmospheric methyl bromide. Geophys. Res. Lett. 2004; 31(4): 1–4. DOI: 10.1029/2003GL018639.
- Bill M , Rhew R. C , Weiss R. F , Goldstein A. H . Carbon isotope ratios of methyl bromide and methyl chloride emitted from a coastal salt marsh. Geophys. Res. Lett. 2002; 29: 1–4. DOI: 10.1029/2001GL012946.
- Bohlke J. K , Sturchio N. C , Gu B. H , Horita J , Brown G. M , co-authors . Perchlorate isotope forensics. Anal. Chem. 2005; 77(23): 7838–7842. DOI: 10.1021/ac051360d.
- Callaghan T. V , Bergholm F , Christensen T. R , Jonasson C , Kokfelt U , co-authors . A new climate era in the sub-Arctic: accelerating climate changes and multiple impacts. Geophys. Res. Lett. 2010; 37 DOI: 10.1029/2009GL042064.
- Christensen T. R , Johansson T. R , Akerman H. J , Mastepanov M , Malmer N , co-authors . Thawing sub-Arctic permafrost: effects on vegetation and methane emissions. Geophys. Res. Lett. 2004; 31(4): DOI: 10.1029/2003GL018680.
- Draxler R. R . HYSPLIT4 user's guide. 1999. NOAA Tech. Memo ERL ARL-230, NOAA, Ed., 24.
- Draxler R. R , Hess G. D . Description of the HYSPLIT_4 modeling system. 1997. NOAA Tech. Memo, ERL ARL-224, NOAA, Ed., 24.
- Gao Y. Q , Marcus R. A . Strange and unconventional isotope effects in ozone formation. Science. 2001; 293(5528): 259–263. DOI: 10.1126/science.1058528.
- Gola A. A , D'Anna B , Feilberg K. L , Sellevåg S. R , Bache-Andreassen L , co-authors . Kinetic isotope effects in the gas phase reactions of OH and Cl with CH3Cl, CD3Cl, and 13CH3Cl. Atmos. Chem. Phys. 2005; 5(9): 2395–2402. DOI: 10.5194/acp-5-2395-2005.
- Hardacre C. J , Blei E , Heal M. R . Growing season methyl bromide and methyl chloride fluxes at a sub-Arctic wetland in Sweden. Geophys. Res. Lett. 2009; 36: 1–5. DOI: 10.1029/2009GL038277.
- Harper D. B , Kalin R. M , Larkin M. J , Hamilton J. T. G , Coulter C . Microbial transhalogenation: a complicating factor in determination of atmospheric chloro- and bromomethane budgets. Environ. Sci. Technol. 2000; 34: 2525–2527.
- Horst A , Holmstrand H , Andersson P , Andersson A , Carrizo D , co-authors . Compound-specific bromine isotope analysis of methyl bromide using gas chromatography hyphenated with inductively coupled plasma multiple-collector mass spectrometry. Rapid Commun. Mass Spectrom. 2011; 25(17): 2425–2432. DOI: 10.1002/rcm.5144.
- Huang L , Sturchio N. C , Abrajano T , Heraty L. J , Holt B. D . Carbon and chlorine isotope fractionation of chlorinated aliphatic hydrocarbons by evaporation. Org. Geochem. 1999; 30(8A): 777–785. DOI: 10.1016/S0146-6380(99)00060-.
- Laturnus F . Marine macroalgae in polar regions as natural sources for volatile organohalogens. Environ. Sci. Pollut. Res. 2001; 8(2): 103–108.
- Laube J. C , Kaiser J , Sturges W. T , Boenisch H , Engel A . Chlorine isotope fractionation in the stratosphere. Science. 2010; 329(5996): 1167–1167. DOI: 10.1126/science.1191809.
- Letts M. G , Roulet N. T , Comer N. T , Skarupa M. R , Verseghy D. L . Parametrization of peatland hydraulic properties for the Canadian land surface scheme. Atmos.Ocean. 2000; 38: 141–160.
- McCauley S , Goldstein A , DePaolo D . An isotopic approach for understanding the CH3Br budget of the atmosphere. Proc. Natl. Acad. Sci. USA. 1999; 96(18): 10006–10009. DOI: 10.1007/BF02987302.
- Montzka S. A , Butler J. H , Hall B. D , Mondeel D. J , Elkins J. W . A decline in tropospheric organic bromine. Geophys. Res. Lett. 2003; 30(15): 1–4. DOI: 10.1029/2003GL017745.
- Montzka S. A , Reimann S , Engel A , Krüger K , O'Doherty S , co-authors . Ozone-depleting substances (ODSs) and related chemicals. In: Scientific Assessment of Ozone Depletion: 2010, Global Ozone Research and Monitoring Project, Report No. 52, Chapt. 1. 2011
- Redeker K. R , Wang N. Y , Low J. C , McMillan A , Tyler S. C , co-authors . Emissions of methyl halides and methane from rice paddies. Science. 2000; 290(5493): 966–969. DOI: 10.1126/science.290.5493.966.
- Rhew R. C , Miller B. R , Weiss R. F . Natural methyl bromide and methyl chloride emissions from coastal salt marshes. Nature. 2000; 403(6767): 292–295. DOI: 10.1038/35002043.
- Shouakar-Stash O , Drimmie R , Frape S . Determination of inorganic chlorine stable isotopes by continuous flow isotope ratio mass spectrometry. Rapid Commun. Mass. Spectrom. 2005; 19(2): 121–127. DOI: 10.1002/rcm.1762.
- Thornton B. F , Horst A , Carrizo D , Holmstrand H , Andersson P , co-authors . A high-volume cryosampler and sample purification system for halogen isotope studies of methyl halides. J. Atmos. Oceanic. Technol. DOI: 10.1175/JTECH-D-12-00228.1 (Published online 27 May 2013: http://journals.ametsoc.org/doi/abs/10.1175/JTECH-D-12-00228.1) In press.
- White M , Varner R , Crill P. M , Mosedale C . Controls on the seasonal exchange of CH3Br in temperate peatlands. Global Biogeochem. Cycles. 2005; 19(4): 1–14. DOI: 10.1029/2004GB002343.
- Wolfsberg M . Note on secondary isotope effects in reaction rates. J. Chem. Phys. 1960; 33(1): 2–6. DOI: 10.1063/1.1731078.
- Yvon-Lewis S. A , Saltzman E. S , Montzka S. A . Recent trends in atmospheric methyl bromide: analysis of post-Montreal Protocol variability. Atmos. Chem. Phys. 2009; 9(16): 5963–5974. DOI: 10.5194/acp-9-5963-2009.