Abstract
Detailed observations of O2:CO2 exchange ratios were conducted in a cool temperate deciduous forest located in central Japan. The exchange ratios of soil respiration and net assimilation were found to be 1.11±0.01 and 1.02±0.03 from soil chamber and branch bag measurements, respectively. Continuous measurements of the atmospheric O2/N2 ratio and the CO2 concentration, made inside the canopy during a summer season, indicated that the average exchange ratio was lower in the daytime (0.87±0.02) than in the nighttime (1.03±0.02) with a daily mean value of 0.94±0.01. The observed average daytime and nighttime exchange ratios were nearly consistent with the corresponding values obtained from a one-box canopy O2/CO2 budget model simulation of net turbulent O2 and CO2 fluxes between the atmosphere and the forest ecosystem. Our results suggest that the daily mean exchange ratios of the net turbulent O2 and CO2 fluxes depend sensitively on the forest ecosystem processes.
1. Introduction
Estimations of oceanic and terrestrial biospheric CO2 uptake based on the observations of the atmospheric O2/N2 ratio have been conducted by many research groups (e.g. Battle et al., Citation1996, Citation2000; Keeling et al., Citation1996; Langenfelds et al., Citation1999; Bender et al., Citation2005; Manning and Keeling, Citation2006; Tohjima et al., Citation2008; van der Laan-Luijkx et al., Citation2010; Ishidoya et al., Citation2012a, Citationb) since the first study by Keeling and Shertz (Citation1992). To apply this method, the global average terrestrial biospheric O2:CO2 molar exchange ratio (ΔO2 ΔCO2 −1) is needed. Keeling (Citation1988) estimated the −O2:CO2 exchange ratio (hereafter referred to as ER) of 1.05 for wood by surveying the results from various elemental abundance studies. Severinghaus (Citation1995) obtained ER of around 1.2 from measurements of forest soils and about 1.1 for net ecosystem exchange.
The value of 1.10±0.05 reported by Severinghaus (Citation1995) has been used for the global average terrestrial biospheric ER in recent years (e.g. Bender et al., Citation2005; Manning and Keeling, Citation2006; Tohjima et al., Citation2008; Ishidoya et al., Citation2012a, Citationb). However, to test the validity of this value, observations of the atmospheric O2/N2 ratio have been conducted in and over various forest canopies (e.g. Seibt et al., Citation2004; Kozlova et al., Citation2005, Citation2008; Sturm et al., Citation2005; Stephens et al., Citation2007). By analysing flask air samples collected at a forest site in Hainich National Park (51°N, 10°E) in central Germany for the atmospheric O2/N2 ratio and CO2 concentration, Kozlova et al. (Citation2005) obtained an average ER value of 0.99, with no significant difference between daytime and nighttime values (hereafter the ER value of forest canopy air is referred to as ‘ERatm’). From continuous observations of the atmospheric O2/N2 ratio and CO2 concentration at the WLEF tall-tower research site (46°N, 90°W) in a forest in northern Wisconsin, USA, Stephens et al. (Citation2007) also reported average ERatm values ranging from 1.01 to 1.06, depending on the height. The ERatm values obtained by Kozlova et al. (Citation2005) and Stephens et al. (Citation2007) are smaller than the value of 1.10. However, to examine the ER value of the net turbulent O2 and CO2 fluxes between the forest ecosystem and the atmosphere above the canopy (hereafter referred to as ‘ERF’), Seibt et al. (Citation2004) analysed their observational results in the Griffin forest (57°N, 4°W), UK using a one-box canopy O2/CO2 budget model. Seibt et al. (Citation2004) showed that ERF is different from ERatm inside the canopy; their ERF and ERatm values estimated for the daytime are 1.26–1.38 and 1.01–1.12, respectively, the former being significantly larger than the latter. They suggested that such a difference is attributable to combined effects of the fluxes of turbulent exchange, assimilation, and plant and soil respiration, each with distinct exchange ratios, on the abundances of O2 and CO2 in canopy air. ERF is an important parameter to evaluate the net exchanges of O2 and CO2 between the atmosphere and the terrestrial biosphere, and the value of 1.10 is usually accepted as a global average. If ERF values of 1.26–1.38 of Seibt et al. (Citation2004) are applicable to many forest ecosystems, it is necessary to re-examine terrestrial biospheric/oceanic CO2 uptake and Atmospheric Potential Oxygen (APO=O2+1.1×CO2) (Stephens et al., Citation1998) calculated employing the 1.10 value.
To contribute to a better understanding of the terrestrial biospheric ER, we conducted soil chamber and branch bag measurements of the O2/N2 ratio and CO2 concentration at Takayama deciduous broadleaf forest site in central Japan (36°09′N, 137°25′E, 1420 m a.s.l.; designated as TKY in the AsiaFlux site code database). We also made continuous measurements of the atmospheric O2/N2 ratio and CO2 concentration at the site during a summer season. Using the data from these measurements, we calculated ER values of net assimilation and soil respiration and the ERatm values, and estimated ERF using a one-box canopy O2/CO2 budget model to compare with the obtained ERatm.
2. Methods
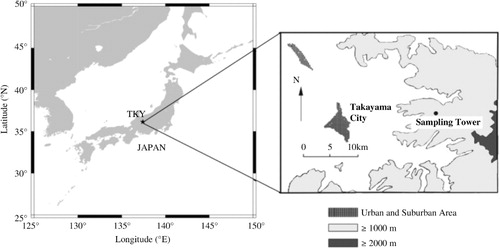
The TKY site is situated about 15 km east of a provincial city, Takayama, as shown in . Major tree species around the site are deciduous broad-leaved trees such as birch and oak, with a canopy height of about 15–20 m, and the ground is covered with bamboo grass. Budding and leaf shedding occur in May and October, respectively, and the ground is usually covered with snow from December to April. The forest has been protected from deforestation for more than 50 yr. The annual mean temperature and precipitation are about 6.4°C and 2100 mm, respectively. The rainy season takes place in the early summer when the site is strongly affected by the Asian monsoon. Possible influence of nearby anthropogenic sources on the atmospheric CO2 concentration at the site is estimated to be relatively small from previous numerical model simulations (Kondo et al., Citation2001). More detailed descriptions of the TKY site have already been given in our previous papers (e.g. Murayama et al., Citation2003, Citation2010). Continuous measurements of the net CO2 flux between the forest and the atmosphere, as well as of meteorological parameters, using a 27-m tall tower were first initiated in 1993 by employing an aero-dynamic method that was replaced in 1998 by an eddy covariance method (Yamamoto et al., Citation1999; Saigusa et al., Citation2005). The CO2 flux data taken at TKY are available from the AsiaFlux database (http://www.asiaflux.net/).
Fig. 1 Location of Takayama site (36°09′N, 137°25′E, 1420 m a.s.l., TKY) in central Japan.
To measure the O2/N2 ratio and CO2 concentration of soil respiration at the site, air samples were collected at two different places using a stainless-steel closed chamber with a volume of 100 l; one was placed on a small ridge and the other one in a small valley, separated by a distance of 60 m. Each chamber has a cover at its upper part, and it is connected to ambient atmosphere through a 1/16-inch O.D. stainless-steel tube to minimise the pressure imbalance between the soil air and the chamber air. About five air samples were taken from the chamber over a period of 30–60 minutes after closing the cover, using 250-ml Pyrex glass flasks with Viton O-ring seal stopcocks at both ends. During air sampling, we prevented exposing the chamber to direct sunlight using a parasol. As the volume of the chamber is sufficiently larger than the sampled air, it was assumed that an intrusion of ambient atmosphere into the chamber during the collection of air samples from inside the chamber had a negligible impact on the chamber air. Air samples were also collected to measure O2/N2 and CO2 of the net plant assimilation. The air sampling was conducted during the daytime by using a branch bag method on the leaves of Mongolian oak that is dominant around the site. Its branches were first inserted into a 30 l bag with two outlets, and a 100 l bag filled with ambient air was connected to one outlet of the 30 l bag. Both of the bags were made of transparent polyvinylidene difluoride. Each set of five air samples were collected over a period of 30 minutes, by introducing the air from the 30 l bag at a flow rate of 3 l min−1 using a diaphragm pump into 150-ml Pyrex glass flasks with Viton O-ring seal stopcocks at both ends. Water vapour contained in the sample air was removed using Mg(ClO4)2. The soil chamber measurements were carried out about once per month from August 2004 to October 2006, and from July 2011 to October 2012, while the branch bag measurements were performed eight times during the summer of 2011.
The collected flask samples were brought back to our laboratory and were analysed for the O2/N2 ratio and the CO2 concentration. The O2/N2 ratio is usually reported in per meg unit:1
where subscripts ‘sample’ and ‘standard’ indicate the sample air and the standard gas, respectively. Because O2 is 20.946% of air by volume, 4.8 per meg (=1/0.20946) corresponds to a change of 1 ppm. In this study, the ratio of 4.8 per meg ppm−1 was used to calculate the ER values using the observed δ(O2/N2). The δ(O2/N2) value of each air sample was determined against our working standard gas using a mass spectrometer (Finnigan MAT-252 or Thermo Scientific Delta-V). The measurement precision was estimated to be ±5.4 per meg (±1σ) (Ishidoya et al., Citation2003). The CO2 concentration was determined using the Delta-V for the leaf air samples with a precision of ±0.3 ppm (Ishidoya and Murayama, Citation2013), and using a gas chromatograph (Shimadzu GC-9A) equipped with a flame ionization detector and a methanizer for soil respiration air samples with a precision of ±0.2 ppm, against our air-based CO2 standard gas system maintained at Tohoku University (Tanaka et al., Citation1983; Nakazawa et al., Citation1991). By analysing air samples with a wide range of (O2/N2) ratios of 0.1–0.3 using the MAT-252, we have confirmed that δ(O2/N2) is linearly related to the (O2/N2) ratio, with uncertainties of less than ±2% (Ishidoya et al., Citation2003). From the estimated uncertainties, it is expected that the ER value can be determined with a precision of ±0.004 even for the soil respiration air with widely varying δ(O2/N2). Regarding the CO2 concentration, the non-linear output effects of the gas chromatograph and the Delta-V are negligibly small, since our standard gases fully cover the values measured in this study.
We also carried out continuous measurements of the atmospheric O2/N2 ratio at the TKY site using a fuel cell analyser (Sable Systems International, Oxzilla II) during the period 4 August–4 September 2012. The continuous O2 measurement system used is similar to that developed by Goto et al. (Citation2013). Sample air was taken from 8.8 m (inside the canopy) and 27 m (above the canopy) using diaphragm pumps, and the air intake set at each height was equipped with an aspirator to avoid different thermal diffusions of O2 and N2 due to radiative heating/cooling (Blaine et al., Citation2006). The sample air taken from each height was introduced into the O2 analyser at a flow rate of 80 ml min−1 and measured for 36 minutes to obtain eight data values of δ(O2/N2), followed by measurements of the standard gases for 14 minutes. After this, the sample air from the other height was analysed by the same procedure. The sample air pressure was stabilised to an order of 10−3 Pa using a flow regulation valve (HORIBA STEC, PV-1000) and a precise differential pressure sensor (Setra, 239). The temperature of the fuel cell was stabilised to 32±0.1°C using a Peltier control system. Our O2 measurement system is also equipped with a non-dispersive infrared analyser (LiCOR, LI-6262) to simultaneously measure the CO2 concentration of sample air with a precision of ±0.05 ppm.
The removal of water vapour from the sample air and the preparation of the standard gases adopted for the present O2 measurement system were different from those described in Goto et al. (Citation2013). Our sample dryer had two air flow paths, and each path was equipped with a water trap set in a Stirling cycle refrigerator (Twinbird, SC-UE15R). The flow paths were alternately switched, so that one trap was cooled at −85°C to remove water vapour from the sample air and the other trap was kept at room temperatures to discharge the melting ice by flowing ambient air dried by a heatless air dryer (CKD, HD-0.5) through it. By employing the sample dryer, the maintenance of the water trap was automated.
The standard gases were prepared by adding appropriate amounts of pure O2 or N2 to CO2 standard gases, which were mixtures of industrially purified air and CO2. The amount of O2 or N2 to be added to each standard gas was calculated based on the δ(O2/N2) of the ingredient air that was measured using the Delta-V. The output of the fuel cell O2 analyser depends on the amount of O2 available to diffuse across the membrane of the cell, and the O2 amount is closely related to the total pressure and O2 mole fraction of air in the cell. Therefore, to calculate δ(O2/N2) from the analyser output, it is necessary to evaluate the dilution effects caused by changes in gases other than O2 (Keeling et al., Citation1998; Manning et al., Citation1999). In this study, we took account of the dilution effects of CO2 and Ar for both the sample air and standard gas. The dilution effects of CO2 contained in the sample air and standard gases were calculated using their measured CO2 concentrations. However, we did not measure the Ar/N2 ratio (hereafter defined by δ(Ar/N2) in the same way as δ(O2/N2) for the O2/N2 ratio) of sample air at TKY. However, Keeling et al. (Citation2004) and Cassar et al. (Citation2008) reported that changes in the atmospheric δ(Ar/N2) are within several tens per meg on a global scale. Considering their observational results, we did not correct our measured δ(O2/N2) of the sample air for the dilution effect by changes in atmospheric Ar. The dilution effect of Ar on δ(O2/N2) of the sample air, arising from the standard gases with different δ(Ar/N2) values, was corrected by the following method. We first determined δ(Ar/N2) of the ingredient air of our standard gases using the Delta-V, and then compared the results with continuously measured values of natural air near the surface at Tsukuba (36°N, 140°E), Japan using the same mass spectrometer (Ishidoya and Murayama, Citation2013). From this comparison, we found differences of sever per mil between our standards and the ambient air. Therefore, to calculate δ(O2/N2) of the sample air from the analyser output, we used the formula;2
where V is the voltage output from the analyser, which represents the difference in O2 mole fraction between the sample air (or standard gas) and an arbitrary reference air, a is the span factor in units of per meg V−1, calculated by analysing high- and low-span standard gases with known O2 mole fractions, (δXAr) is the difference in CO2 (Ar) mole fraction of the sample air from the reference air, in ppm, and
is the standard mole fraction of O2 in dry air to be described below. δXCO2
and δXAr account for the respective dilution effects of changes in CO2 and Ar on the O2 mole fraction in the fuel cell. Equation (2) is the same as that used in Manning et al. (Citation1999) except for inclusion of δXAr. By assuming the standard mole fractions of N2, O2 and Ar in dry air to be 0.78084, 0.20946 and 0.00934, respectively (Nicolet, Citation1960; Machta and Hughes, Citation1970), the change of 1 per mil in δ(Ar/N2) corresponds to the change of about 9 ppm in δXAr, leading to the change of 12 per meg in δ(O2/N2). Therefore, the correction of δ(O2/N2) of the sample air due to our standard gases amounted to several tens per meg.
The precision of our continuous measurements of atmospheric δ(O2/N2) was estimated to be about ±7 per meg, which is worse than that in Goto et al. (Citation2013) (±1.4–1.9 per meg). The cause may be attributable to unstable room temperature inside the observation hut at TKY.
3. Results
3.1. Exchange ratios of O2:CO2 obtained from soil chamber and branch bag measurements
In this study, soil chamber and branch bag measurements were made 42 and eight times, respectively. The δ(O2/N2) and CO2 concentration data obtained from the respective measurements are shown in a and b. As mentioned above, five air samples were usually collected in sequence during each sampling. In these figures, the δ(O2/N2) and CO2 concentration values are expressed as deviations from the corresponding values obtained for the first air sample in each sampling group. By applying a linear regression analysis to the δ(O2/N2) and CO2 concentration values, the ER values of soil respiration and net assimilation were estimated to be 1.11±0.01 and 1.02±0.03 (±1σ), respectively. These values are significantly different at 99% confidence level. We did not observe any statistically significant difference between the ER values of soil respiration obtained at the two different places. As soil respiration amounts to about 90% of the ecosystem respiration (RE) at TKY (Saigusa et al., Citation2005), we have assumed that the ER value for RE (hereafter referred to as ‘ERR’) is equal to the soil respiration ER. The ERR value of 1.11±0.01 obtained in this study falls in the range of 1.06–1.22 found by Severinghaus (Citation1995) using a flow-through chamber under laboratory conditions. The value is, however, larger than 0.94±0.04 obtained from the soil chamber measurements in the Griffin forest by Seibt et al. (Citation2004).
Fig. 2 Relationships between δ(O2/N2) and CO2 concentration obtained from (a) soil chamber and (b) branch bag measurements. Solid lines denote the regression lines fitted to the data.
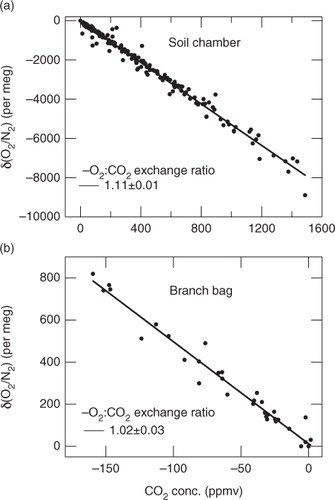
The photosynthesis ER, that is, for gross primary production (GPP) (hereafter referred to as ‘ERA’), is expected to be 1.00 from photochemical reaction and the Calvin–Benson–Bassham cycle (6CO2+12H2O→C6H12O6+6H2O+6O2). It is consistent with the ER value of 1.02±0.03 obtained at TKY for net assimilation. While Seibt et al. (Citation2004) reported ER values of 1.19±0.12 for the Griffin forest site and 1.08±0.16 for the Hainich National Park site based on branch bag measurements, their uncertainties are substantially larger than ours.
3.2. Continuous measurements of the atmospheric δ(O2/N2) and CO2 concentration
shows δ(O2/N2) and the CO2 concentration observed continuously at the 8.8 and 27 m tower heights during 4 August–4 September 2012. Spline smoothing was applied to the data and the 24-hour running means are also shown. As seen in the figure, the δ(O2/N2) and CO2 concentration values vary diurnally almost in opposite phase with each other. The daily maximum (minimum) of δ(O2/N2) (CO2 concentration) occurs during the daytime, due to O2 production (CO2 consumption) caused by GPP that is larger than RE (Murayama et al., Citation2003; Saigusa et al., Citation2005). Small diurnal amplitudes of δ(O2/N2) and CO2 were observed on the days with small photosynthetically active radiation (PAR). This also suggests that GPP is a main contributor to the diurnal cycles. It is also seen from that the δ(O2/N2) (CO2 concentration) values observed at 8.8 m are generally lower (higher) than the values at 27 m in the nighttime, due to the loss of O2 (accumulation of CO2) by soil respiration in the stable atmosphere near the ground. However, the daytime δ(O2/N2) and CO2 concentration values observed at 8.8 m are close to the values at 27 m, probably due to strong convective mixing.
Fig. 3 δ(O2/N2) and CO2 concentration observed at heights of 8.8 (red dots) and 27 m (blue dots) for the period 4 August–4 September 2012. Smoothing spline curves fitted to the observed data and their 24-hour running mean values are also shown. Δδ(O2/N2) (ΔCO2), representing the difference of the smoothing spline curve of the δ(O2/N2) (CO2 concentration) at 8.8 m from that at 27 m, is also plotted by black (orange) line, together with air temperature (black line) and PAR (green line) at 25 and 19.5 m heights, and 24-hour running mean values of air temperature are also plotted.
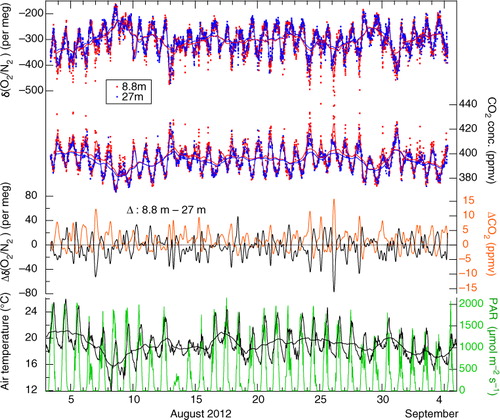
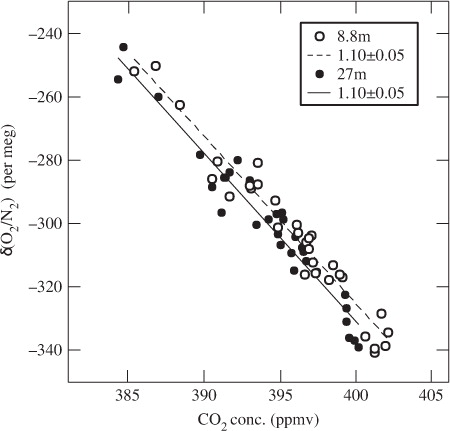
The 24-hour running means of the δ(O2/N2) and CO2 concentration values show day-to-day variations, their phases being opposite. It is also seen from that the day-to-day variations in the CO2 concentration are generally in phase with those of air temperature at 25 m, with a delay of about 1 d. If the phase of the CO2 variations is delayed by 1 d, then the correlation coefficient of the day-to-day variations between the air temperature and the CO2 concentration is calculated to be 0.7. This suggests that the day-to-day variations in δ(O2/N2) and CO2 are closely related with changes in RE, since RE at TKY is mostly a function of air temperature (Saigusa et al., Citation2005). To confirm our suggestion, we examined the relationship between the atmospheric δ(O2/N2) and CO2 concentration. From plots of the daily mean values of these variables shown in , an ERatm value of 1.10±0.05 (±1σ) is obtained for both heights of 8.8 and 27 m. This value of ERatm agrees well with the ER value derived from our soil chamber measurements (1.11±0.01). As described above, ERR can be approximated by the soil respiration ER at TKY. Therefore, the inter-diurnal variation in the daily mean δ(O2/N2) and CO2 concentration at TKY could be caused mainly by the variation in RE, at least for the observation period under discussion.
Fig. 4 Relationships between the daily mean values of δ(O2/N2) and CO2 concentration observed at 8.8 (open circles) and 27 m (closed circles).
4. Discussion and conclusions
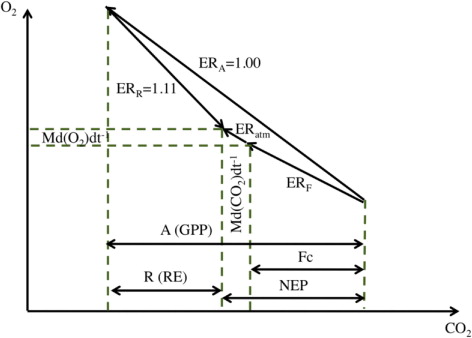
By treating the forest canopy air as a well-mixed reservoir unaffected by air–sea exchange and fossil fuel combustion, the respective budgets of CO2 and O2 in a forest ecosystem can be represented by3
and4
Here, A (µmol m−2 s−1), R (µmol m−2 s−1) and F c (µmol m−2 s−1) represent GPP, RE and net turbulent CO2 flux from the forest to the overlaying atmosphere, respectively. M (mol m−2) represents the number of moles per unit area contained in a column of air extending from the forest floor to the top of the canopy, and CO2 (µmol mol−1, or ppm) and O2 (µmol mol−1, or ppm) are the respective concentrations of CO2 and O2 of air in the same column. ERA and ERR have the same meanings as defined above, and ERF denotes the exchange ratio of −O2:CO2 for the net turbulent CO2 flux. In this study, the data obtained from the eddy covariance flux measurements at TKY were used for F c , and RE was calculated as a function of air temperature inside the canopy (Saigusa et al., Citation2005). GPP was obtained as the sum of net ecosystem production (NEP) and RE (GPP=NEP+RE), in which NEP was calculated from F c and Md(CO2)dt −1 (NEP=−(F c +Md(CO2)dt −1)). The canopy height was assumed to be 25 m, and ERR was taken to be 1.11 in accordance with the result shown in the preceding section. With respect to ERA, we preferred the value of 1.00 to 1.02 obtained from the branch bag measurements for net assimilation, since we regarded ERA as ER for photosynthesis assuming that leaf respiration, included in net assimilation, is a part of RE. The budgets of O2 and CO2 in a forest ecosystem, as expressed by eqs. (3) and (4), are shown schematically as a vector diagram in . The data in (discussed below) show that the net changes in O2 and CO2 (Md(O2)dt −1 and Md(CO2)dt −1) are generally very small (in magnitude) compared to changes in O2 and CO2 associated with NEP. Thus, the vector diagram makes it clear that if NEP is positive (negative), ERF must be smaller than 1.00 (larger than 1.11).
Fig. 5 Schematic vector diagram representing the contributions to O2 and CO2 budgets in a forest ecosystem.
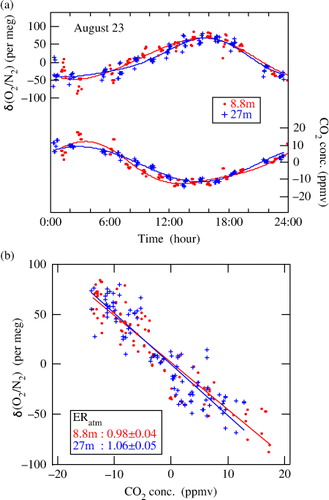
To examine the relationship between ERatm and ERF on a diurnal time scale, we first extracted intradiurnal components of δ(O2/N2) and CO2 concentration from their measured values, to calculate ERatm. The calculation involved subtracting 24-hour running mean values of each variable from the corresponding measured values. The diurnal cycles of the atmospheric δ(O2/N2) and CO2 concentration on 23 August 2012, obtained by detrending the data, are plotted in a, as a typical example of their diurnal cycles. Best-fit curves to the data, represented by the fundamental and its first harmonics (periods of 24 and 12 hours) terms, are also shown in the figure. As seen from a, δ(O2/N2) and CO2 vary diurnally almost in opposite phase. The relationships between the detrended values of δ(O2/N2) and CO2 are shown in b. By applying a linear regression to all the data over the whole day, ERatm was found to be 0.98±0.04 (±1σ) for 8.8 m and 1.06±0.05 (±1σ) for 27 m. These values are in a range of the ERatm values reported in previous studies (Seibt et al., Citation2004; Kozlova et al., Citation2005; Stephens et al., Citation2007). The ERatm values calculated for the time intervals of 6:00–18:00 and 18:00–6:00 at 8.8 (27) m are 1.01±0.05 (1.12±0.07) and 0.90±0.10 (1.04±0.11), respectively. Considering the uncertainties, the daytime and nighttime ERatm values are not significantly different from each other at both heights.
Fig. 6 (a) Diurnal cycles of δ(O2/N2) and CO2 concentration observed at 8.8 and 27 m in the forest canopy on 23 August 2012 (circles), together with their best-fit curves (solid lines). (b) Relationships between δ(O2/N2) and CO2 concentration shown in (a). Solid lines denote the regression lines fitted to the data.
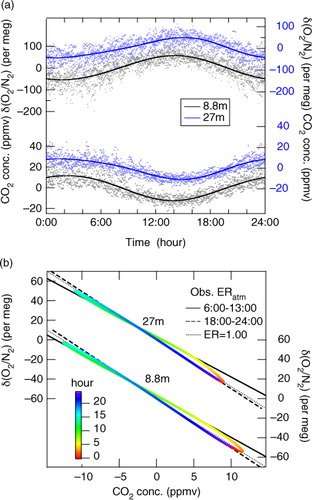
After detrending, the data for all the days in this study were combined in a ‘climatology’ of the diurnal cycle. The cycles for both O2 and CO2 are shown in a along with the two-harmonic fits. The average diurnal cycles of δ(O2/N2) and CO2 at 8.8 (27) m height show peak-to-peak amplitudes of 111±6 (94±6) per meg and 24.2±1.2 (20.0±1.0) ppm, respectively. By approximating the relationship between the δ(O2/N2) and CO2 concentration shown in a by a linear line, we found the average value of ERatm over the observation period to be 0.94±0.01 at 8.8 m and 0.96±0.01 at 27 m. b shows the relationships between the best-fit curves of δ(O2/N2) and CO2 concentration values shown in a. It is clearly seen in b that the ERatm value obtained from the average diurnal cycles of both variables is smaller in the daytime (6:00–13:00) than in the nighttime (18:00–24:00). It was also found that the daytime ERatm values at both heights are clearly lower than ERA (1.00). The ERatm values at 8.8 m (27 m) for the time intervals of 6:00–13:00 and 18:00–24:00 were calculated to be 0.87±0.02 and 1.03±0.02 (0.86±0.02 and 1.05±0.02), respectively, by applying a linear regression analysis to the δ(O2/N2) and CO2 concentration data shown in a.
Fig. 7 (a) Plots of diurnal cycle component values of δ(O2/N2) and CO2 concentration observed at 8.8 and 27 m heights for the period 4 August–4 September 2012, and their best-fit curves, and (b) relationships between the best-fit curves of the two variables. In (b), the colour scale denotes the time of the day, and black solid, dashed and dotted lines indicate the relationships derived from the data for the periods 6:00–13:00 and 18:00–24:00 and expected from the exchange ratio of 1.00, respectively.
As mentioned above, ERF is used to estimate regional (and global) CO2 fluxes from changes in O2 and CO2 in the well-mixed troposphere, and it is not directly measurable at present. We calculated the average diurnal variation of ERF by performing a one-box budget model analysis, expressed by eqs. (3) and (4) and illustrated in , using values of GPP, RE, Md(O2)dt
−1 and Md(CO2)dt
−1 obtained for the observation period; we then compared ERF and ERatm. To obtain average diurnal variations of GPP and RE, the same procedure as employed above for δ(O2/N2) and CO2 was applied to these variables. The values of Md(O2)dt
−1 and Md(CO2)dt
−1 were derived respectively from the average diurnal cycles of the atmospheric δ(O2/N2) and CO2 concentration observed at 8.8 m. The average diurnal variations of ERF, GPP, RE, NEP, Md(O2)dt
−1 and Md(CO2)dt
−1 are shown in . Also shown in this figure is the ERF for the daily-integrated net turbulent flux (hereafter referred to as ‘daily mean ERF’), along with the ERatm values at 8.8 m shown in b for the time intervals of 6:00–13:00 and 18:00–24:00 averaged over the observational period. The daily mean ERF is obtained by dividing the daily-integrated values of the net turbulent O2 flux [F
o=F
c
×ERF, calculated from eq. (4)] by that of net turbulent CO2 flux [F
c
from eq. (3)] as follows:5
Fig. 8 Calculated average ERF values (red lines) and average observed ERatm values (black solid lines) for the time intervals of 6:00–13:00 and 18:00–24:00 at 8.8 m height for the period 4 August–4 September 2012. Average diurnal variations of GPP, RE, NEP (blue, brown, green solid lines), Md(O2)dt −1 and Md(CO2)dt −1 (grey solid and dashed lines) are also shown in lower part of the figure. The time-varying ERF values (red solid line) are calculated using eqs. (3) and (4) and the average diurnal variations of GPP, RE, Md(O2)dt −1 and Md(CO2)dt −1. The daily mean ERF value (red dashed line) is the ratio of the daily-integrated net turbulent O2 and CO2 fluxes calculated from eqs. (3) and (4) (see text).
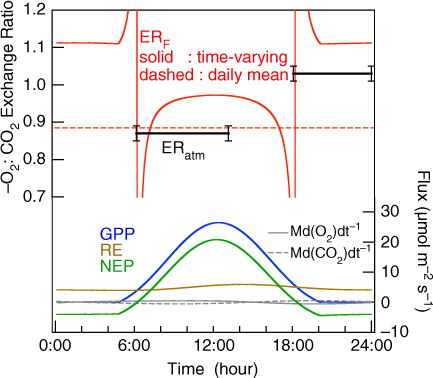
In eq. (5), the time integration range is from 0:00 to 24:00. Therefore, the daily mean ERF is flux-weighted value and not consistent with a simple daily average of the temporally different ERF values. The time periods of 6:00–13:00 and 18:00–24:00 correspond to the times when the atmospheric δ(O2/N2) monotonically increases and decreases (see ), respectively, as well as when the absolute magnitude of A-R is greater than F c (see ). The ERF value is found to be lower in the daytime than in the nighttime, similar to ERatm, and the average daily mean ERF value of 0.89 agrees with an average ERatm value for 6:00–13:00 (0.87±0.02). In contrast to our results, Seibt et al. (Citation2004) found that there are large differences between ERatm (~1.0) and ERF (1.26 to 1.38) at the Griffin forest site. The difference between the ERF values reported by Seibt et al. (Citation2004) and our study is mainly ascribed to the fact that we employed 1.00 for ERA and 1.11 for ERR in our one-box model analysis, while Seibt et al. (Citation2004) used the corresponding values of 1.19 and 0.94, based on their branch bag and soil chamber measurements.
In this study, we closely examined the conversion between O2 and CO2 in a Japanese cool temperate deciduous forest ecosystem. The ER value for soil respiration was found to be 1.11±0.01, which is larger than that for net assimilation (1.02±0.03). The average ERatm value, as well as the average ERF calculated using a one-box canopy O2/CO2 budget model on the assumption that ER is 1.00 for GPP (ERA) and 1.11 for RE (ERR), was clearly lower in the daytime than in the nighttime. The averaged ERatm over the time interval of 6:00–13:00 was also found to be in agreement with the averaged daily mean ERF. Our results also suggest that APO (Stephens et al., Citation1998), which has been often used to estimate the global CO2 budget and the air-sea O2 flux (e.g. Manning and Keeling, Citation2006; Ishidoya et al., Citation2012b), should be re-examined. APO is defined by assuming that ER for net O2 and CO2 fluxes caused by terrestrial biospheric activities (ERF in this study) is 1.1 on average. However, our results indicate that the daily mean ERF could be significantly different depending on ERR and daily-integrated values of GPP and RE, since ERA is a constant value of 1.00 and the daily-integrated Md(O2)dt −1 and Md(CO2)dt −1 are zero. If we assume 0.9 for the global average ERF to calculate APO, instead of the widely accepted value of 1.1, then the terrestrial biospheric CO2 uptake of 1.0±0.8 GtC yr−1 and the oceanic CO2 uptake of 2.5±0.7 GtC yr−1 reported by Ishidoya et al. (Citation2012a) for the period 2000–2010 are increased and decreased by 0.22 GtC yr−1, respectively. This change in ERF reduces the discrepancy between the oceanic CO2 uptake estimated from the APO method (Ishidoya et al., Citation2012a, Citationb) and ocean models (Sarmiento et al., Citation2010). Therefore, it is important not only to perform further observations with high precision to determine ERatm but also to directly estimate ERF by conducting simultaneous measurements of CO2 and O2 turbulent fluxes in various forests.
5. Acknowledgments
The authors thank K. Muto and T. Usami (National Institute of Advanced Industrial Science and Technology, Japan) for their support to measurements. This study was partly supported by the Grants-in-Aid for Creative Scientific Research (2005)/17GS0203), the Grants-in-Aid for Scientific Research (2010/22710002 and 2012/24241008), the subsidized project ‘Formation of a virtual laboratory for diagnosing the earth's climate system’ of the Ministry of Education, Science, Sports and Culture, Japan, and the Global Environment Research Account for National Institutes of the Ministry of the Environment, Japan.
Related Research Data
References
- Battle M , Bender M , Sowers T , Tans P. P , Butler J. H , co-authors . Atmospheric gas concentrations over the past century measured in air from firn at the South Pole. Nature. 1996; 383(6597): 231–235.
- Battle M, Bender M. L, Tans P. P, White J. W. C, Ellis J. T, co-authors. Global carbon sinks and their variability inferred from atmospheric O2 and δ13C. Science. 2000; 287: 2467–2470. [PubMed Abstract].
- Bender M. L , Ho D. T , Hendricks M. B , Mika R , Battle M. O , co-authors . Atmospheric O2/N2 changes, 1993–2002: implications for the partitioning of fossil fuel CO2 sequestration. Glob. Biogeochem. Cycles. 2005; 19: 4017.
- Blaine T. W , Keeling R. F , Paplawsky W. J . An improved inlet for precisely measuring the atmospheric Ar/N2 ratio. Atmos. Chem. Phys. 2006; 6: 1181–1184.
- Cassar N , Mckinley G. A , Bender M. L , Mika R , Battle M . An improved comparison of atmospheric Ar/N2 time series and paired ocean–atmosphere model predictions. J. Geophys. Res. 2008; 113: 21122.
- Goto D , Morimoto S , Ishidoya S , Ogi A , Aoki S , co-authors . Development of a high precision continuous measurement system for the atmospheric O2/N2 ratio and its application at Aobayama, Sendai, Japan. J. Meteorol. Soc. Jpn. 2013; 91: 179–192.
- Ishidoya S , Aoki S , Goto D , Nakazawa T , Taguchi S , co-authors . Time and space variations of the O2/N2 ratio in the troposphere over Japan and estimation of global CO2 budget. Tellus B. 2012a; 64: 18964.
- Ishidoya S , Aoki S , Nakazawa T . High precision measurements of the atmospheric O2/N2 ratio on a mass spectrometer. J. Meteorol. Soc. Jpn. 2003; 81: 127–140.
- Ishidoya S , Morimoto S , Aoki S , Taguchi S , Goto D , co-authors . Oceanic and terrestrial biospheric CO2 uptake estimated from atmospheric potential oxygen observed at Ny-Alesund, Svalbard, and Syowa, Antarctica. Tellus B. 2012b; 64: 18924.
- Ishidoya S , Murayama S . Development of a new high precision continuous measuring system for atmospheric O2/N2 and Ar/N2 and its application to the observation in Tsukuba, Japan. submitted to Tellus B. 2013
- Keeling R. F . Development of an Interferometric Oxygen Analyzer for Precise Measurement of the Atmospheric O2 Mole Fraction. PhD Thesis. 1988; Cambridge: Harvard University.
- Keeling R. F , Blaine T , Paplawsky B , Katz L , Atwood C , co-authors . Measurement of changes in atmospheric Ar/N2 ratio using a rapid-switching, single-capillary mass spectrometer system. Tellus B. 2004; 56: 322–338.
- Keeling R. F , Manning A. C , McEvoy E. M , Shertz S. R . Methods for measuring changes in atmospheric O2 concentration and their application in southern hemisphere air. J. Geophys. Res. 1998; 103: 3381–3397.
- Keeling R. F , Piper S. C , Heimann M . Global and hemispheric CO2 sinks deduced from changes in atmospheric O2 concentration. Nature. 1996; 381(6579): 218–221.
- Keeling R. F , Shertz S. R . Seasonal and interannual variations in atmospheric oxygen and implications for the global carbon cycle. Nature. 1992; 358: 723–727.
- Kondo H , Saigusa N , Murayama S , Yamamoto S , Kannari A . A numerical simulation of the daily variation of CO2 in the central part of Japan summer case. J. Meteorol. Soc. Jpn. 2001; 79: 11–21.
- Kozlova E , Manning A. C , Jordan A , Brand W . Investigations of the land biotic O2:CO2 exchange ratios in photosynthesis and respiration. Proceedings (CD) of 7th International Carbon Dioxide Conference. 2005; CO: Boulder. September 25–30.
- Kozlova E. A , Manning A. C , Kisilyakhov Y , Seifert T , Heimann M . Seasonal, synoptic, and diurnal-scale variability of biogeochemical trace gases and O2 from a 300-m tall tower in central Siberia. Glob. Biogeochem. Cycles. 2008; 22: 4020.
- Langenfelds R. L , Francey R. J , Steele L. P , Battle M , Keeling R. F , co-authors . Partitioning of the global fossil CO2 sink using a 19-year trend in atmospheric O2 . Geophys. Res. Lett. 1999; 26(13): 1897–1900.
- Machta L, Hughes E. Atmospheric oxygen in 1967 to 1970. Science. 1970; 168: 1582–1584. [PubMed Abstract].
- Manning A. C , Keeling R. F . Global oceanic and terrestrial biospheric carbon sinks from the Scripps atmospheric oxygen flask sampling network. Tellus B. 2006; 58: 95–116.
- Manning A. C , Keeling R. F , Severinghaus J. P . Precise atmospheric oxygen measurements with a paramagnetic oxygen analyzer. Glob. Biogeochem. Cycles. 1999; 13: 1107–1115.
- Murayama S , Saigusa N , Chan D , Yamamoto S , Kondo H , co-authors . Temporal variations of atmospheric CO2 concentration in a temperate deciduous forest in central Japan. Tellus B. 2003; 55: 232–243.
- Murayama S , Takamura C , Yamamoto S , Saigusa N , Morimoto S , co-authors . Seasonal variations of atmospheric CO2, δ13C, and δ18O at a cool temperate deciduous forest in Japan: influence of Asian monsoon. J. Geophys. Res. 2010; 115: 17304.
- Nakazawa T , Aoki S , Murayama S , Fukabori M , Yamanouchi T , co-authors . The concentration of atmospheric carbon dioxide at Japanese Antarctic station, Syowa. Tellus B. 1991; 43: 126–135.
- Nicolet M , Ratcliffe J. A . The properties and constitution of the upper atmosphere. Physics of the Upper Atmosphere. 1960; Elsevier, New York. 17–71.
- Saigusa N , Yamamoto S , Murayama S , Kondo H . Inter-annual variability of carbon budget components in and ASIAFLUX forest site estimated by long-term flux measurement. Agr. Forest. Meteorol. 2005; 134: 4–16.
- Sarmiento J. L , Gloor M , Gruber N , Beaulieul C , Jacobson A. R , co-authors . Trends and regional distributions of land and ocean carbon sinks. Biogeosciences. 2010; 7: 2351–2367.
- Seibt U , Brand W. A , Heimann M , Lloyd J , Severinghaus J. P , co-authors . Observations of O2:CO2 exchange ratios during ecosystem gas exchange. Glob. Biogeochem. Cycles. 2004; 18: 4024.
- Severinghaus J . Studies of the Terrestrial O2 and Carbon Cycles in Sand Dune Gases and in Biosphere 2. 1995; New York: Columbia University. PhD Thesis.
- Stephens B , Keeling R , Heimann M , Six K , Murnane R , co-authors . Testing global ocean carbon cycle models using measurements of atmospheric O2 and CO2 concentration. Glob. Biogeochem. Cycles. 1998; 12(2): 213–230.
- Stephens B. B , Bakwin P. S , Tans P. P , TecLaw R. M , Baumann D . Application of a differential fuel-cell analyzer for measuring atmospheric oxygen variations. J. Atmos. Ocean. Tech. 2007; 24: 82–94.
- Sturm P , Leuenberger M , Schmidt M . Atmospheric O2, CO2 and δ13C observations from the remote sites Jungfraujoch, Switzerland, and Puy de Dôme, France. Geophys. Res. Lett. 2005; 32: 17811.
- Tanaka M , Nakazawa T , Aoki S . High quality measurements of the concentration of atmospheric carbon dioxide. J. Meteorol. Soc. Jpn. 1983; 61: 678–685.
- Tohjima Y , Mukai H , Nojiri Y , Yamagishi H , Machida T . Atmospheric O2/N2 measurements at two Japanese sites: estimation of global oceanic and land biotic carbon sinks and analysis of the variations in atmospheric potential oxygen (APO). Tellus B. 2008; 60: 213–225.
- van der Laan-Luijkx I. T , Karstens U , Steinbach J , Gerbig C , Sirignano C , co-authors . CO2, δO2/N2 and APO: observations from the Lutjewad, Mace Head and F3 platform flask sampling network. Atmos. Chem. Phys. 2010; 10: 10691–10704.
- Yamamoto S , Murayama S , Saigusa N , Kondo H . Seasonal and inter-annual variation of CO2 flux between a temperate forest and the atmosphere in Japan. Tellus B. 1999; 51: 402–413.