Abstract
In this work, a statistical study of aerosol optical properties retrieved from Raman lidar profiles has been addressed at the EARLINET station of Granada, Spain, during the period 2008–2010. Lidar measurements were performed during day- and night-time. Mean values and variances of the aerosol extinction and backscatter coefficient profiles in the troposphere have been computed. These profiles evidenced that during autumn–winter, most of the particles are confined to the first kilometres above the surface (below 3500 m above sea level), while a major presence of aerosol at higher altitudes is observed during spring–summer. Moreover, a study of the planetary boundary layer (PBL) height and aerosol stratification has been performed for the whole studied period. Monthly mean β-related Angström exponent values have been obtained for aerosols in the PBL and in the free troposphere. Furthermore, monthly mean lidar ratio values at 532 nm have been retrieved from Raman profiles during night-time. A detailed study of these intensive properties has allowed characterizing the aerosol present over our station. The results evidenced a predominance of large and scattering particles during spring and summer and an increase of small and absorbing particles during autumn and winter.
1. Introduction
Atmospheric aerosols play an important role in the atmospheric radiation budget. Depending on the aerosol type, they can absorb or scatter the incoming and outgoing radiation, leading to a warm or cool Earth–Atmosphere system. Furthermore, depending on their properties, the atmospheric aerosols can act as condensation nuclei and/or ice-forming nuclei, modifying cloud physical and radiative properties (Kaufman et al., Citation2002). The uncertainties in aerosol radiative forcing are of the same magnitude of the effects themselves (Foster et al., Citation2007). This uncertainty is mainly caused by the lack of adequate information regarding the temporal and spatial distributions of aerosols and their associated properties across the globe (Pilinis et al., Citation1995). Moreover, the radiative forcing by natural and anthropogenic aerosols exhibits a strong seasonal and geographical variability and locally can even be higher than that of greenhouse gases (Ramanathan et al., Citation2001).
Aerosol profiling with high resolution, both in time and space, provided by lidar techniques is an indispensable tool to study the vertical structure of the aerosol field and its temporal and spatial evolution (Pappalardo et al., Citation2010). Moreover, lidar techniques allow for penetrating optically thin clouds, therefore, it is possible to study the aerosol–cloud interactions and aerosol's indirect effects on the radiation budget (Spinhirne et al., Citation2005).
The lidar measurements presented in this study were performed in the city of Granada [Southeastern Spain, 37.16°N, 3.6°W, 680 m above sea level (a.s.l.)]. This Raman lidar was incorporated to the European Aerosol Lidar Network (EARLINET) in April 2005. The measurements used in this study were acquired under a prefixed schedule based on 2 day-time observations and three night-time observations every 16 days. This set of lidar measurements has been used to perform a study of optical properties during day- and night-time.
In this article, the lidar measurements over a period of 3 yr (2008–2010) have been analyzed to statistically characterize the atmospheric aerosol in the urban environment of Granada. This is the first study in the southwestern Mediterranean basin that addresses the statistical study of the vertical profiles of aerosol optical properties. In Section 2, we briefly describe the measurements and methodology used for deriving aerosol optical properties from Raman lidar measurements. In Section 3, we discuss in detail the results obtained from the 3 yr of measurements. Mean values and variances of the aerosol extinction and backscatter coefficients in the lower troposphere are presented. Aerosol properties like extinction-to-backscatter ratios (lidar ratio, LR) and Ångström exponents have allowed for characterizing different aerosol types. Finally, Section 4 presents the conclusions of this work.
2. Measurements and methodology
Data presented in this study were collected at the Andalusian Centre for Environmental Research located in the city of Granada (Spain, 37.16°N, 3.6°W, 680 m a.s.l.). Granada is a non-industrialized medium-sized city, with a population of 240,000 inhabitants or 350,000 if you include the metropolitan area. The city is situated in a natural basin surrounded by mountains with elevations between 1000 and 3500 m a.s.l. The study area is also at a short distance in a straight line, about 200 km away from the African continent and approximately 50 km away from the western Mediterranean basin. Granada is affected by two major aerosol types: natural dust, mainly from North Africa, and anthropogenic pollutants from Europe (Alados-Arboledas et al., Citation2003; Lyamani et al., Citation2006a, Citation2010; Perez-Ramirez et al., Citation2012; Titos et al., Citation2012). Moreover, the Mediterranean basin can represent an additional source of atmospheric aerosol due to its complex meteorology that favours the ageing of polluted air masses and induces high-level concentrations of airborne particles (Lyamani et al., Citation2006b).
Aerosol vertical profiling was performed by means of a multiwavelength Raman lidar model LR331D400 (Raymetrics S.A., Greece). The system is configured in a monostatic, biaxial alignment pointing vertically to the zenith. An Nd:YAG laser emits pulses at 1064 nm (110 mJ), 532 nm (65 mJ) and 355 nm (60 mJ) simultaneously, firing laser shots with a repetition rate of 10 Hz. A 0.4-m-diameter Cassegrain telescope collects radiation backscattered by atmospheric molecules and particles. The receiving subsystem also includes a wavelength separation unit with dichroic mirrors, interferential filters and a polarization cube. Detection is carried out in seven channels corresponding to elastic wavelengths at 1064 nm, 532 nm (parallel- and perpendicular-polarized) and 355 nm, and to inelastic wavelengths at 607 nm (nitrogen Raman-shifted signal excited by radiation at 532 nm), 387 (nitrogen Raman-shifted signal excited by radiation at 355 nm) and 408 nm (water-vapour Raman-shifted signal excited by radiation at 355 nm). The instrument operates with a spatial vertical resolution of 7.5 m. Due to the instrument setup, the incomplete overlap between the laser beam and the receiver field of view limits the lowest observations (full overlap is overlap at 970 m above ground). Correction of the overlap effect is performed by applying the procedure suggested by Wandinger and Ansmann (Wandinger and Ansmann, Citation2002; Navas-Guzmán et al., Citation2011a). This Raman lidar has participated in the EARLINET ASOS (European Aerosol Research Lidar Network–Advanced Sustainable Observation System) project and currently is involved in the ACTRIS (Aerosols, Clouds, and Trace gases Research InfraStructure Network) European project. Further details in relation to this instrument can be found in Guerrero-Rascado et al. (Citation2008).
This lidar system provides vertical profiles of the particle backscatter and extinction coefficients at 355 and 532 nm at night-time by using the Raman lidar method (Ansmann et al., Citation1992) and the corresponding extinction-to-backscatter ratios (LRs). At day-time, the inversions at 355, 532 and 1064 nm have been performed with the elastic backscatter lidar method (Klett, Citation1981; Fernald, Citation1984; Sasano and Nakane, Citation1984), including a synergetic approach with sun-photometer data to select an appropriate LR value (Marenco et al., Citation1997; Landulfo et al., Citation2003; Guerrero-Rascado et al., Citation2008). The calibration of lidar signals is typically performed in the far height range, where the presence of particles is negligible. However, signals at 1064 nm usually present a low signal-to-noise ratio at these altitudes, and therefore it is not possible to use this range to calibrate the infrared channel in some cases. In this study, we use an alternative calibration for the infrared channel based on the estimation of the backscatter at a given height, derived from the retrieved backscatter-related Angström exponent at 355 and 532 nm (Navas-Guzmán et al., Citation2011b). The accuracy of the derived extinction and backscatter profiles is approximately 20 and 15%, respectively. The LR has maximum errors of 30% (Alados-Arboledas et al., Citation2011). Another variable presented in this work is the backscatter-related Angström exponent (β-AE) (Ansmann et al., Citation2003). This parameter depends on the size of the particles and takes lower values for larger particles.
This article presents a study on the differences in the aerosol optical properties in the planetary boundary layer (PBL) and in the free troposphere (FT). Thus, in this work the PBL height has been derived from lidar profiles using the Wavelet Covariance Transform (WCT) method (Morille et al., Citation2007; Baars et al., Citation2008; Granados-Muñoz et al., Citation2012). This method was also used in this study to detect lofted aerosol layers decoupled of the PBL.
Data presented in this article correspond to the period from January 2008 to December 2010. A total of 68 Raman lidar observations were collected during night-time (150 minutes for each session). Aerosol extinction, backscatter and LR profiles were derived by the Raman technique. A typical averaging time of 30 minutes is performed to the signals to obtain the lidar profiles. A total of 141 at 532 nm and 77 at 355 nm Raman profiles were satisfactorily inverted. The number of Raman profiles at 355 nm was lower than those measured at 532 nm due to problems related to the quality of the nitrogen Raman-shifted signal at 387 nm that affected the system during some periods. When it was not possible to obtain high-quality Raman profiles, the backscatter coefficient profiles have been retrieved using the elastic retrieval. During the day, a total of 50 observations (150 minutes for each session) were performed along these 3 yr of data. An integration time of 30 minutes was also applied to the lidar signals and the elastic lidar profiles were retrieved using the Klett–Fernald–Sassano procedure, as explained above. During the period 2008–2010, 340 measurements were scheduled and 118 (30%) were performed and satisfactorily inverted. Missing data during these 3 yr were mainly related to bad weather conditions (low clouds: 37%; rain 20%) and system maintenance (43%).
shows in detail the number of profiles satisfactorily inverted for the period 2008–2010. Day- and night-time measurements are denoted as ‘D’ and ‘N’, respectively. The profile type, elastic or Raman profile, is labelled as ‘b’ and ‘e’, respectively. The numbers do not reflect the number of measurements performed, but the number of quality-assured inversions obtained from the measurements performed.
Table 1. Number of profiles satisfactorily inverted during day- and night-time in the period 2008–2010.
3. Results and discussion
3.1. Mean vertical lidar profiles
In this section, we present the mean profiles of backscatter from day- and night-time measurements and those of extinction and LR at 532 nm from night-time measurements for the period 2008–2010. For this study, the whole year has been divided into two periods: from October to March (autumn and winter) and from April to September (spring and summer). This division of the year has proved to be the most appropriate to show the seasonal variability of the profiles of optical properties in our station (Lyamani et al., Citation2010; Perez-Ramirez et al., Citation2012).
First, we present the profiles retrieved from night-time measurements by applying the Raman algorithm to all night-time measurements when the Raman channel was available. Because of the variability of the height range with reliable data (due to the incomplete overlap), backscatter and extinction profiles are presented only above the height where all the profiles contributed to the computation of the mean profiles to avoid a bias. Particle backscatter coefficients are given above 1500 m a.s.l. and the particle extinction coefficient above 1900 m a.s.l., being our station 680 m a.s.l. This choice of the start height also avoids any problem related to incomplete overlap. However, the top height for our analyses was 6000 m a.s.l., assuming zero values for those profiles that did not provide aerosol information up to this altitude.
The mean profiles for particle extinction and backscatter coefficients (thick, solid lines) and LRs (black squares) at 532 nm are shown in . Bars denote the associated standard deviation. For LR, the mean values for layers at different heights are shown; each value has been calculated as the mean value for a layer of 500 m. The number of LR measurements available in each altitude has been indicated in parenthesis.
Fig. 1 (a) Autumn–winter and (b) spring–summer mean vertical profiles for different optical properties at 532 nm during night-time at Granada. The number of lidar ratio (LR) measurements available in each altitude has been indicated in parenthesis. Exponential fits (red lines) to the mean extinction profiles and fit parameters are given in addition. H and b denote height and scale height (km), respectively.
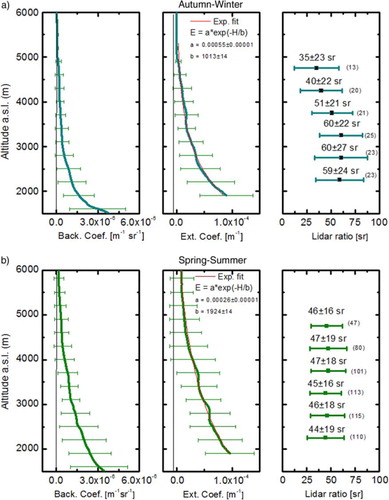
The mean particle extinction and backscatter profiles for autumn–winter (a) indicate that most particles are confined to the first few kilometres above the surface while the profiles in spring–summer (b) show the presence of particles at higher altitudes. The largest values for the particle extinction and backscatter coefficients are observed at the lowest altitudes sounded, being the values for both seasons that are really similar (~9×10⁻⁵ m−1 for the extinction and ~3.8×10⁻⁶ m−1sr−1 for the backscatter coefficient). Moreover a clear, exponential decrease is observed for the mean extinction coefficients in both seasons (red line). This behaviour was also observed in other statistical lidar studies (Mattis et al., Citation2004; Amiridis et al., Citation2005). Scale heights of 1013 m and 1924 m (almost twofold) above ground level (a.g.l.) have been obtained for autumn–winter and spring–summer, respectively. This parameter indicates the altitude where most of the aerosol resides and corroborate that the particles reached higher altitudes in spring–summer than in autumn–winter. Similar behaviour in the vertical profiles of particle extinction and backscatter coefficients was observed in a seasonal study performed by means of a Raman lidar over Northeastern Spain (Sicard et al., Citation2011). This result could be caused by two factors: first, the PBL height reaches higher values during the warm seasons than during cold seasons at our station (Granados-Muñoz et al., Citation2012), therefore particles reach higher altitudes. Second, from April to September long-range transported particles are also more frequent than for the rest of the year over our station. Saharan dust and forest-fire smoke are the main particles contributing at high altitudes over our station, causing marked particle loads in the FT (Guerrero-Rascado et al., Citation2009; Alados-Arboledas et al., Citation2011). The variability in the likelihood of dust events could also be the cause of the large standard deviation associated with particle extinction and backscatter profiles in spring and summer.
The mean LR values in autumn–winter (a) show a large variability, ranging between 35 and 60 sr. This variability indicates the presence of different aerosol types. Large LR values are associated with highly light-absorbing particles while low LR values are indicative of particles which present greater scattering (Franke et al., Citation2003; Müller et al., Citation2003). The highest values, around 60 sr, are observed between 2 and 3.5 km a.s.l. These large values may be the result of the long-range transport of light-absorbing particles generated by agricultural biomass burning, which are typical during winter in the south of the Iberian Peninsula. Similar large values were observed above the PBL in autumn at Gwangju (Korea) (Noh et al., Citation2008). However, lower LR values are observed above 3.5 km a.s.l. The mean LR values at these altitudes ranged between 35 and 50 sr and are typical of more transparent particles. In our area, these values can be attributed to long-range transport of mineral dust (Mona et al., Citation2006; Müller et al., Citation2007a; Guerrero-Rascado et al., Citation2009).
The mean LR values in spring–summer (b) show a very constant value around 46 sr for the whole profile although with a large standard deviation. LR is quite dependent on the chemical and morphological particle properties, and the mean values found for spring–summer indicate a strong contribution of mineral dust (Müller et al., Citation2007a). The origin could be, as mentioned previously, the Saharan dust outbreaks that affect our region during these months. In fact, these LR values are very similar to those observed in other dust studies performed in other stations of Europe and Asia (Noh et al., Citation2008; Papayannis et al., Citation2008; Guerrero-Rascado et al., Citation2009; Müller et al., Citation2010; Preißler et al., Citation2013). We note that the values observed here are slightly lower than those observed for pure Saharan dust particles (~55 sr at 532 nm, Groß et al., 2011) and it suggests a mixture of dust and other scattering particles, for example, marine particles or pollution (Rodríguez et al., Citation2011).
shows the mean elastic backscatter profiles for autumn–winter and spring–summer at 355, 532 and 1064 nm and the derived mean β-AE at 355–532 nm retrieved from day-time measurements. A seasonal classification similar to that performed in night-time measurements has been carried out. Seasonal differences in the profile shape, similar to those detected at night-time from Raman analysis, are observed in the particle backscatter profiles at the three wavelengths. In autumn–winter (a), most of the particles are confined to the first kilometres. In fact, a marked decrease is observed around 2.5 km a.s.l. at the three wavelengths. Above 3.5 km, a.s.l. the aerosol content is significantly reduced during these seasons. The large β-AE values observed (>1.5) in c, indicate an important contribution of small particles (e.g. anthropogenic aerosol or biomass burning) in autumn–winter.
Fig. 2 (a) Autumn–winter and (b) spring–summer mean backscatter profiles at 355, 532 and 1064 nm for day-time measurements. Mean β-AE (355–532 nm) in autumn–winter (c) and spring–summer (d).
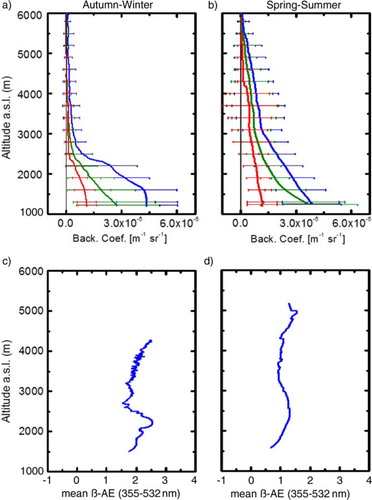
In spring and summer, the elastic backscatter profiles (b) present a higher variability in the far height range (above 3 km, a.s.l.). This could be due to a higher frequency of long-range transport of particles during these seasons, causing greater variability in the profiles. The lower β-AE values observed for these seasons (d) indicate that the particle sizes are larger than those observed during autumn–winter. It could be explained by the major presence of dust particles during spring–summer in our region. Moreover, the LR values at 532 nm observed during the night and the mean β-AE values (~1.0) showed in d suggest that these dust particles could be mixed with other particles as marine or pollution. It is interesting to note that there is a decrease in the β-AE values in the range 3.0–4.5 km a.s.l. in spring–summer, which could be produced for a major contribution of mineral dust in this range. Similar results were also observed in the β-AE vertical profiles obtained over Thessaloniki (Greece) (Giannakaki et al., Citation2010) and over Evora (Portugal) (Preißler et al., Citation2013).
3.2. PBL height and stratification
An analysis of the vertical aerosol layering over our region has been performed. The WCT-based method mentioned in Section 2 was used for the aerosol layering detection. During day-time, the top of the well-mixed PBL has been obtained. During night-time under non-convective conditions, the aerosol layer consists of the shallow nocturnal PBL (top height at about 200 m) and the so-called residual layer that was part of the boundary layer during the day-time hours (Mattis et al., Citation2004). It is the height of this residual layer that is obtained in this study. shows the PBL height and the residual layer height (black circles) for day- and night-time measurements, respectively, for each session during the analyzed period. Moreover, the top heights of lofted layers above the PBL have been retrieved. PBL, residual layer and top heights provide information about the localization for the most relevant aerosol load.
Fig. 3 PBL and residual layer heights (black circles) and the top altitude of lofted layers (coloured circles) are reported for (a) day-time measurements and (b) night-time measurements during the period 2008–2010.
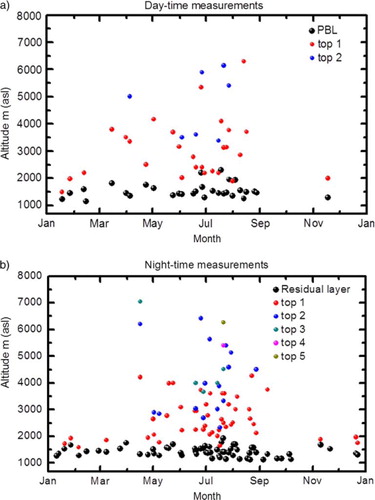
a shows the results for day-time measurements. The PBL height showed on average lower values during winter (1340±180 m a.s.l.) than during summer (1600±200 m), although some PBL height values could be overestimated during winter due to an incomplete lidar overlap. Similar results were observed for one-year analysis of the PBL height during day-time in our station (Granados-Muñoz et al., Citation2012). Moreover, we observe the presence of lofted layers above the PBL for many cases between April and September. In the 75% of the cases, the aerosol layers reach altitudes below 4.5 km a.s.l. although we can see that in some cases they reached almost 7 km a.s.l. For night-time measurements (b), we note greater aerosol stratification. The 85% of the layers above the residual layer are found between May and September. As indicated above, the presence of aerosol in the FT, for day- and night-time measurements for these months, is mainly due to Saharan dust outbreaks and forest-fire smoke over our station (Guerrero-Rascado et al., Citation2008, Citation2009; Alados-Arboledas et al., Citation2011; Córdoba-Jabonero et al., Citation2011). The seasonal behaviour observed in lofted aerosol layers is in agreement with the variability observed in the vertical profiles of aerosol optical properties presented in the previous section.
3.3. Angström exponent seasonal variability
This section presents a statistical analysis of the monthly mean β-AE values. This variable depends on the wavelength, relative humidity and aerosol microphysical properties such as size, chemical composition and shape, but not on the aerosol concentration. Therefore, it is appropriate to distinguish between different aerosol types (Müller et al., Citation2007a). AEs are retrieved for both day- and night-time.
shows the monthly mean β-AE in the range 355–532 nm obtained from night-time measurements. The bars correspond to one standard deviation. This figure also shows the number of Saharan dust events in coincidence with lidar measurements during the analyzed period. The identification of Saharan cases was performed based on backward-trajectory analysis from the HYSPLIT model (Draxler and Rolph, Citation2003) and sun-photometer measurements. Only those cases with Saharan origin that presented a high load of aerosol and low Angström exponent (lower than 0.8) from sun-photometer measurements were identified as Saharan dust cases (Valenzuela et al., Citation2012a, Citationb). The mean β-AE was computed for two regions, namely the residual layer and the FT. This distinction is relevant to identify the variability of aerosol types in the atmospheric column. The monthly mean β-AE values in the residual layer and in the FT ranged from 1.7±0.8 (August) to 0.7±0.2 (September) and from 1.9±0.6 (March) to 0.8±0.5 (May), respectively. We observe clear seasonal behaviour both in the residual layer and FT. In general, the monthly mean β-AE values from May to September are lower than those from October to April. These lower β-AE values observed during the warm season evidence a greater presence of larger particles. Similar results were observed over other stations (Mona et al., Citation2006; Preißler et al., Citation2013). In fact, we observe an increase in the number of Saharan dust events from May to September (green circles, ). However, one case with a high mean β-AE value was observed in the residual layer in August. In this month, despite the air masses coming from North Africa, nearby fires identified by Fire MODIS products (http://firms.modaps.eosdis.nasa.gov/firemap) favoured the intrusion of smoke in the residual layer over our station. This could explain this anomalously high β-AE value in the residual layer. This large β-AE was also observed in Barcelona in August, and it shows the significant presence of forest fires over the atmosphere of the Iberian Peninsula during this month (Sicard et al., Citation2011).
Fig. 4 Monthly mean β-AE (355–532 nm) retrieved in the residual layer (red circles) and in the FT (blue circles) from night-time lidar measurements. Number of Saharan dust events in coincident with lidar measurements is also shown (green circles).
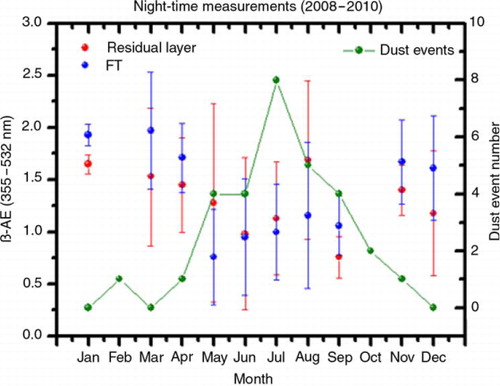
The larger monthly mean values of β-AE observed during autumn and winter indicate a predominance of small particles during these seasons. This suggests the strong contribution of anthropogenic particles to the atmospheric aerosol over Granada during these months. This seasonal cycle has been observed in the AOD-related AE in previous studies developed over our study area (Lyamani et al., Citation2010; Perez-Ramirez et al., Citation2012). Despite the similar β-AE pattern in the residual layer and in the FT during the year, we can observe some differences. Thus, it is evident from that values in the FT are larger than in the residual layer from November to March, that indicating a greater contribution of large particles in the residual layer during these months. This could be due to a smaller contribution of large particles in the FT since Saharan dust events are less frequent in these months. In this sense, shows a lower number of aerosol layers in the FT in autumn and winter. However, an opposite behaviour is observed during warm months, when β-AE values in the residual layer are larger than in the FT. These results indicate that the contribution of large particles in the FT is more important than in the residual layer. This could be mainly associated to the greater contribution of mineral dust in the FT during these months, while the residual layer is also affected by anthropogenic and local sources. Similar results have been evidenced in previous studies developed over our station (Lyamani et al., Citation2010) using ground-based in situ instrumentation and passive remote sensing to retrieve the spectral dependence of aerosol optical properties in the surface boundary layer and in the whole atmospheric column, respectively. Particularly, Lyamani et al. (Citation2010) evidenced that the contribution of mineral dust (large particles) is more relevant in the whole column, while the scattering-related AE observed in surface is also influenced by anthropogenic aerosol (smaller particles) during spring and summer.
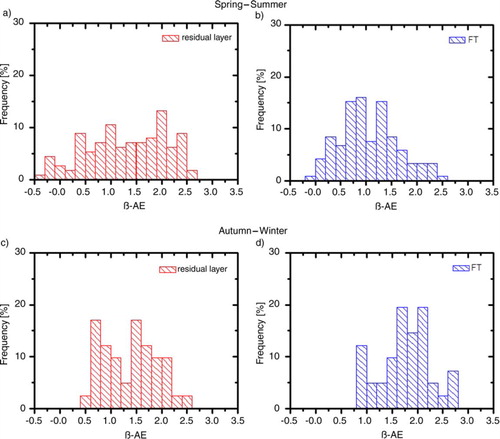
To take into account the high variability observed for β-AE, a more detailed analysis of this parameter is carried out considering all the data gathered over the 3 yr of measurements. shows the frequency distribution of β-AE in the residual layer and in the FT during spring–summer and autumn–winter. For spring–summer, we can observe high variability in the β-AE frequency distribution in the residual layer (a), with local maxima at 2.3, 2.0, 1.0 and 0.4. This indicates that the aerosol load of the residual layer is characterized by a wide range of sizes. However, we can observe that for these seasons the β-AE frequency distribution in the FT shows a dominant mode centred at 0.75 (b). This confirms the results observed for the monthly mean β-AE (), indicating that coarse particles are dominant in the FT during spring and summer. For autumn and winter, we observe two dominant modes centred at 1.6 and 0.75 in the residual layer (c). This confirms again that residual layer is affected by fine and coarse particles. For the FT, the maximum frequency is reached for β-AE values in the range 1.7–2.2. This range includes 55% of the cases, indicating that fine particles are dominant in the FT during autumn and winter.
Fig. 5 Frequency distribution of β-AE for residual layer and FT during spring–summer and autumn–winter.
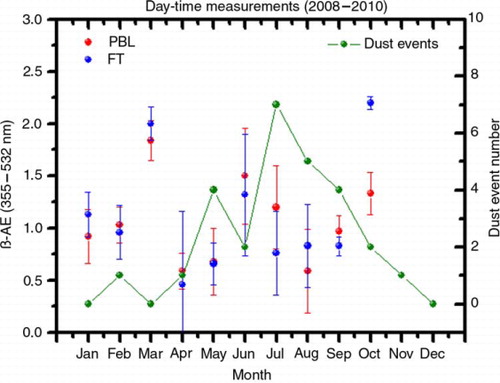
shows the monthly mean β-AE in the range 355–532 nm obtained from day-time measurements. The number of Saharan dust events coinciding with lidar measurements is also presented. The monthly mean values in the PBL and in the FT ranged from 1.8±0.2 (March) to 0.6±0.2 (April) and from 2.2±0.1 (October) to 0.5±0.7 (April), respectively. The monthly mean β-AE values from April to September are lower than those from October to March. Atypical large β-AE values, 1.5±0.5 and 1.3±0.6, are observed in June in the PBL and in the FT, respectively. We identify, by means of HYSPLIT backward-trajectory, analysis and Fire MODIS products air masses coming from fire areas several days along this month. In addition, we note that a lower number of Saharan dust cases were present during day-time coinciding with lidar measurements in this month. Despite the atypical large β-AE value in June, we observe the same behaviour of the FT and PBL β-AE throughout the year during day- and night-time. Also, similar frequency distributions are obtained. Therefore, this intensive variable shows the same properties in the atmospheric aerosol during day- and night-time.
Fig. 6 Monthly mean β-AE (355–532 nm) retrieved in the PBL (red circles) and in the FT (blue circles) from day-time lidar measurements. Number of Saharan dust events in coincident with lidar measurements is also shown (green circles).
3.4. LR variability and relation with Angström exponent in the FT
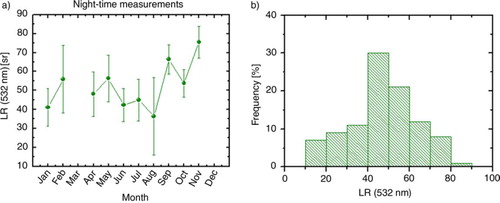
Monthly mean LR values at 532 nm were only retrieved from night-time measurements since the extinction profiles are only available during night-time. The LR mean values were only calculated in the FT since in some cases it was not feasible to retrieve extinction coefficient inside the PBL. a shows the monthly evolution of this quantity. Although the annual evolution is not so clear, we can observe the largest LRs during autumn and winter, while lower values are observed in spring and summer. The mean values varied between 36±20 sr (August) and 75±8 sr (November). Large values of LR can be attributed to urban and polluted aerosol while values between 40 and 60 sr are typical of mineral particles (Ackermann, Citation1998; Matthias and Bosenberg, Citation2002; Müller et al., Citation2007a). No LR data are available in March, since Raman inversions at 532 nm were not available. b presents the frequency distribution of LRs. The greatest part of LRs is in the range between 40 and 60 sr (50% of the cases). These LR values are typical for mineral dust and urban–continental particles (Matthias and Bosenberg, Citation2002; Müller et al., Citation2007b). LRs larger than 60 sr were found for 20% of the cases, these values are indicative of highly light-absorbing particles (Franke et al., Citation2003; Müller et al., Citation2003) and typically attributed to smoke and anthropogenic pollution. The number of cases with lower LR (below 40 sr) was around 25%, such values are indicative of marine and polluted marine particles which present a larger scattering.
Fig. 7 (a) Monthly mean LR at 532 nm retrieved from night lidar measurements over 3 years and (b) frequency distribution of LR at 532 nm.
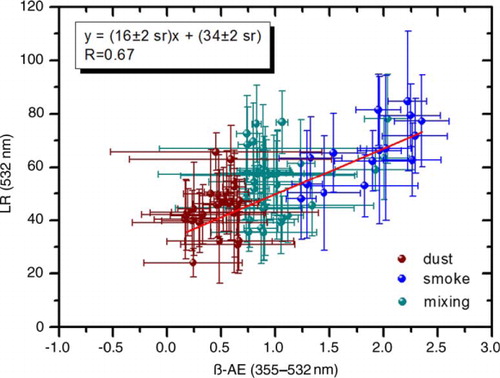
Night-time measurements of β-AE and LR allowed correlating these properties in the FT over the 3 yr (). A total of 80 pairs of data have been included in this plot. LRs range from 20 to 85 sr while β-AEs range from 0.18 to 2.3. This wide range of values indicates that different types of aerosol are found in the FT over Granada. Although the correlation coefficient is not so good (R=0.67), a clear, positive slope is observed between both properties, indicating that large AEs (smaller particles) are associated with large LRs. This behaviour has been confirmed for dust and smoke particles, whose values have been identified in this plot with brown and blue colours, respectively. Those points that do not present a clear origin or associated with mixing of different aerosol types have been represented in green colour. We can observe that most of the points for dust particle present low LR and AE values, while an opposite behaviour is observed for smoke particles. This study confirms the expected results since small particles (large AE) usually present a greater absorption and therefore larger LR values (e.g. smoke, anthropogenic pollution) while larger particles (low AE) present more scattering (e.g. mineral dust particles).
Fig. 8 β-AE (355–532 nm) versus LR at 532 nm in the FT. Dust, smoke and mixing particles have been identified in the plot with brown, blue and green colours, respectively.
4. Conclusions
A characterization of aerosol optical properties has been performed by means of a Raman lidar at Granada, Spain. Seasonal vertical optical profiles showed the largest values for the particle backscatter and extinction coefficients at altitudes closer to the surface, with very similar values throughout the year. In the FT, we observed larger values during spring–summer than in autumn–winter. This fact can be explained by the impact of lofted aerosol layers associated with Saharan dust outbreaks during the warm season at these heights. For spring–summer, the LR profiles presented quite constant mean values (with high standard deviation) in the range typically attributed to mineral dust (~46 sr) while LR profiles are highly variable for autumn–winter. A study of aerosol layering in the whole column indicated that most of the aerosol particles presented above the PBL are detected during warm months. Moreover, mean monthly integrated β-AE values were obtained in the PBL and in the FT from day- and night-time measurements. We observe clear, seasonal behaviour in both atmospheric regions. In general, the monthly mean β-AE values present lower values in warm months than in cold ones. This indicates that the presence of large particles is more important in spring and summer. We also observe that β-AE values were larger in the FT than in the PBL in autumn and winter. The opposite pattern was observed in spring and summer. Finally, the annual cycle of LR at 532 nm also suggests a predominance of absorbing particles during autumn and winter and an increase in the contribution of scattering particles during spring and summer. A moderate correlation was observed between β-AE and LR at 532. The results confirmed that small particles are associated with large absorption while large particles are related with large scattering.
Acknowledgments
This work was supported by the Andalusia Regional Government through projects P08-RNM-3568 and P10-RNM-6299, by the Spanish Ministry of Science and Technology through projects CGL2010-18782, CSD2007-00067, CGL2011-13580-E/CLI and CGL2011-16124-E; and by the EU through the ACTRIS project (EU INFRA-2010-1.1.16-262254). The authors express gratitude to MODIS mission scientists and associated NASA personnel for the production of the data used in this publication. They gratefully acknowledge the NOAA Air Resources Laboratory (ARL) and the Naval Research Laboratory for the HYSPLIT transport and dispersion model.
Related Research Data
References
- Ackermann J . The extinction-to-backscatter ratio of tropospheric aerosol: a numerical study. J. Atmos. Ocean. Tech. 1998; 15: 1043–1050.
- Alados-Arboledas L , Lyamani H , Olmo F. J . Aerosol size properties at Armilla, Granada (Spain). Q. J. Roy. Meteorol. Soc. 2003; 129: 1395–1413.
- Alados-Arboledas L , Müller D , Guerrero-Rascado J. L , Navas-Guzman F , Perez-Ramirez D , co-authors . Optical and microphysical properties of fresh biomass burning aerosol retrieved by Raman lidar, and star-and sun-photometry. Geophys. Res. Lett. 2011; 38: 1–5.
- Amiridis V , Balis D. S , Kazadzis S , Bais A , Giannakaki E , co-authors . Four-year aerosol observations with a Raman lidar at Thessaloniki, Greece, in the framework of European Aerosol Research Lidar Network (EARLINET). J. Geophys. Res. 2005; 110(D21203): 10.1029/2005JD006190.
- Ansmann A , Bosenberg J , Chaikovsky A , Comeron A , Eckhardt S , co-authors . Long-range transport of Saharan dust to northern Europe: The 11–16 October 2001 outbreak observed with EARLINET. J. Geophys. Res. Atmos. 2003; 108: 1–5. D24, 4783.
- Ansmann A , Riebesell M , Wandinger U , Weitkamp C , Voss E , co-authors . Combined Raman elastic-backscatter lidar for vertical profiling of moisture, aerosol extinction, backscatter, and lidar ratio. Appl. Phys. B – Photophys. Laser Chem. 1992; 55: 18–28.
- Baars H , Ansmann A , Engelmann R , Althausen D . Continuous monitoring of the boundary-layer top with lidar. Atmos. Chem. Phys. 2008; 8: 7281–7296.
- Córdoba-Jabonero C , Sorribas M , Guerrero-Rascado J. L , Adame J. A , Hernandez Y , co-authors . Synergetic monitoring of Saharan dust plumes and potential impact on surface: a case study of dust transport from Canary Islands to Iberian Peninsula. Atmos. Chem. Phys. 2011; 11: 3067–3091.
- Draxler R. R, Rolph G. D. 2003. http://www.arl.noaa.gov/ready/hysplit4.html. Silver Spring, MD..
- Fernald F. G . Analysis of atmospheric lidar observations – some comments. Appl. Optic. 1984; 23: 652–653.
- Foster P , Ramaswamy V , Artaxo P , Berntsen T , Betts R , co-authors . Solomon S , Qin D , Manning M , Chen Z , Marquis M , co-authors . Changes in atmospheric constituents and in radiative forcing. In: Climate Change 2007: The Physical Science Basis. Contribution of Working Group I to the Fourth Assessment Report of the Intergovernmental Panel on Climate Change. 2007; Cambridge, UK: Cambridge University Press. 129–234.
- Franke K , Ansmann A , Muller D , Althausen D , Venkataraman C , co-authors . Optical properties of the Indo-Asian haze layer over the tropical Indian Ocean. J. Geophys. Res. Atmos. 2003; 108: 1–17. D2, 4059.
- Giannakaki E , Balis D. S , Amiridis V , Zerefos C . Optical properties of different aerosol types: seven years of combined Raman-elastic backscatter lidar measurements in Thessaloniki, Greece. Atmos. Meas. Tech. 2010; 3: 569–578.
- Granados-Muñoz M. J , Navas-Guzmán F , Bravo-Aranda J. A , Guerrero-Rascado J. L , Lyamani H , co-authors . Automatic determination of the planetary boundary layer height using lidar: one-year analysis over southeastern Spain. J. Geophys. Res. Atmos. 2012; 117: 1–10.
- Groß S , Tesche M , Freudenthaler V , Toledano C , Wiegner M , co-authors . Characterization of Saharan dust, marine aerosols and mixtures of biomass-burning aerosols and dust by means of multi-wavelength depolarization and Raman lidar measurements during SAMUM 2. Tellus B. 2011; 63(4): 706–724.
- Guerrero-Rascado J. L , Olmo F. J , Aviles-Rodriguez I , Navas-Guzman F , Perez-Ramirez D , co-authors . Extreme Saharan dust event over the southern Iberian Peninsula in september 2007: active and passive remote sensing from surface and satellite. Atmos. Chem. Phys. 2009; 9: 8453–8469.
- Guerrero-Rascado J. L , Ruiz B , Alados-Arboledas L . Multi-spectral lidar characterization of the vertical structure of Saharan dust aerosol over southern Spain. Atmos. Environ. 2008; 42: 2668–2681.
- Kaufman Y. J, Tanré D, Boucher O. A satellite view of aerosols in the climate system. Nature. 2002; 419: 215–223. [PubMed Abstract].
- Klett J. D . Stable analytical inversion solution for processing lidar returns. Appl. Optic. 1981; 20: 211–220.
- Landulfo E , Papayannis A , Artaxo P , Castanho A. D. A , de Freitas A. Z , co-authors . Synergetic measurements of aerosols over Sao Paulo, Brazil using LIDAR, sunphotometer and satellite data during the dry season. Atmos. Chem. Phys. 2003; 3: 1523–1539.
- Lyamani H , Olmo F. J , Alados-Arboledas L . Physical and optical properties of aerosols over an urban location in Spain: seasonal and diurnal variability. Atmos. Chem. Phys. 2010; 10: 239–254.
- Lyamani H , Olmo F. J , Alcantara A , Alados-Arboledas L . Atmospheric aerosols during the 2003 heat wave in southeastern Spain II: microphysical columnar properties and radiative forcing. Atmos. Environ. 2006a; 40: 6465–6476.
- Lyamani H , Olmo F. J , Alcantara A , Alados-Arboledas L . Atmospheric aerosols during the 2003 heat wave in southeastern Spain I: spectral optical depth. Atmos. Environ. 2006b; 40: 6453–6464.
- Marenco F , Santacesaria V , Bais A. F , Balis U , di Sarra A , co-authors . Optical properties of tropospheric aerosols determined by lidar and spectrophotometric measurements (photochemical activity and solar ultraviolet radiation campaign). Appl. Optic. 1997; 36: 6875–6886.
- Matthias V , Bosenberg J . Aerosol climatology for the planetary boundary layer derived from regular lidar measurements. Atmos. Res. 2002; 63: 221–245.
- Mattis I , Ansmann A , Muller D , Wandinger U , Althausen D . Multiyear aerosol observations with dual-wavelength Raman lidar in the framework of EARLINET. J. Geophys. Res. Atmos. 2004; 109: 1–15.
- Mona L , Amodeo A , Pandolfi M , Pappalardo G . Saharan dust intrusions in the Mediterranean area: three years of Raman lidar measurements. J. Geophys. Res. Atmos. 2006; 111: 1–13.
- Morille Y , Haeffelin M , Drobinski P , Pelon J . STRAT: an automated algorithm to retrieve the vertical structure of the atmosphere from single-channel lidar data. J. Atmos. Ocean. Tech. 2007; 24: 761–775.
- Müller D , Ansmann A , Mattis I , Tesche M , Wandinger U , co-authors . Aerosol-type-dependent lidar ratios observed with Raman lidar. J. Geophys. Res. Atmos. 2007a; 112(D16202): 1–11.
- Müller D , Franke K , Ansmann A , Althausen D , Wagner F . Indo-Asian pollution during INDOEX: microphysical particle properties and single-scattering albedo inferred from multiwavelength lidar observations. J. Geophys. Res. Atmos. 2003; 108: 1–15. D19, 4600.
- Müller D , Mattis I , Ansmann A , Wandinger U , Ritter C , co-authors . Multiwavelength Raman lidar observations of particle growth during long-range transport of forest-fire smoke in the free troposphere. Geophys. Res. Lett. 2007b; 34: 1–4.
- Müller D , Weinzierl B , Petzold A , Kandler K , Ansmann A , co-authors . Mineral dust observed with AERONET sun photometer, Raman lidar, and in situ instruments during SAMUM 2006: shape-independent particle properties. J. Geophys. Res. Atmos. 2010; 115(D07202): 1–18.
- Navas-Guzmán F , Guerrero Rascado J. L , Alados Arboledas L . Retrieval of the lidar overlap function using Raman signals. Ópt. Pura y Apl. 2011a; 44: 71–75.
- Navas-Guzmán F , Guerrero-Rascado J. L , Bravo-Aranda J. A , Alados-Arboledas L . Calibration of 1064 nm-backscatter profiles with a multiwavelength Raman lidar. Rom. J. Phys. 2011b; 56: 460–466.
- Noh Y. M , Kim Y. J , Müller D . Seasonal characteristics of lidar ratios measured with a Raman lidar at Gwangju, Korea in spring and autumn. Atmos. Environ. 2008; 42: 2208–2224.
- Papayannis A , Amiridis V , Mona L , Tsaknakis G , Balis D , co-authors . Systematic lidar observations of Saharan dust over Europe in the frame of EARLINET (2000–2002). J. Geophys. Res. Atmos. 2008; 113(D10204): 1–17.
- Pappalardo G , Wandinger U , Mona L , Hiebsch A , Mattis I , co-authors . EARLINET correlative measurements for CALIPSO: first intercomparison results. J. Geophys. Res. 2010; 115: D00H19. 10.1029/2009JD012147.
- Perez-Ramirez D , Lyamani H , Olmo F. J , Whiteman D. N , Alados-Arboledas L . Columnar aerosol properties from sun-and-star photometry: statistical comparisons and day-to-night dynamic. Atmos. Chem. Phys. 2012; 12: 9719–9738.
- Pilinis C , Pandis S. N , Seinfeld J. H . Sensitivity of direct climate forcing by atmospheric aerosols to aerosol size and composition. J. Geophys. Res. 1995; 100: 18739–18754.
- Preißler J , Wagner F , Guerrero Rascado J. L , Silva A. M . Two years of free-tropospheric aerosol layers observed over Portugal by lidar. J. Geophys. Res. 2013; 118: 3676–3686. 10.1002/jgrd.50350.
- Ramanathan V, Crutzen P. J, Kiehl J. T, Rosenfeld D. Atmosphere: aerosols, climate, and the hydrological cycle. Science. 2001; 294: 2119–2124. [PubMed Abstract].
- Rodríguez S , Alastuey A , Alonso-Pérez S , Querol X , Cuevas E , co-authors . Transport of desert dust mixed with North African industrial pollutants in the subtropical Saharan Air Layer. Atmos. Chem. Phys. 2011; 11: 6663–6685.
- Sasano Y , Nakane H . Significance of the extinction backscatter ratio and the boundary-value term in the solution for the 2-component lidar equation. Appl. Optic. 1984; 23: 11–13.
- Sicard M , Rocadenbosch F , Reba M. N. M , Comeron A , Tomas S , co-authors . Seasonal variability of aerosol optical properties observed by means of a Raman lidar at an EARLINET site over Northeastern Spain. Atmos. Chem. Phys. 2011; 11: 175–190.
- Spinhirne J. D , Palm S. P , Hart W. D , Hlavka D. L , Welton E. J . Cloud and aerosol measurements from GLAS: overview an initial results. Geo. Res. Lett. 2005; 32: 1–5.
- Titos G , Foyo-Moreno I , Lyamani H , Querol X , Alastuey A , co-authors . Optical properties and chemical composition of aerosol particles at an urban location: an estimation of the aerosol mass scattering and absorption efficiencies. J. Geophys. Res.–Atmos. 2012; 117(D04206): 1–12.
- Valenzuela A , Olmo F. J , Lyamani H , Anton M , Quirantes A , co-authors . Aerosol radiative forcing during African desert dust events (2005–2010) over Southeastern Spain. Atmos. Chem. Phys. 2012a; 12: 10331–10351.
- Valenzuela A , Olmo F. J , Lyamani H , Anton M , Quirantes A , co-authors . Classification of aerosol radiative properties during African desert dust intrusions over southeastern Spain by sector origins and cluster analysis. J. Geophys. Res. Atmos. 2012b; 117(D06214): 1–18.
- Wandinger U , Ansmann A . Experimental determination of the lidar overlap profile with Raman lidar. Appl. Optic. 2002; 41: 511–514.