
Abstract
In this paper, we report for the first time the δ13C and δ15N data for PM2.5 and PM10 aerosols collected in Tanzania during May–August 2011 together with total carbon (TC) and nitrogen (TN) contents. Mean TC concentrations were 6.5±2.1 µg m−3 in PM2.5 and 9.2±3.5 µg m−3 in PM10. δ13C of TC ranged from −26.1 to −20.6‰ with a mean of −23.6‰ in PM2.5 and from −24.4 to −22.4‰ with a mean of −23.6‰ in PM10. We found substantially greater δ13C values in PM2.5 samples during dry season as well as strong positive correlation between levoglucosan (and nss-K+) and TC in PM2.5. These results suggest a significant contribution from burning of C4 plants to fine organic aerosol formation. TN contents showed a mean of 0.7±0.3 µg m−3 in PM2.5 and 0.8±0.2 µg m−3 in PM10. δ15N ranged from +13.4 to +22.1‰ with a mean of +16.2±2.7‰ in PM2.5 and +10.4 to +18.7‰ with a mean of +13.7±2.2‰ in PM10. δ15N showed higher ratios in fine particles than coarse particles in both wet and dry season. The relatively high δ15N values suggest isotopic enrichment of 15N in aerosols via exchange reaction between NH3 (gas) and (particle). We found a strong correlation between TN and
(r
2=0.94 in PM2.5 and r
2=0.86 in PM10) and
(r
2=0.48 in PM2.5 and r
2=0.55 in PM10). We also found that organic nitrogen is less significant than inorganic nitrogen in the Morogoro aerosols. Based on stable carbon isotopic composition, contributions of burning C3 plants to TC were estimated to range from 42 to 74% in PM2.5 and from 39 to 64% in PM10, whereas those of C4 ranged from 26 to 58% in PM2.5 and from 36 to 61% in PM10. These results suggest that burning activities of C3 and C4 plants contribute to organic aerosol formation in Tanzania.
1. Introduction
Stable carbon (δ13C) and nitrogen (δ15N) isotopic compositions can provide complementary information about sources of aerosols and have long been applied in various environments (Turekian et al., Citation1998; Lajtha and Marshall, Citation1999; Narukawa et al., Citation2008; Pavuluri et al., Citation2010). Also, δ13C and δ15N of bulk aerosols have been used to better understand the contributions of various sources to organic aerosols including biomass and biofuel burning (Ballentine et al., Citation1998; Martinelli et al., Citation2002; Widory, Citation2007). In tropical sites, biomass burning is widespread as it serves to convert forests to agricultural and pastoral lands. The field burning of agricultural waste and fuel wood burning are known to produce aerosol particles and trace gases that play important roles in atmospheric chemistry and climate changes (Levine et al., Citation1995).
Although studies on stable carbon and nitrogen isotope ratios of aerosols have been reported from several sites, little is known in Africa and no extensive studies have been conducted on δ13C and δ15N simultaneously (Billmarka et al., Citation2005; Rommerskirchen et al., Citation2006; Vogts et al., Citation2009). Further, the relation of nitrate and ammonium ions to total aerosol nitrogen has not been studied in Africa, although they could provide additional information on the source types of aerosols (e.g., CitationKundu et al., 2010a; Pavuluri et al., Citation2010).
In this paper, we present the measurement results on stable carbon and nitrogen isotopic composition in the ambient aerosols collected at a rural background site in Tanzania during an intensive field campaign carried out in May through August 2011. Here, we report the concentrations of total carbon (TC) and total nitrogen (TN) and their isotopic composition to better understand their potential sources. Southern African savanna where Tanzania locates is an important source region of biomass burning and long-range atmospheric transport of aerosols on a local and global scale (Lajtha and Marshall, 1994). This study provides for the first time baseline data sets of stable C and N isotopic composition of atmospheric aerosols from Tanzania, East Africa.
2. Experimental
2.1. Aerosol sampling
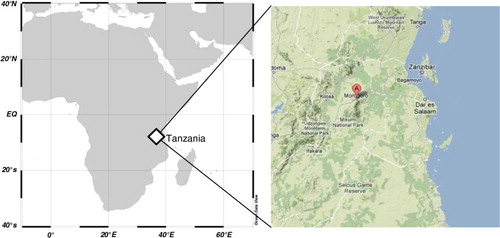
PM2.5 and PM10 aerosol sampling was carried out at Solomon Mahlangu Campus of Sokoine University of Agriculture in Morogoro (06°47′40.8″S; 37°37′44.5″E, altitude 504 m, a.s.l.) from 30 May to 8 August 2011. This typical rural site (300 000 inhabitants) is located at about 200 km west of the coast of the Indian Ocean where the city of Dar es Salaam, a business capital in Tanzania, is located (). Aerosol samples were collected using PM2.5 and PM10 low-volume filter samplers operated in parallel; one of the samplers was equipped with a Rupprecht and Pataschnik PM2.5 inlet and the other with a Gent PM10 inlet (Hopke et al., 1997). Samplers were placed at a meteorological synoptic station on campus, and aerosol collections were made at 2.7 m above ground level.
Fig. 1 Map showing the location of the sampling site of Morogoro, Tanzania.
Each sampler used NILU stacked filter unit (SFU) cassettes, in which the front and back quartz fibre filters (Pallflex 2500QAT-UP, 47 mm) were placed in series. The samplers operated at a flow rate of 17 L/minute. The quartz filters were pre-baked at 450°C for 4 hours in a furnace to eliminate adsorbed organics before use. The two quartz fibre filters (front and back) in the PM2.5 inlet and PM10 filter holder were intended to assess the extent of the artefacts. Quartz fibre filters can adsorb volatile organic compounds (VOCs) causing positive artefacts when measuring the PM. On the other hand, semi-volatile organic compounds (SVOCs) in aerosols may partially evaporate during sampling resulting in negative artefacts (Turpin et al., Citation2000; Hitzenberger et al., Citation2004). The PM mass and organic species (e.g., TC) determined on the back quartz filters were insignificant and therefore in this study the data from the front filter were adopted.
During the campaign, a total of 21 sets of samples and two field blanks for each of the PM2.5 and PM10 samplers were collected on an approximately 24-hour basis and exchange of filters was performed at 7:30 am. Before and after sampling, quartz filters were placed in a pre-heated glass vial with a Teflon-lined screw cap and kept frozen at −20°C during storage. The samples were transported to the Institute of Low Temperature Science, Hokkaido University and stored in a freezer at −20°C prior to analysis. All procedures were strictly quality-controlled to avoid any possible contamination of the samples.
2.2. Aerosol analysis
For the measurements of TC and TN contents and their isotopic compositions, a punch (1.54 cm2) of each quartz filter sample was cut off and used. The filter punch was rounded using a pair of flat tipped tweezers, placed into a tin cup and then caked into a ball. Before use, the tin cup was cleaned with acetone under ultrasonication to remove organic and other contaminants. The samples (filter plus tin cup) were then analysed for TC and TN and their isotopic compositions using elemental analyser (EA; model Carlo Erba NA 1500) and EA/isotope ratio mass spectrometer (IRMS) (Finnigan MAT Delta Plus) (Narukawa et al., Citation1999; Kawamura et al., Citation2004). Isotope data reported as δ13C and δ15N values were defined as:1
2
Before running the real samples for the determination of TC, TN, δ13C and δ15N ratios, we checked the instrument conditions with an empty tin cup three times and also evaluated a five-point calibration curve using acetanilide standard with the procedural blanks. The replicate analyses were not conducted due to the small size of actual sample filters. The analytical errors for δ13C measurement based on repeated analyses of atmospheric aerosol samples at our laboratory were within 0.2‰ and those for δ15N are 0.3‰ (Kawamura et al., Citation2004). We confirmed the similar analytical errors by running the authentic standards (acetanilide). TC and TN contents reported here were corrected for the field blanks, whose levels are <1.4% of actual samples. δ13C and δ15N values were also corrected for the field blanks using an isotopic mass balance equation. Details for the measurement of LG and water-soluble inorganic ions can be found in Mkoma et al. (Citation2013), and a nonparametric correlation test (Spearman test) was applied to our data sets to explain the relationship between variables.
2.3. Meteorology
Meteorological parameters including precipitation, ambient temperature and relative humidity were recorded at a meteorological synoptic station at sampling site during sampling days. The prominent wind pattern during the sampling period was characterized by the southeasterly (SE) monsoons with daily average wind speed of 7.8 m s−1. The average ambient temperature was 25°C with a range of 22–29°C. The daily average relative humidity ranged from 65 to 96% in the morning hours and from 41 to 60% in the afternoon. Generally, aerosol sampling was mostly conducted on days with no rain and/or a very weak rain.
2.4. Air mass backward trajectories
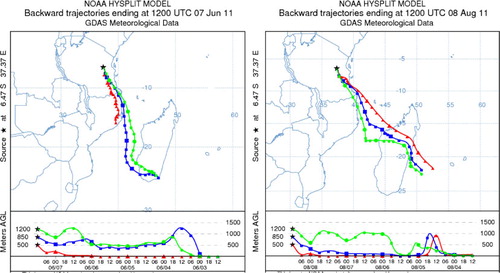
In order to identify the source regions, backward air mass trajectories at arrival level of 500 m above the ground were computed using the Hybrid Single-Particle Lagrangian Integrated Trajectory (HYSPLIT) model of the NOAA/ARL (http://ready.arl.noaa.gov/HYSPLIT.php; Draxler and Rolph, Citation2012). The isentropic backward 5-d air mass back trajectories for 24-hour samples indicated that the sampling site in Morogoro was mainly influenced by air masses from the Indian Ocean with mixtures of continental origins over Madagascar, through Mozambique and Tanzania ().
Fig. 2 Typical examples of 5-day backward air mass trajectories arriving at Morogoro during the May–August 2011 sampling period.
3. Results and discussion
3.1. Total aerosol mass, TC, TN, δ13C, δ15N, and TC/TN and TC/PM ratios
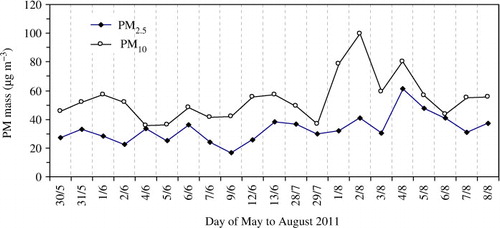
The variations of PM2.5 and PM10 aerosol mass concentrations are shown in . Mean aerosol mass concentrations for PM2.5 and associated standard deviation were 33.4±9.7 µg m−3 (range: 16.6-61.3 µg m−3), whereas those of PM10 were 54.2±16.1 µg m−3 (range: 35.7-99.5 µg m−3). The aerosol mass concentration levels obtained here are comparable to or lower than the previous studies from Morogoro (Mkoma et al., Citation2009a, Citationb). The mean PM mass back/front filter ratios from the quartz fibre filters for the PM2.5 and PM10 during sampling period were determined. On average, 7–16% of the PM mass on the front filters for the two size fractions was due to sampling artefacts. The artefacts are thought to be mostly positive, i.e., due to adsorption of VOCs and of volatile inorganic species (Turpin et al., Citation2000; Hitzenberger et al., Citation2004). In previous 2005 and 2006 campaigns at Morogoro on average 9 to 13% of the PM mass were due to sampling artefacts (Mkoma et al., Citation2010).
Fig. 3 Trends of aerosol mass concentrations (µg m−3) in PM2.5 and PM10 during the May–August 2011 sampling period at Morogoro.
Concentrations of TC and TN in PM2.5 and PM10 are presented in Table and 2, respectively. TC contents ranged from 3.1 to 10.4 µg m−3 (mean: 6.5±2.1 µg m−3) in PM2.5, whereas those of PM10 were 4.2–18.0 (mean: 9.2±3.5 µg m−3). On average, TC accounted for 20.8% (range: 9.6–34.7%) of PM2.5 and 17% (range: 11.8–28.7%) of PM10 mass. These results show elevated concentrations of TC in months of July–August, suggesting enhanced biomass/biofuel burning activities and contributions of primary biogenic particles (mostly in PM10 fraction). Domestic use of fuel wood and charcoal, which are common in Tanzania, could also contribute to the observed levels of TC at our sampling site.
Table 1. Concentrations of TC and TN (µg m−3), their isotope ratios (‰), TC/TN and TC/PM (%) in PM2.5 from Morogoro, Tanzania (n=21)
The mean percentage of PM10 carbon (or nitrogen) that is actually PM2.5 and which fraction is coarse were calculated for the campaign on the basis of the data for PM2.5 and PM10 samples taken in parallel and then averaged over all samples from the campaign. The mean PM2.5/PM10 carbon ratios were 68±19% (range: 34%-98%). The results indicate that most of PM10 carbon was mainly in fine (PM2.5) fraction during the campaign. The possible main contributors to carbon are biomass burning particles and secondary aerosol, both of which are known to be preferentially associated with PM2.5 fraction (Fuzzi et al., Citation2007). In contrast, a small contribution from soil dust may be associated with coarse particles.
δ13C of TC ranged from −26.1 to −20.6‰ in PM2.5 and −24.4 to −22.4‰ in PM10 with a mean of −23.6‰ in both fractions ( and 2). We found substantially higher δ13C values in PM2.5 samples, suggesting that biomass burning of C4 plants dominated in savanna grasses occasionally contributes to the formation of organic aerosols in the region (Rommerskirchen et al., Citation2006). The high range for δ13C observed in PM10 may be influenced by soil dust contributions and biogenic emissions of plant waxes.
Table 2. Concentrations of TC and TN (µg m−3), their isotope ratios (‰), TC/TN and TC/PM (%) in PM10 from Morogoro, Tanzania (n=21)
The isotopic mass balance eqs. (3) and (4) were used to calculate the isotope ratios of fine (PM2.5) and coarse (PM10–PM2.5) particles (Kawamura and Watanabe, Citation2004).3
4
where δ13Ccoarse and δ15Ncoarse, and δ13Cfine and δ15Nfine are isotopic composition of (C and N) coarse and fine particles, respectively. Ffine is a fraction of fine particles, whereas Fcoarse is a fraction of coarse particles (Ffine+Fcoarse=1).
shows the results of isotopic compositions of C and N in the fine and coarse fractions during 2011 wet and dry season samplings. During dry season (28 July to 8 August), fine particles are more enriched with 13C, suggesting more contribution from the burning of C4 plants (they have evolved in the dry conditions in the history of plants) than coarse particles. C4 plants are probably more active when weather is dried in East Africa. However, in the wet season (30 May to 13 June), δ13C of coarse particles showed higher ratios than fine particles. Although it is difficult to explain the reason, we consider that there is some unknown process behind the result.
Table 3. Isotope ratios (‰) of carbon and nitrogen in the fine and coarse fractions of Morogoro, Tanzania, during 2011 wet and dry season campaigns
TN contents had a narrow range of 0.4–1.6 µg N m−3 (mean: 0.7±0.3 µg N m−3) in PM2.5 and 0.6–1.6 µg N m−3 (mean: 0.8±0.2 µg N m−3) in PM10. TN comprised of 1.1–4.6% (mean: 2.2%) of PM2.5 and 1.1–2.6% (mean: 1.6%) of PM10 mass. Variations of TN may be due to the wet scavenging (most N species are water-soluble) and the differences in photochemical atmospheric processes. The calculated mean percentage ratio of PM2.5 to PM10 nitrogen during the campaign was 72±14% ranging from 57 to 98%. The ratios indicate that most of nitrogen was mainly present in fine (PM2.5) fraction and possibly associated with biomass/biofuel burning activities and secondary aerosols. TC/TN weight ratios range from 6.3 to 13.9 in PM2.5 and from 6.9 to 14.1 in PM10 ( and 2). The higher C/N ratios suggest more contributions of organic aerosols from biomass/biofuel burning in East Africa. A strong positive correlation (r 2>0.88, p<0.001) between TC and TN in PM10 (Fig. not shown here) may indicate that TC and TN have a common source. We also found strong correlations (r 2>0.70) between PM10 mass and TC (p<0.001) or TN (p<0.05) (Fig. not shown here).
δ15N of TN in PM2.5 ranged from +13.4 to +22.1‰ (mean: +16.2±2.7‰), whereas those of PM10 are slightly lower ranging from +10.5 to +18.7‰ (mean: +13.7±2.2‰) (Table and 2). The isotopic compositions of N in the fine and coarse fractions of Morogoro during wet and dry season campaigns are given in . The δ15N showed higher ratios in fine particles than coarse particles in both wet and dry season. These results suggest that enrichment of 15N in fine particles is more important than coarse particles in both seasons. The higher δ15N ratios in dry season further indicate that isotopic enrichment of 15N in the aerosols is more significant in dry season due to partitioning reaction between gas (NH3) and particle [(NH4)2SO4] (Pavuluri et al., Citation2010). δ15N variability at our site could also be controlled by biomass burning activities, and by nitrogenous species (e.g., NH3) from agricultural sources, in particular cattle raising (Streets et al., Citation2003).
3.2. Temporal variations of TC, δ13C and relations with biomass burning tracers
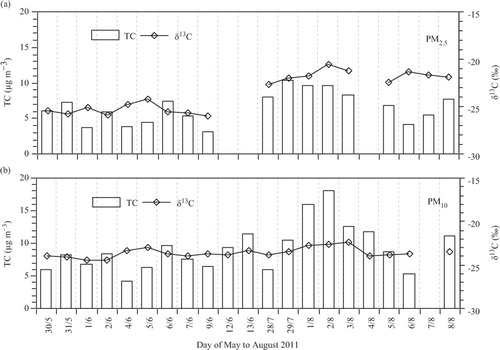
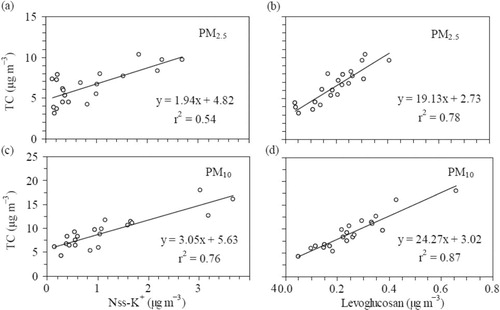
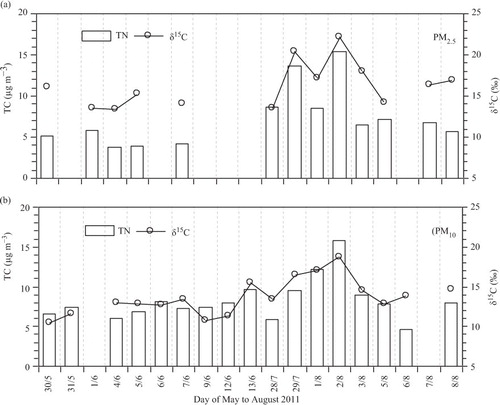
Temporal variations of TC and its isotope ratio (δ13C) for PM2.5 and PM10 are shown in . The highest TC contents were observed between 29 July and 2 August for PM2.5 and 2–3 August for PM10. The elevated TC concentrations can be associated with the enhanced source strength of local and regional biomass burning activities. In spite of variable concentrations of TC (3.1–18.0 µg m−3) and LG (0.038–0.659 µg m−3, data from Mkoma et al., Citation2013), LG/TC ratios (on carbon basis) did not show a significant difference between PM2.5 (mean: 0.029, range: 0.009–0.042) and PM10 (mean: 0.027, range: 0.012–0.039).
Fig. 4 Temporal variation of TC and δ13C in (a) PM2.5 and (b) PM10 during the May–August 2011 sampling period at Morogoro.
shows strong positive correlations between TC and LG (p<0.001) in both PM2.5 and PM10 and nss-K+ (p<0.05 in PM2.5 and p<0.001 in PM10) suggesting an important contribution to TC from biomass/biofuel burning emissions from residential wood burning and charcoal-making operations in East Africa. The non-sea-salt (nss)-K+ was calculated using Na+ as a reference tracer for sea-salt and obtained by subtracting the sea-salt contribution from the measured K+ data sets (Riley and Chester, Citation1971). The intercepts of the least square fit are all positive on TC axis, implying that in addition to biomass burning there is a contribution to TC either from direct emission of bioaerosols from plants or from secondary formation of organic aerosols from biogenic VOCs. The background TC concentrations in PM2.5 and PM10 () could be involved with emissions from soil dust and biogenic sources (nss-K+ can be emitted from biogenic debris and soil dust). The weak correlation observed between TC and nss-K+ in PM2.5 (a) could be associated with secondary organic aerosols (high temperature and most organic compounds are water-soluble). Use of wood and charcoal for domestic cooking and heating is common in Tanzania, which is enhanced in months of March through May.
Fig. 5 Relation between TC with levoglucosan and nss-K+ in PM2.5 (a, b) and PM10 (c, d) during the sampling period.
On the other hand, Na+/TC ratio in the marine aerosols was reported to be 2.3 (Cavalli et al., Citation2004) and its relation to δ13C of TC is used to understand the relative contribution of seawater organics to marine aerosols (Narukawa et al., Citation2008). Our average Na+/TC ratio was 0.18, and no correlation was found between δ13C with Na+/TC ratios and even with (Fig. not shown). This suggests that the influence of sea-salt particles to our site is less important.
The δ13C was poorly correlated with TC in PM2.5 (r 2=0.22), but somewhat good correlation was obtained for PM10 (r 2=0.37) (Fig. not shown here). The correlation between δ13C and TC may indicate possible emissions of soil dust and biological particles and a possible condensation of volatile and semi-volatile organics derived from biomass burning of C4 plants on pre-existing particles.
3.3. Temporal variations in TN, δ15N and contributions of N species to TN
shows temporal variations of TN and δ15N for PM2.5 and PM10. TN contents in PM2.5 show high levels on 29 July and 2 August, whereas the levels in PM10 show a gradual increase during sampling period with highest values on 1–2 August. On the other hand, δ15N showed higher values on 2 August in both fractions. The relationships among biomass burning tracers (nss-K+ and LG, hereafter abbreviated as LG), TN and δ15N were examined (Fig. not shown here). TN showed good correlation with nss-K+ (r
2=0.63, p<0.001 in PM2.5 and r
2=0.55, p<0.001 in PM10) and LG (r
2=0.33, p<0.05 in PM2.5 and r
2=0.42, p<0.001 in PM10). In contrast, δ15N showed poor correlation with nss-K+ (r
2=0.33) and LG (r
2=0.14) in PM2.5 but showed good correlation with nss-K+ (r
2=0.67, p<0.001) and LG (r
2=0.51, p<0.05) in PM10. The and
, which are important constituents of TN (Pavuluri et al., Citation2010), may have been enhanced in those days from local sources possibly by gas-to-particle conversion of NH3 and NOx (secondary formation).
Fig. 6 Temporal variation of TN and δ15N in (a) PM2.5 and (b) PM10 during the May–August 2011 sampling period at Morogoro.
Variabilities of δ15N for both sizes (PM2.5 and PM10) were larger than those of δ13C. These variations may be due to changes in the contribution of local sources and secondary formation pathways of nitrogen aerosols (Widory, Citation2007; Pavuluri et al., Citation2010). However, larger δ15N values for PM10 in July–August 2011 may have originated from soil dust in addition to the influence of biomass burning activities (Turekian et al., Citation1998), being supported by good correction (r 2=0.62) between δ15N and Ca2+ (crustal element) for PM10 in same period. It is important to note that our site is neither influenced by fossil fuel combustion products that are less enriched with 15N (δ15 N<0‰) (Widory, Citation2007), nor contributed by particulate nitrogen from marine emissions; δ15N did not correlate with Na+/TN ratios. Hence, relatively high δ15N ratios obtained in the present aerosol samples could not be explained by the influence of marine aerosols and anthropogenic activities.
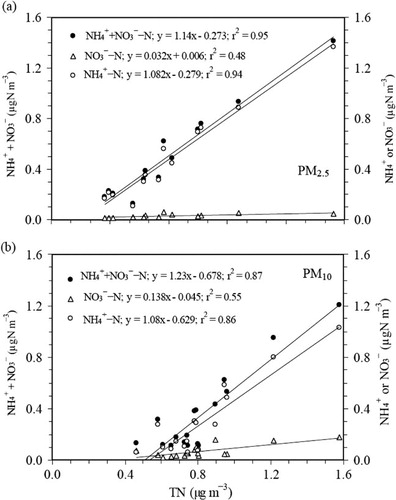
The contributions of inorganic–N species ( and
) to TN (inorganic plus organic–N) measured by EA were calculated.
was found to account on average for 62.5% of TN (range: 20.9–88.7%) in PM2.5 and 34.4% (range: 7.9–85.0%) in PM10, whereas
comprised on average of 4.1% (range: 2.8–8.8%) and 8.0% (range: 3.5–17.5%) in PM2.5 and PM10, respectively. Higher contribution of
to TN than
may indicate a strong NH3 emission from biomass burning, cattle (livestock) farms, open sewage and landfills (Sutton et al., Citation2000). Outflow of domestic sewage systems and dumping of solid waste into open landfills are common in Tanzania. On the other hand, the global nitrogen contributions from animal manure have been estimated to be between 40 and 60% for
and below 10% for NOx (Oenema and Tamminga, Citation2005). shows relations between
,
,
plus
, and TN in PM2.5 and PM10. Strong positive correlations (p<0.001 in PM2.5 and p<0.05 in PM10) suggest that significant portion of TN was mainly composed of
and, to lesser extent,
, indicating that organic nitrogen (non-water soluble) is less important in the Morogoro aerosols. NH3 from biomass burning is less enriched with 15N (Turekian et al., Citation1998).
Fig. 7 Relation between -N,
-N and (
+
)-N with TN in (a) PM2.5 and (b) PM10 during the sampling period.
A good correlation was obtained for both PM2.5 and PM10 between δ15N and TN during sampling period (r
2=0.59 and r
2=0.57, p<0.05), respectively) (Fig. not shown). These correlations may suggest a presence of different forms of nitrogen and/or larger δ15N ratios in aerosols. Also, a good correlation of δ15N with TN may be associated with isotopic enrichment of 15N during exchange and portioning reactions of gaseous and particulate nitrogen species (e.g., NH3 and ), causing a enrichment of 15N in aerosol nitrogen (CitationKundu et al., 2010a; Pavuluri et al., Citation2010).
3.4. Comparisons of TC, TN, and their isotopic ratios with other studies
Concentrations of TC, TN, δ13C and δ15N in Tanzania (Table and 2) are compared with those reported from Africa and other sites around the world. Mean TC/aerosol mass ratios in Tanzania are 19.1–21.1% in PM2.5 and 16.1–18.1% in PM10. TC contents from our site are comparable to or lower than those (1.6–46.4 µg m−3) reported in tropical aerosols from the Ivory Coast in West Africa (Cachier et al., Citation1985) and those (14.0–55.0 µg m−3) from central Africa (Ruellan et al., Citation1999).
We found higher values of δ13C of TC in PM2.5 during the July and August 2011 period. Aerosol studies in the Ivory Coast and Burkina Faso (West Africa) reported larger δ13C in similar months when the contribution of C4 plants sources to the atmospheric aerosols was dominant (Cachier et al., Citation1985). Studies from the Amazon basin in Brazil, where influence of biomass burning is significant, showed average δ13C value of −25.8±0.5‰ (range: −26.9 to −24.9‰) in Santarém, Pará State, which is an area dominated with C3 plants (Martinelli et al., Citation2002), and average δ13C value of -24.7‰ (range: -26.1 to -23.5‰) in Rond[otilde]nia (CitationKundu et al., 2010b). Hence, it is likely that possible sources of organic aerosols over our sampling site could be regional biomass burning of C3 and C4 plants (Gelencsér, Citation2004; Rommerskirchen et al. Citation2006; Vogts et al., Citation2009).
On the other hand, the C/N ratios (6.3–13.9 in PM2.5 and 6.9–14.1 in PM10) found in Tanzania are much higher than those reported in aerosols from India and Korea (Pavuluri et al., Citation2010; Jung and Kawamura, Citation2011), whereas δ15N values are comparable to those (range: +8.3 to +18.7‰) from the Amazon basin (mean: +11.5±2.1‰) and Piracicaba, São Paulo, Brazil (mean: +10.6±2.8‰), regions that are significantly influenced by biomass (C3 and C4 plants) burning (Martinelli et al., Citation2002).
3.5. Contribution from burning of C3 and C4 plants to aerosol particles
Biomass and biofuel combustion is common in both rural and urban areas in southern African countries including Tanzania. Use of wood and charcoal for domestic cooking and heating in Tanzania is enhanced in wet season (March to June), whereas field burning of agriculture residues, charcoal-making operations and forest/wild fires which cover small areas and a short duration occur in dry season (July to October) (Swap et al., Citation1996; Mkoma et al., Citation2009b). It is therefore likely that changes in δ13C of TC can be modulated by biomass/biofuel burning activities including savanna fire events of southern African regions (Swap et al., Citation1996) and domestic wood burning.
The southern African aerosol studies based on stable carbon isotopic compositions suggest a predominant burning of C3 plants (Lajtha and Marshall, 1994). Recent studies on land cover and cropland distribution reported that larger areas of East Africa where Tanzania locates are covered with C3 and C4 vegetation, which include tropical grasses, deciduous tropical forest, shrubs and woodlands (Still et al., Citation2003; Rommerskirchen et al. Citation2006; Vogts et al. Citation2009). Most southern African countries are characterized by savanna ecosystems and the main vegetation types in Madagascar and Mozambique (possible source regions of air masses) are tropical forest, woodlands and shrubs (Arino et al., Citation2008). Land use change, especially the conversion of natural vegetation to cropland, can result in a range of environmental impacts including aerosol loading into the ambient atmosphere.
Further, Cachier et al. (Citation1985) found larger δ13C values for the aerosols in Africa during dry season months. Hence, it is very likely that contributions of C4 plant burning to ambient aerosols in Tanzania are important during the sapling period. Because our sampling site is located in a typical rural area, contribution of anthropogenic TC from traffic should be minimal, whose δ13C values range from −28 to −26‰ (Widory, Citation2006). The aerosol chemical mass closure in previous study at Morogoro (Mkoma et al., Citation2009b) showed that elemental carbon (EC) was insignificant attributing only 1.9% of the gravimetric PM10 mass. It was mainly derived from charcoal-making process and field burning of agricultural residues (Mkoma et al., Citation2009b). Secondary organic aerosol formation from biogenic VOCs is assumed to be less significant than biomass/biofuel combustion in PM2.5 (high temperature). Since our study has not been done near source site and lacks a representative emission factors for the region, we estimate relative contributions from the burning of C3 plants (%C3) and C4 plants (%C4) to TC based on stable carbon isotopic composition of TC as follows:5
6
where (δ13C)aerosol is stable carbon isotopic composition of aerosol particles. (δ13C)C3 and (δ13C)C4 are isotope ratios of C3 and C4 plants, respectively, whose end members are assumed to be −30.5‰ and −13.5‰ based on average δ13C determined for leaves of C3 and C4 vegetation (Martinelli et al., Citation2002).
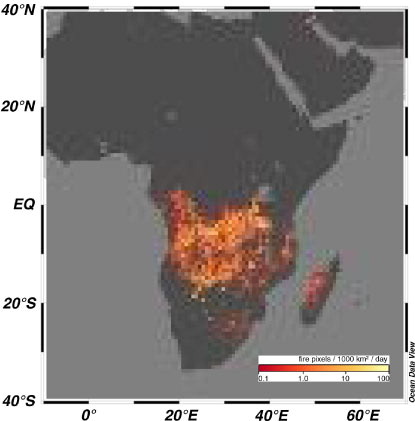
Using eqs. 5 and 6, average contributions of burning C3 plants to TC were 59% in both PM2.5 (range: 42–74%) and PM10 (range: 39–64%). Conversely, average contributions of C4 plants were 41% in PM2.5 (range: 26–58%) and PM10 (range: 36–61%). The main dominant crops in the eastern and southern Africa are maize, rice, sorghum, beans and wheat, which could significantly contribute to aerosols loading during the burning season of agricultural residue in addition to wild fires. Thus, both C3 and C4 plant residues are burned and the burning products should show different isotopic composition. In our study, we found strong positive correlation between δ13C of TC with nss-K+ (r 2=0.64-0.72) and weak correlations with LG (r 2=0.31-0.32) in both PM2.5 and PM10 (a–d). These results indicate that the burning activities of C3 and C4 plants have a significant influence on organic aerosol composition (Fu et al., Citation2012) over Tanzania. We found active fire spots from MODIS satellite images in June to end of October () in Madagascar, Mozambique and Tanzania where air masses mostly travelled through the region to our sampling site in Morogoro during our campaigns (http://earthobservatory.nasa.gov/GlobalMaps/view.php?d1=MOD14A1_M_FIRE).
Fig. 8 Linear relation between δ13C of TC with nss-K+ and levoglucosan in (a, b) PM2.5 and (c, d) PM10 during the sampling period in tropical aerosols from Tanzania.
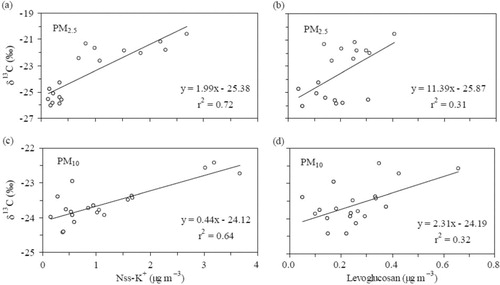
Fig. 9 Biomass burning active fire spots detected by MODIS satellite images (from NASA website) over southern and eastern Africa and Madagascar in July 2011.
Our results seem to be consistent with other studies, which indicate that contributions from the burning of C3 and C4 plants are dominant in Africa (Still et al., Citation2003; Rommerskirchen et al. Citation2006; Vogts et al. Citation2009). However, in the large land area that is covered by savanna vegetation, contribution of biomass burning from C4 plants (e.g., grasses) to ambient aerosols could be large (Rommerskirchen et al. Citation2006). A study in Rondônia, Brazil, reported an average contribution of C4 plants of 40% (range: 46–54%) (CitationKundu et al., 2010b). Also, Martinelli et al. (Citation2002) reported a minimum and maximum contribution of C4 plants to aerosol particles to be 45 and 62%, respectively, with a mean of 55% in Piracicaba, southeast of the Amazon basin in Brazil. Therefore, in Tanzania depending on size fraction of the aerosol particles, the contribution of C3 and C4 plants from biomass/biofuel burning is expected to be important.
4. Summary and conclusions
This study reports stable carbon and nitrogen isotopic composition of the atmospheric aerosols from Tanzania, East Africa. δ13C of TC in PM2.5 ranged from −26.1 to −20.6‰, whereas those of PM10 showed a narrow range of −24.4 to −22.4‰. TC showed positive correlations with δ13C and with LG (and nss-K+) during the campaign, suggesting an influence of biomass burning including domestic wood burning and field burning of agricultural wastes. δ13C of TC showed that average contributions of C4 plants were 41% in both PM2.5 and PM10. During dry season, δ13C of fine particles are more enriched with 13C than coarse particles, suggesting more contribution from burning of C4 plants under the dry conditions. δ15N ranged from 13.4–22.1‰ (mean: +16.2±2.7‰) in PM2.5 and 10.4–18.7‰ (mean: +13.7±2.3‰) in PM10. δ15N showed higher ratios in fine particles than coarse particles in both wet and dry season. The larger δ15N in fine fraction suggests an isotopic enrichment of 15N in the particles during gas (NH3) and particle [(NH4)2SO4] partitioning reaction. We also found that accounts for up to 88.7% of TN in fine aerosols.
5. Acknowledgement
This study was in part supported by the Japan Society for the Promotion of Science (JSPS) through grant-in-aid No. 24221001 and the Environment Research and Technology Development Fund (B-0903) from the Ministry of the Environment, Japan. S.M. acknowledges the financial support by JSPS. We thank Mr. Filbert T. Sogomba of the Department of Physical Sciences (SUA) for sample collection and Chandra M. Pavuluri for his valuable comments. The authors also thank the NOAA Air Resources Laboratory (ARL) for the provision of the HYSPLIT transport and dispersion model and/or READY website (http://www.arl.noaa.gov/ready.php) used in this publication.
Related Research Data
References
- Arino O, Bicheron P, Achard F, Latham J, Witt R, Weber J-L. Globcover. The most detailed portrait of Earth. 2008. European Space Agency, Bulletin 136. Online at: http://www.esa.int/esapub/bulletin/bulletin136/bul136d_arino.pdf.
- Ballentine D. C , Macko S. A , Turekian V. C . Variability of stable carbon isotopic composition in individual fatty acids from combustion of C4 and C3 plants: implications for biomass burning. Chem. Geol. 1998; 152: 151–161.
- Billmarka K. A , Swap R. A , Macko S. A . Stable isotope and GC/MS characterization of southern African aerosols. S. Afr. J. Sci. 2005; 101: 1–3.
- Cachier H , Buat-Ménard P , Frontugne M . Source terms and source strength of the carbonaceous aerosol in the tropics. J. Atmos. Chem. 1985; 3(4): 469–489.
- Cavalli F , Facchini M. C , Decesari S , Mircea M , Emblico L , co-authors . Advances in characterization of size-resolved organic matter in marine aerosol over the North Atlantic. J. Geophys. Res. 2004; 109: D24215. DOI: 10.1029/2004JD005137.
- Draxler R. R, Rolph G. D. HYSPLIT (HYbrid Single-Particle Lagrangian Integrated Trajectory) Model access via NOAA ARL READY Website. 2012. NOAA Air Resources Laboratory, Silver Spring, MD. Online at: http://ready.arl.noaa.gov/HYSPLIT.php.
- Fu P. Q , Kawamura K , Chen J , Li J , Sun Y. L , co-authors . Diurnal variations of organic molecular tracers and stable carbon isotopic composition in atmospheric aerosols over Mt. Tai in the North China Plain: an influence of biomass burning. Atmos. Chem. Phys. 2012; 12: 8359–8375.
- Fuzzi S , Decesari S , Facchini M. C , Cavalli F , Emblico L , co-authors . Overview of the inorganic and organic composition of size-segregated aerosol in Rondônia, Brazil, from the biomass burning period to the onset of the wet season. J. Geophys. Res. 2007; 112: D01201. DOI: 10.1029/2005JD006741.
- Gelencsér A . Carbonaceous Aerosol, Atmospheric and Oceanographic Sciences Library. 2004; Nature: Springer. 350. 30.
- Hitzenberger R , Berner A , Galambos Z , Maenhaut W , Cafmeyer J , co-authors . Intercomparison of methods to measure the mass concentration of the atmospheric aerosol during INTERCOMP2000-influence of instrumentation and size cuts. Atmos. Environ. 2004; 38: 6467–6476.
- Hopke P. K , Xie Y , Raunemaa T , Biegalski S , Landsberger S , co-authors . Characterisation of the Gent Stacked Filter Unit PM10 sampler. Aerosol Sci. Technol. 1997; 27: 726–735.
- Jung J , Kawamura K . Springtime carbon episodes at Gosan background site revealed by total carbon, stable carbon isotopic composition, and thermal characteristics of carbonaceous particles. Atmos. Chem. Phys. 2011; 11: 10911–10928.
- Kawamura K , Kobayashi M , Tsubonuma N , Mochida M , Watanabe T , Lee M , Hill R. J , etal. Organic and inorganic compositions of marine aerosols from East Asia: seasonal variations of water-soluble dicarboxylic acids, major ions, total carbon and nitrogen, and stable C and N isotopic composition. Geochemical Investigations in Earth and Space Science: A Tribute to Isaac R. Kaplan. 2004; Amsterdam, Netherlands: Elsevier. 243–265. The Geochemical Society, Publication No. 9.
- Kawamura K , Watanabe T . Determination of stable carbon isotopic compositions of low molecular weight dicarboxylic acids and ketocarboxylic acids in atmospheric aerosol and snow samples. Anal. Chem. 2004; 76: 5762–5768.
- Kundu S , Kawamura K , Andreae T. W , Hoffer A , Andreae M. O . Diurnal variation in the water - soluble inorganic ions, organic carbon and isotopic compositions of total carbon and nitrogen in biomass burning aerosols from the LBASMOCC campaign in Rondônia, Brazil. J. Aerosol Sci. 2010b; 41: 118–133.
- Kundu S , Kawamura K , Lee M . Seasonal variation of the concentrations of nitrogenous species and their nitrogen isotopic ratios in aerosols at Gosan, Jeju Island: implications for atmospheric processing and source changes of aerosols. J. Geophys. Res. 2010a; 115: D20305. DOI: 10.1029/2009JD013323.
- Lajtha K , Marshall J. D , Lajtha K , Michener R. H . Sources of variation in the stable isotopic composition of plants. Stable Isotopes in Ecology and Environmental Science. 1994; Oxford: Blackwell Scientific Publications. 1–21.
- Levine J. S , Cofer III W. R , Cahoon JR D. R , Winstead E. L . Biomass burning a driver for global change. Environ. Sci. Technol. 1995; 29: 120A–125A.
- Martinelli L. A , Camargo P. B , Lara L. B. L. S , Victoria R. L , Artaxo P . Stable carbon and nitrogen isotope composition of bulk aerosol particles in a C4 plant landscape of southeast Brazil. Atmos. Environ. 2002; 36: 2427–2432.
- Mkoma S. L , Chi X , Maenhaut W , Wang W , Raes N . Characterisation of PM10 atmospheric aerosols for wet season 2005 at two sites in East Africa. Atmos. Environ. 2009a; 43: 631–639.
- Mkoma S. L , Maenhaut W , Chi X , Wang W , Raes N . Chemical composition and mass closure for PM10 aerosols during the 2005 dry season at a rural site in Morogoro, Tanzania. X-Ray Spectrom. 2009b; 38: 293–300.
- Mkoma S. L , Xuguang Chi X , Maenhaut W . Characteristics of carbonaceous aerosols in ambient PM10 and PM2.5 particles in Dar es Salaam, Tanzania. Sci. Total Environ. 2010; 408: 1308–1314.
- Mkoma S. L , Kawamura K , Fu P. Q . Contributions of biomass/biofuel burning to organic aerosols and particulate matter in Tanzania, East Africa, based on analyses of ionic species, organic and elemental carbon, levoglucosan and mannosan. Atmos. Chem. Phys. 2013; 13: 10325–10338.
- Narukawa M , Kawamura K , Li S.–M , Bottenheim J. W . Stable carbon isotopic ratios and ionic composition of the high–Arctic aerosols: an increase in δ13C values from winter to spring. J. Geophys. Res. 2008; 113: D02312. DOI: 10.1029/2007JD008755.
- Narukawa M , Kawamura K , Takeuchi N , Nakajima T . Distribution of dicarboxylic acids and carbon isotopic compositions in aerosols from 1997 Indonesian forest fires. Geophys. Res. Lett. 1999; 26: 3101–3104.
- Oenema O , Tamminga S . Nitrogen in global animal production and management options for improving nitrogen use efficiency. Sci. China C Life Sci. 2005; 48(S1): 871–887.
- Pavuluri C. M , Kawamura K , Tachibana E , Swaminathan T . Elevated nitrogen isotope ratios of tropical Indian aerosols from Chennai: implication for the origins of aerosol nitrogen in South and Southeast Asia. Atmos. Environ. 2010; 44: 3597–3604.
- Riley J. P , Chester R . Introduction to Marine Chemistry. 1971; New York: Academic.
- Rommerskirchen F , Anna Plader A , Eglinton G , Chikaraishi Y , Rullkötter J . Chemotaxonomic significance of distribution and stable carbon isotopic composition of long-chain alkanes and alkan-1-ols in C4 grass waxes. Organic Geochem. 2006; 37: 1303–1332.
- Ruellan S , Cachier H , Gaudichet A , Masclet P , Lacaux J.-P . Airborne aerosols over central Africa during the experiment for regional sources and sinks of oxidants (EXPRESSO). J. Geophys. Res. 1999; 104: 30673–30690.
- Still C. J , Berry J. A , Collatz G. J , DeFries R. S . Global distribution of C3 and C4 vegetation: carbon cycle implications. Global Biogeochem. Cycles. 2003; 17(1): 1006. DOI: 10.1029/2001GB001807.
- Streets D. G , Yarber K. F , Woo J.-H , Carmichael G. R . Biomass burning in Asia: annual and seasonal estimates and atmospheric emissions. Global Biogeochem. Cycles. 2003; 17(4): 1099. DOI: 10.1029/2003GB002040.
- Sutton M. A , Dragosits U , Tang Y. S , Fiwler D . Ammonia emissions from non-agricultural sources in the UK. Atmos. Environ. 2000; 34: 855–869.
- Swap R , Garstang M , Macko S. A , Tyson P. D , Maenhaut W , co-authors . The long-range transport of southern African aerosols to the tropical South Atlantic. J. Geophys. Res. 1996; 101: 23777–23791.
- Turekian V. C , Macko S , Swap R. J , Garstang M . Causes of bulk carbon and nitrogen isotopic fractionations in the products of vegetation burns: laboratory studies. Chem. Geol. 1998; 152: 181–192.
- Turpin B. J , Saxena P , Andrews E . Measuring and simulating particulate organics in the atmosphere: problems and prospects. Atmos. Environ. 2000; 34: 2983–3013.
- Vogts A , Moossen H , Rommerskirchen F , Rullkötter J . Distribution patterns and stable carbon isotopic composition of alkanes and alkan-1-ols from plant waxes of African rain forest and savanna C3 species. Org. Geochem. 2009; 40: 1037–1054.
- Widory D . Combustibles, fuels and their combustion products: a view through carbon isotopes. Combust. Theor. Model. 2006; 10: 831–841.
- Widory D . Nitrogen isotopes: tracers of origin and processes affecting PM10 in the atmosphere of Paris. Atmos. Environ. 2007; 41: 2382–2390.