
Abstract
Wind-blown dust derived from the arid and semi-arid regions is an important atmospheric component affecting the Earth's radiation budget. Dust storms are prevailing in central Asia. Deposition of atmospheric dust in snow was measured on Glacier No.12 (5040 m a.s.l.) in the Laohugou Basin and Shiyi Glacier (4510 m a.s.l.) in the Yeniugou Basin, of western Qilian Mountains, China, mainly focusing on dust concentration and size distribution, chemistry, SEM–EDX analysis and Nd–Sr isotopic composition. An analysis of spatial distribution of dust concentration and size distribution in the snow cover at two sites suggests that deposition of dust in western Qilian Mountains is different between sites as the environment changes from west to east. Mean mass concentration of dust with 0.57 < d<40 μm in the snow is 3461 μg kg−1 on Glacier No.12 and 2876 μg kg−1 on Shiyi Glacier, respectively. Annual flux of dust deposition to western Qilian Mountains has a range of 143.8–207.6 μg cm−2 yr−1 for particles with 0.57 < d<40 μm. Dust layers in the snowpit contain Ca- and Na-rich materials typically found in Asian dust particles. Number–size distribution indicated that most of the dust diameter is <2.0 μm, implying the significant influences of finer particles to alpine glacier regions of central Asia. Volume size distributions of dust particles showed single-modal structures having volume median diameters from 3 to 22 μm, which is comparable to the results of dust deposition on glaciers of the adjacent Tianshan Mountains in western China. SEM–EDX analysis suggested that dust particles were mainly composed of mineral particles, besides some fly ash particles and soot. EDX shows that mineral particles contain Si-, Al-, Ca-, K-, and Fe-rich materials, such as quartz, albite, aluminate, etc. The Nd–Sr isotopic composition of insoluble particles in two glaciers showed that Badain Jaran Desert and Qaidam Basin were the most possible source regions of dust in the western Qilian Mountains. Physicochemical constituents of dust indicated that the snowpack was influenced by both local atmospheric environment, e.g. local dust, and anthropogenic activities in central Asia.
1. Introduction
The presence of dust particles in snow and ice is a key factor in controlling albedo and subsequent glacier melting within the global warming perspective. An increase in the dust content of snow will decrease its albedo and induce enhanced melting (Warren and Wiscombe, Citation1980; Yasunari et al., 2010), change the duration of snow cover (Painter et al., Citation2007) and affect the timing of glacier runoff (Fujita, Citation2007). Wind-blown mineral dust derived from the crustal surface is also an important atmospheric component (Osadaet al., Citation2004) affecting the Earth's radiation budget (e.g. Nakajima et al., Citation1989; Andreae, Citation1995; Tegen and Lacis, Citation1996). Mineral dust is an important indicator of changes in the atmosphere associated with changes in temperature, precipitation and atmospheric circulation (Thompson and Wayne, Citation1975; Thompson and Thompson, Citation1980, Citation1981; Thompson et al., Citation1989, Citation1998; Wake et al., Citation1994; Aizen et al.,Citation1996; Kahl et al., Citation1997; Zdanowicz et al., Citation1998; Liu et al., Citation1999a; Ruth et al., Citation2003; Gao et al., Citation1992). Aerosol dust information can be recorded and stored in the snow and ice of high mountains and of the Polar Regions. Much research has been carried out concerning dust records in ice cores to understand paleo climate change (e.g. Thompson and Wayne, Citation1975; Thompson and Thompson, Citation1980, Citation1981; Thompson et al., Citation1989, Citation1998). Other research has measured dust deposition in recent snow to understand present climate and environment conditions (Wake et al., Citation1994; Zdanowicz et al., Citation1998; Osada et al., Citation2004; Wu et al., Citation2010). Atmospheric transport and transformation processes (Merrillet al., Citation1989; Uno et al., Citation2001) of the dust particles have also been studied to characterize the geochemical role of aeolian dust events in the Asian region. These dust events have been observed frequently in spring over the Asia-Pacific region (Koizumi, Citation1932; Arao et al., Citation2003).
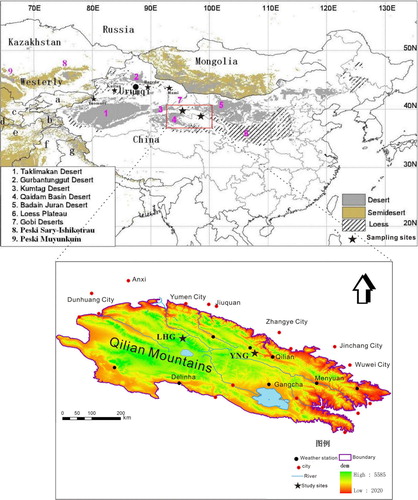
The Qilian Mountains in western China are located in an arid and semi-arid region of central Asia, the source region of Asian dust (). Dust storms are an important phenomenon in this region (e.g. Wake et al., Citation1994; Aizen et al., Citation1996, Citation2004; Kreutz et al., Citation2001; Dong et al., Citation2010). Aerosol dust particles deposited in the snow of high mountain glaciers contain information on the atmospheric environment at high elevation, and may be an important indicator of global climate change, as dust concentration and size distribution are different under various climatic conditions. It is thus important to investigate the characteristics of dust deposition in the Qilian Mountains. Chemical analyses and meteorological correlation suggest that the dust layers found in the snow cover of western Qilian Mountains formed by the deposition of Asian dust-storm particles. However, the processes of formation of the dust layers and characteristics of the dust particles in the snow cover on the glaciers of this region remain unclear. Furthermore, the amount of dust particles deposited close to the snow-forming cloud altitude may provide a useful insight into the free-tropospheric fraction of dust deposition over the central Asian region. Glacier No.12 in the Laohugou (LHG) Basin and Shiyi Glacier in the Yeniugou (YNG) Basin are located in the western Qilian Mountains, China, where minimal research has been carried out on atmospheric dust deposited on snow and glaciers. We investigate the concentration, flux, size distribution, morphology and chemical constituents, and sources of aerosol dust particles in the snow packs on the two glaciers. SEM–EDX (scanning electron microscope–energy dispersive X-ray detector) was used for dust morphology and chemical composition analysis. The Nd–Sr isotopic composition of insoluble particles in snow samples was used to discover the possible sources of dust particles in the region. The Nd–Sr isotopes are generally considered to be reliable indicators for the provenance of sediments not only because geologic bodies have different Nd–Sr isotopic compositions depending on their origin and age, but also because the Nd–Sr isotopes have limited alternations during the surficial processes such as weathering and transportation (Goldstein and Jacobsen, Citation1988; Grousset and Biscaye, Citation2005; Chen et al., Citation2007). Backward trajectory analysis was also employed to examine the transport pathway of dust particles. Moreover, previous research at other sites in the adjacent Tianshan Mountains, such as Glacier No.72 in Tuomuer region (Dong and Li, Citation2011; Dong et al., Citation2011), Glacier No.51 in Kuitun Haxilegen, Glacier No.1 at the headwater of Urumqi River and Miaoergou Glacier in Hami (Dong et al., Citation2009), was also compared in this work to show regional difference of atmospheric dust deposition in the Qilian Mountains and Tianshan Mountains, at the source region of Asian dust in western China.
Fig. 1 Location of investigated glaciers of Glacier No.12 in the LHG Basin, and Shiyi Glacier in the YNG Basin in western Qilian Mountains.
2. Material and methods
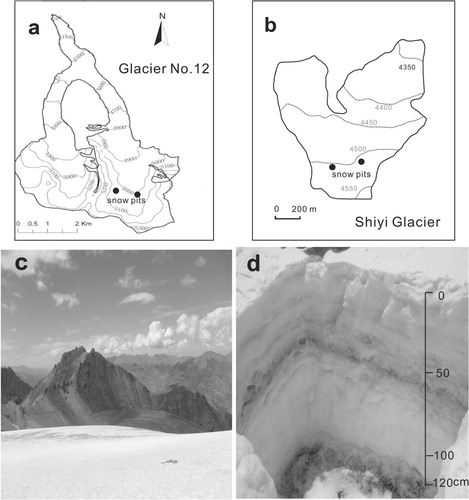
shows a location map of the Qilian Mountains and the sampling sites, Glacier No.12 (39.25°N, 99.33°E) in the LHG Basin, and Shiyi Glacier (33.12°N, 99.52°E) in the YNG Basin, western Qilian Mountains, China. During August 2008 to July 2012, nine snow pits with depths of 95–324 cm were excavated at the accumulation zone with altitudes of 5040 on Glacier No.12 and 4510 m a.s.l. on Shiyi Glacier, respectively (), among which five snow pits were derived from Glacier No.12 in 2008 and 2012, respectively; a further four snow pits were derived from Shiyi Glacier in 2011 and 2012, respectively. All snow samples were collected in late spring and summer. Based on the dust layers and seasonal variation of chemical constituents, the nine snow pits covered the years of snow deposition during 2006–2012. Snow temperature observed at two glaciers is relatively low, with values of −2.1 to −4.3°C in Shiyi Glacier, and −2.5 to −5.8°C in Glacier No.12. The sampling site is suitable for continuous snow accumulation because there is a near-flat area of about 200×200 m2, leading to uniform snow deposition. Stratigraphy was recorded for all snow pits, and then a snowpit wall was cleaned and a total of 185 snow samples were collected with a weight of 100 g per sample at an interval of 5 cm using a pre-cleaned stainless steel shovel and polyethylene gloves. Samples were stored in Whirl-Pak bags and kept frozen until further analysis. Snow density, snow temperature and snow grain size were measured at the same horizontal layers. All samples were shipped frozen from the sampling sites and stored at −18°C until time for analysis. Samples were then quickly melted in a microwave oven and aliquots were immediately collected for microparticle and chemical analysis in our laboratory to avoid wall adhesion of particles after melting.
Fig. 2 The contour map and photographs showing (a) the flat location of snowpits on Glacier No. 12, (b) the flat location of snowpits on Shiyi Glacier, (c) Shiyi Glacier and surroundings in YNG Basin and (d) a typical snow pit for sampling on Glacier No. 12 in LHG Basin.
Microparticle concentrations and size distributions were measured on an Accusizer 780A counter, which uses the Single-Particle Optical Sensing (SPOS) method, equipped with a 120 orifice (Zhu et al., Citation2006; Dong et al., Citation2009). Measurements were performed under class 100 conditions on sample aliquots diluted with a pre-filtered NaCl solution to give a 2% vol. electrolyte concentration. The data were acquired for a size range of 0.57–400 μm (micro meters) equivalent spherical diameter (d). Routine analysis of filtered deionized water blanks showed background counts to be on average 10 times lower than in samples. Background counts were also subtracted from the sample data. All samples were analysed in random order and in triplicate. Results were then averaged for individual samples, yielding an estimated error of 10% or less on particle number concentrations. The mass and volume size distribution of microparticles were calculated from the raw count data by assuming spherical particles of uniform density ρ=2.6 g cm−3, which is close to that of average crustal material (Wake et al., Citation1994; Zdanowicz et al., Citation1998). Mass was derived by integrating the mass size distribution over the measured diameter range and normalizing the result to the sample volume. We also computed the volume size distribution fitted with log-normal distribution:1 fitted to particles with d (diameter) <40 μm (Wake et al., Citation1994; Steffensen, Citation1997). The number of particles >40 μm is very low, and many of the snow samples contain only a few such particles. Calculation of their contribution shows that as there are so few large particles compared to the fine particles, they make a negligibly small contribution to the total mass deposition.
In addition to microparticles, the concentrations of major ions (Na+, Mg2 + , Ca2 +, and Cl−) were measured at trace levels on a Dionex-600 ion chromatograph using the procedure described by Buck et al. (Citation1992). The blank value for major ions is shown in (μg kg−1). The mean blank value for the whirl pack bags for dust particles number is 444 mL−1 in the laboratory measurements of this work. These blank values were subtracted from the sample data.
Table 1. The blank value for major ions of the whirl pack bags in the lab analysis (μg kg−1)
To improve our understanding of the physical and chemical properties of individual particles from the snowpack, snow samples were also analysed to determine the particle morphology and chemical composition, using a scanning electron microscopy coupled with an energy dispersive X-ray spectrometer (SEM–EDX). We chose samples in different layers of the snow pit for both glaciers and dust layers, including dust in surface snow, fine firn, and coarse firn, and a total of 10 snow samples from two glaciers were melted at room temperature and filtered on polycarbonate filters (Whatman Corporation) with a diameter of 47 mm and a pore size of 0.8 μm. Thus, only particles with diameters >0.8 μm were collected and analysed. The filtrations were completed in a class 1000 clean room at the State Key Laboratory of Cryospheric Sciences, Chinese Academy of Sciences. Polycarbonate filters were best suited for SEM observation due to the smooth surface texture, which makes individual particles much easier to discern than other types. First, approximately one tenth of the polycarbonate filter was cut and then glued to a standard 12.5 mm aluminium SEM stub using double-faced adhesive carbon tape. Then, the specimen was coated with a thin carbon film by the electric arc high vacuum method. A Zeiss EVO MAR 10 SEM equipped with EDX was used for manual analyses. Operating conditions were 20 kV accelerating voltage and 480 pA beam current with spectral acquisition times of 60 seconds.
Meanwhile, samples were similarly chosen for both glaciers, and 12 snow samples in different dust layers were filtered for Nd–Sr isotopic analysis. Nd–Sr isotopic data were acquired using a Finnigan MAT-262 mass spectrometer (Thermo Scientific, Waltham, MA, USA, Xu et al., Citation2012). The 87Sr/86Sr and 143Nd/144Nd ratios were corrected for mass fractionation relative to 86Sr/88 Sr=0.1194 and 146Nd/144 Nd=0.7219, respectively. Meanwhile, five independent runs of standard Ames metal solutions and NBS987 yielded mean values of 0.51244±0.000018 for the 143Nd/144Nd ratio and 0.710246±0.000021 for the 87Sr/86Sr ratio. The maximum values of blank samples were <0.1 ng for both Sr and Nd. For convenience, the 143Nd/144Nd ratios were normalized and denoted as ɛNd(0)=[(143Nd/144Nd)/0.512638–1]×104.
2.1. Trajectory analysis
Back-trajectory analysis has been applied widely in the field of atmospheric and glaciological sciences (Kahl et al., Citation1997; Raben et al., Citation2000; Theakstone, Citation2008). The Hybrid Single-Particle Lagrangian Integrated Trajectory model, HYSPLIT4 (Air Resources Laboratory, US National Oceanic and Atmospheric Administration (NOAA) http://www.arl.noaa.gov/ready/hysplit4.html), which has been used to model air-mass trajectories elsewhere (Falkovich et al., Citation2001; Marenco, Citation2006), was used to compute back trajectories to Glacier No.12 and Shiyi Glacier, using NOAA/US National Centers for Environmental Prediction (NCEP) reanalysis meteorological data. Back trajectories up to an altitude of 4510 m (Shiyi Glacier) and 5000 m (Glacier No.12) for 3 d with a daily resolution were adopted to simulate the routes of air masses arriving at the sampling site at 1200 hours Beijing time (0400 hours UTC) during Asian dust period in northwestern China.
3. Results and discussion
3.1. Number and mass concentration of mineral dust particles in the snow
Previous research shows that if the deposition of snow is continuous, i.e. without redistribution of snow, atmospheric signals such as mineral dust deposition should be preserved in sequence in the snow layers (Osada et al., Citation2004). In this study, the environment is favourable for continuous snow deposition, as the terrain is flat at the sampling site and annual wind speed around the sampling site is small. The average wind speed is 6.4 m s−1, during July 2011 to August 2012, observed by the automatic weather station nearby. The maximum depth of snow at the sampling site on Glacier No.12 and the Shiyi Glacier is about 300 and 200 cm, respectively, reached to glacier ice. Observation shows that the average snow accumulation rate is about 500–600 mm a−1 (Du et al., Citation2008). The western Qilian Mountains region is mainly affected by westerly winds in spring and summer, bringing plentiful precipitation from the Atlantic Ocean and moisture from lakes and seas in central Asia and other regions to the west of the study area, e.g. the Mediterranean and Caspian Seas (Aizen et al., Citation1996, Citation2004), and also affected by East Asian monsoon in summer. Based on the dust layers and seasonal variation of chemical constituents, the nine snow pits on Glacier No.12 and Shiyi Glacier reflects the deposition of snow in 2006–2012. shows the number and mass concentration of dust particles in the snow pack. The average dust number concentrations in two sites are 269×103 and 243×103 mL−1 in Glacier No.12 and the Shiyi Glacier, respectively. The maximum dust number concentration (measured as number of particles per millilitre or mL) is 503×103 mL−1, while the minimum is 97×103 mL−1, with an average of 256×103 mL−1 for particles with 0.57<d<40 μm. For dust mass concentration, the mean is 3461 and 2876 μg kg−1, with an average of 3169 μg kg−1.
Table 2. Comparison of dust particles concentration at two sites in western Qilian Mountains
Based on the net annual snow accumulation rate of 600 and 500 mm at two glaciers, we derived an average value for the modern aeolian dust flux to Glacier No.12 and Shiyi Glacier of 207.6 and 143.8 μg cm−2 yr−1 for particles with 0.57 < d<40 μm, respectively. Despite their similarity, these values show a decreasing trend from west to east. We assume that all particles extracted from the snow are mineral dust particles, but it is possible that small quantities of other types of particles (e.g. fly ash and other anthropogenic materials, fragments of biological materials, cosmic particles and black carbon) may also have been incorporated in the snow. However, we think the overall conclusions of the study are credible, because the dust particles dominate other types of particles in the snow pits. The lateral variation of dust concentration and flux in the western Qilian Mountains can be attributed to the influence of the dust source area, which may vary between the research sites. LHG Glacier No.12, which has the higher mass concentrations, is very close to the Gobi Desert, Qaidam Basin and the Badain Jaran Desert, and is thus more likely to be strongly affected by local/ regional dust storms. The YNG Shiyi Glacier is located more centrally within the mountains, where the influence of dust storms may be weaker. In addition, the mountain environment around the glaciers (e.g. wind, topography) is important and may affect the concentration of dust deposition to the snow on the glaciers.
To determine how representative the dust deposition on the glaciers in western Qilian Mountains is of regional to hemispheric atmospheric fallout, we compared the mean dust concentration and flux with similar measurements from remote polar and non-polar sites (). The mean concentration of microparticles with 0.57<d<26 μm in snow cover in western Qilian Mountains is 256×103 mL−1 with an average mass concentration of 3169 μg kg−1, which is comparable to that measured on Tuomuer Glacier No.72, Urumqi Glacier No.1, Haxilegen Glacier No.51, Hami Miaoergou Glacier in Tian Shan, and Mustagh Ata and Chongce ice caps, China (), and Tateyama in Japan. Research on the western Qilian Mountains (with flux of 143.8–207.6 μg cm−2 yr−1), Tuomuer Glacier No.72, Mustagh Ata and Chongce Ice Cap shows greater mass concentrations and flux than at other sites of Asia. They are located near the dust sources, e.g. the Badain Jaran Desert, Taklimakan Desert of central Asia, and have dust deposition rates in excess of 200 μg cm−2 yr−1 (Wake et al., Citation1994; Dong et al., Citation2011), which accounts for the coarser mode of dust measured in snow at these sites. However, shows the depositional flux of dust differs from that observed at various remote sites throughout the Northern Hemisphere. Because of long range transport, the atmospheric particle deposition is very small at some remote sites (e.g. Canadian Arctic, where the dust concentration in snow is about 135–243 μg kg−1 and flux is about 4.2–4.8 μg cm−2 yr−1 (Fisher and Koerner, Citation1981; Zdanowiczet al., Citation1998). Glacier No.12 in the Qilian Mountains in our study is close to the dust sources in central Asia, so the concentration and flux of atmospheric dust deposition are high. This suggests that the dust deposition on the snowpack in western Qilian Mountains is representative of the background crustal aerosol close to a source region.
Table 3. Atmospheric dust concentration and flux in snow and ice at various northern hemispheric sites
3.2. Characteristics of dust in snow: ionic constituents and size distribution
shows the relationship between ionic concentrations, electrical conductivity (EC) and dust concentration obtained in summer 2012 at the snow pit on Glacier No.12 in Qilian Mountains. The dusty layers correspond relatively well to concentrations of Ca2 + , Na+, pH, and EC in the profiles, while some ions peaks not seen for dust peaks may have been caused by post-deposition of major ions. There is a clear seasonality for dust deposition in snowpit, with larger amount deposition of dust and chemical constituents in springtime. There are good correlations between ions and dust in the snow cover of Glacier No.12 and Shiyi Glacier, and research at Tuomuer Glacier No.72, Urumqi Glacier No.1, Miaoergou Glacier and Glacier No. 51 (Dong et al., Citation2009) yielded similar results (). In , the value of dust is represented by the mass concentration of microparticles. Moreover, we have found that generally mean particle diameter and dust concentration are positively correlated, and dust concentrations and concentrations of major ions in solution are also positively correlated (). Previous research at Urumqi Glacier No.1 has shown that the dust peak concentration corresponds very well to peak concentrations of Cl−, Mg2 + , Ca2 + , Na+ during the sample period (Dong et al., Citation2009), indicating that these ions may have the same source as the dust particles. Vertical profiles of dust concentrations are relatively similar to variations in Ca2 + concentration. Dust peaks found in snow on the glaciers in Qilian Mountains are inferred to have originated mainly in arid regions of central Asia because high alkaline Ca2 + is a tracer of mineral dusts from desert and loess areas in the Asian continent (Ichikuni, Citation1978; Suzuki and Tsunogai, Citation1988). Most Na+ in the snow originated from a source of rich-salt minerals, most likely the salt lakes in central Asia (e.g. Qinghai and Xinjiang), based on significant correlation with Cl− and Mg2 + concentrations (Li et al., Citation2006a). The Cl−/Na+ ratios in the snow samples of our research sites range from 0.89 to 2.64, with a mean value of 1.68, much larger than 1.165 of sea salt. The increase may be caused by the salt-rich minerals of Asian dust and salt lakes, as the Cl−/Na+ ratio in the salt lake is high value, e.g. mean value of 1.86 in Qaidam Basin (Liu et al., Citation1999b), and there are many such salt sources in Qinghai and Xinjiang region, and some of the Cl− may come from KCl, the mineral sylvite, which may have originated from dust in the source basins. Research on the Tateyama Mountain, central Japan, indicated that Na+ concentrations in the snow did not correlate well with dust, because the Na+ originates from the Sea of Japan (Osada et al., Citation2004). Our results, taken together with measurements of major ions deposition in the snowpit of Qilian Mountains, suggest that the dust particles originated from the central Asian dust sources around this region (e.g. the Qaidam Basin, Badain Jaran Desert, and Gobi Desert).
Fig. 3 Snow stratigraphy and vertical profiles of snow temperature, density, ionic concentrations, electric conductivity (EC) and dust concentration of a typical snowpit on Laohugou Glacier No.12 in summer 2012. Letters (a–f) in the dust profile indicate visible distinguishable dust layers in the snowpit.
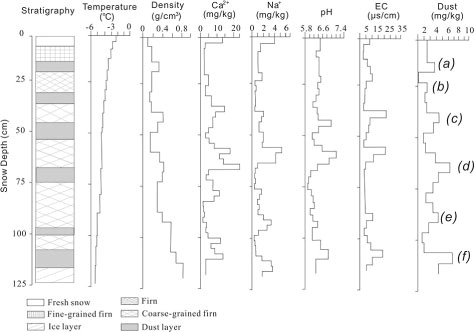
Table 4. Correlation coefficient of ions and dust in the snow pits in western Qilian Mountains
and show the average size distributions of dust particles in the snowpack. is the number–size distribution of dust particles in the snow of Glacier No.12 and Shiyi Glacier (mean of 185 snow samples) and a comparison with four other research sites in the Tianshan Mountains. Most of the particles measure d<2.0 m in the snow pits. More fine microparticles were found in Glacier No.12, which may imply more coarse particles found in the glacier of LHG Basin, as the total concentration in the snow of Glacier No.12 is higher than that of other sites. is a volume–size distribution of dust particles of Glacier No.12 and Shiyi Glacier and a comparison with other research sites in the Tianshan Mountains, in which the peak value of the curve is the modal size (μm) of the dust particles. shows the size parameters of volume size distribution fitted with log-normal distributions of dust particles in various sites shown in . The volume median diameters of the dust particles in the glaciers of western Qilian Mountains range from 3 to 22 μm. Moreover, the distribution of volume size is a single mode. The modal size of the volume size distribution at Laohugou Glacier No.12 is 12.5 μm and 12.0 μm at the Shiyi Glacier (). The atmospheric environment around the two sites in Qilian Mountains and four sites in Tianshan Mountains shows regional differences because of the long distance between them; for example, Laohugou Glacier No.12 and Hami Miaoergou Glacier (with modal size of 13.0 μm) are located in a more arid region than other sites (). Thus, the dust sources of central Asia (e.g. the Qaidam Basin, Badain Jaran Desert and Gobi Desert) have different influences on the six sampling sites. We infer that Laohugou Glacier No.12 is influenced more significantly by dust transport than the Yeniugou Shiyi Glacier.
Fig. 4 Average number size distributions of dust particles in the snowpits of glaciers in western Qilian Mountains, and comparison of average number–size distribution of dust particles with other sites in Tianshan Mountains.
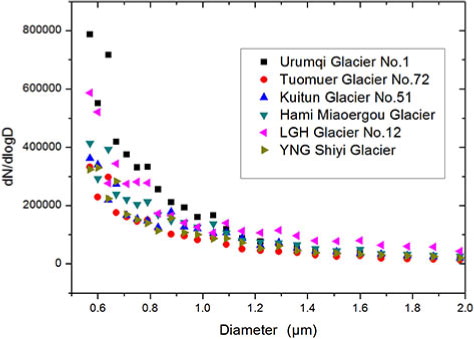
Fig. 5 Comparison of volume–size distribution of dust particles obtained at snowpit of six glaciers in western Qilian Mountains and Tianshan Mountains in central Asia.
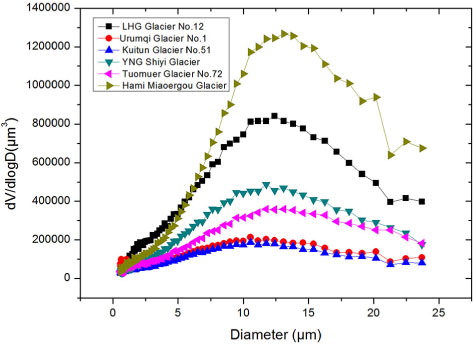
Table 5. Parameters of volume–size distribution of dust in various sites of the Qilian Mountains, and Tianshan Mountains in
Furthermore, shows volume size distribution of the dust particles in the snow layer (a–f) in . These dust layers are distinguishable as dirt layers by inspection at the snowpit. lists size parameters fitted with log-normal distributions of samples (a–f) (Junge, Citation1963; Wake et al., Citation1994; Steffensen, Citation1997). We find obvious an difference of dust size distribution between snow samples, because variability of dust-storm intensity is quite large and the sampling locations of this work are close to desert areas, and each dust event has shown different size distribution. indicated the size distribution of dust layers with relatively high and low dust concentration, and the large difference of modal size (dv) and sigma (σg) for volume size distribution between samples implies different influences by dust transport of surrounding desert areas ().
Fig. 6 Volume size distribution of dust particles in the snow layer (a–f) shown in
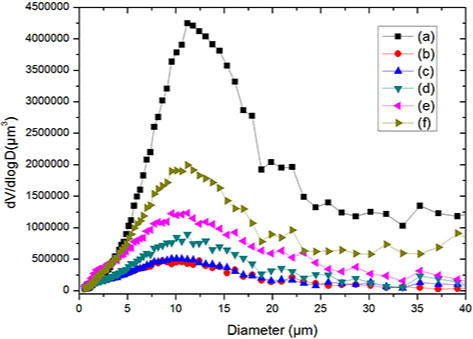
Table 6. Parameters of volume–size distribution of samples in different dust layers of
Much research concerning dust size distribution has been done at different locations around the world. In Chinese Tianshan Mountains, the volume median diameters of the dust particles are 3–25 μm (Dong et al., Citation2009Dong et al., Citation2011), while on Tateyama Mountain, the volume median diameters of the dust particles are 6–21 μm (Osada et al., Citation2004). In the Spanish Mediterranean area, the mean size fraction of dust particles in ‘red dust rain’ ranges from 4 to 30 μm, with a bi-modal structure of about 4–7 and 18–22 μm (Sala et al., Citation1996). Mean dust diameters of 4–16 μm have also been reported for Crete (Nihlén et al., Citation1995). Wagenbach and Geis (Citation1989) also report variations in mean volume diameter from 2.5 to 10 μm for visible Saharan dust layers. The volume–size distribution of dust in glaciers in central Asia exhibits similar size ranges (Wake et al., Citation1994). Median diameters of dust in snow and ice cores from Greenland, the Canadian Arctic (Penny Ice Cap) and Antarctica are about 1–2 μm (e.g. Steffensen, Citation1997; Zdanowicz et al., Citation1998; Delmonte et al., 2004; Ruth et al., Citation2003).
Our results show median diameters that are much larger than those in polar snows, but similar to those in visible dust layers in the snow at Tateyama and at Monte Rosa, European Alps, and the ‘red dust rain’ of the Spanish Mediterranean. The larger volume median diameter appears at sites closest to source regions. According to data derived from backward air trajectories from the Qilian Mountains, the typical transit time from possible major source regions (Qaidam Basin in western China, Gobi Desert in Mongolia and Badain Jaran Desert in northern China; Sun et al., Citation2001) to the Tianshan Mountains (about 1000 km distance) is 0.5–1 d in springtime. A recent study (Maring et al., Citation2003) of the change in size distribution during transatlantic dust transport suggested that a major shift of size distribution may occur within 1–2 d of transport. The volume median diameter of dust in Asia is larger than that found in polar areas and is highly variable. We suspect this is due to little change during transport because in contrast to polar dust, our study area in western Qilian Mountains is located near the source regions of Asian dust. However, further systematic representative measurements of very large aerosols and modelling studies may provide insight into variations in size distribution.
3.3. Morphological analysis and possible sources of dust particles in snowpack
The size, shape and morphology of particles are differentiating parameters under the microscope. In most cases, the factors that characterize particles are not their elementary forms, but the organization of their structures. To obtain the optimal perspective, different magnification levels are used for insoluble particles with a different purpose. In this study, the lowest magnification (500×) could discriminate in the order of tens of microns and the highest magnification (10 000×) can discriminate in the order of tens of nanometres. Comprehensive compositional and structural information can be obtained through this method. A total of 800 000 particles were observed at 3000×magnification within the magnified area, but a total of 180 particles with regular shapes (including spherical carbon particles and biological particles) were analysed by EDX to study their elemental composition and possible mineralogy.
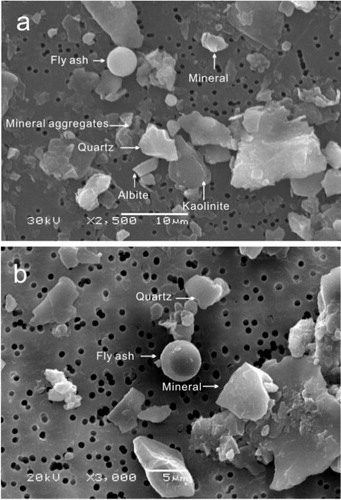
It is important to distinguish natural particles and anthropogenic spherical particles. Most of the dust particles are composed of mineral particles. Natural particles are mainly composed of mineral particles that originated from land surface materials. Often, mineral particles have sharp edges, which break along a cleavage or fractures upon particle formation (). If the mineral particles have been transported over great distances, the morphologies of particles may show a certain degree of rounding. Conversely, a number of regular morphologies are found among the insoluble particles from the surface snow of Laohugou Glacier No.12. These spherical particles are never >15 μm in diameter, and have a geometrical shape which excludes any possible explanation based on a crystalline genesis process (). Most of the particles possess a seemingly smooth texture on their surfaces. Important compositional similarities are found on these particles. Heavy elements (e.g. Pb, Zn and As) present in some of these spherical particles may be found in such high quantities that it is impossible to prove a natural origin for these particles. Smooth spherical particles, mostly fly ash particles, emanating from high temperature industrial combustion, are mostly characterized by a spherical shape, which results from melting processes that occur during their formation (Umbria et al., Citation2004).
Fig. 7 Secondary electron images of some typical dust particles based on SEM–EDX, obtained from (a) LHG Glacier No.12, and (b) YNG Shiyi Glacier.
Analysis of the elementary composition by EDX contributed additional information for classification and identification of possible origins of the captured spherical particles in snow samples. Using the chemical information derived from EDX, a general classification of the dominant fly ash particles deposited on the snowpit was obtained. Such a classification is preliminary, and establishes an approach for the evaluation of anthropogenic pollution in terms of fly ash contents. The proposed classification is shown in . As the melting points of SiO2, Al2O3, MgO and CaO are much higher than Fe2O3 and TiO2, Si-dominant spherical particles from coal combustion can be used as indicators for industrial high temperature processes (Neinavaie et al., Citation2000), such as typical coal-fired heating stations and thermal power plants emissions. Fe-dominant and Ti-dominant spherical particles from coal combustion can be used as indicators for lower temperature processes, such as foundry and iron and steel plants (Choël et al., Citation2007). According to chemical classification, the particle number of Si-dominant particles was the most abundant in all 10 snow samples (accounting for 75.4% of fly ash particles), and thus fly ash pollution from coal industry combustion was the dominant contributor in the snow packon the glaciers of western Qilian Mountains. Fe-dominant particles were the second most common particles in samples. Thus, we can infer that fly ash particle is from complicated types of industrial activities (foundry and steelwork factories, coal-fired heating stations and thermal power plants). Industry in central Asia and surrounding cities (e.g. Yumen City and Jiayuguan City) of western Qilian Mountains may be the source region of fly ash particle dispersion. However, no regularity was observed in the chemical composition of fly ash between dust layers in different snow pits. Further work needs to be carried out to investigate the spatial and seasonal variability of chemical composition.
Table 7. Chemical types of fly ash particles within evaluated samples by EDX
However, among all the dust particles, mineral particles dominate the majority of the particles in the snowpits of Qilian Mountains. Dust particles in the snow are mainly mineral particles, besides some fly ash and soot. EDX showed that mineral particles contain Si-, Al-, Ca-, K-, and Fe-rich materials, such as, quartz, albite, aluminate, etc.
The use of Nd and Sr isotopes would be a fruitful method to apply in future studies to test the interpretations made in the present study, as these methods have been used to identify source regions of dust particles in Dunde ice core of Tibetan Plateau (Wu et al., Citation2010), and the EPICA-Dome C and Vostok ice cores of the East Antarctica (Delmonte et al., Citation2004). A previous study has analysed the Nd–Sr isotopic compositions of insoluble particles in snow samples from several sites in western China (Xu et al., Citation2012). However, little research has been carried out on dust Nd–Sr isotopic and the sources for glaciers in Qilian Mountains. Based on the data from previous study and snow samples measurements in 2012, we obtained the result of possible sources for dust particles deposited in LHG Glacier No.12 and YNG Shiyi Glacier (). The Sr and Nd isotopic compositions show variations ranging from 0.715 to 0.724 in 87Sr/ 86Sr and −9.04 to −11.53 in ɛNd(0) in Glacier No.12, while ranging from 0.717 to 0.725 in 87Sr/ 86Sr, and −9.02 to −11.45 in ɛNd(0) in Shiyi Glacier.As shown in , the Nd–Sr isotopic value in Glacier No.12 and Shiyi Glacier shows different values with other glaciers, e.g. Urumqi Glacier No.1 in Tianshan Mountains, Mustagh Ata Glaciers, and East Rongbuk Glacier in the southern Tibetan Plateau, reflecting the influences of different dust sources in central Asia to particle deposition in the alpine glaciers. The glaciers in the LHG Basin and the YNG Basin were inferred to be significantly affected by the Badain Jaran Desert and Qaidam Basin in northern China, as the Nd–Sr isotopic value is very similar between them (). There exists variability of Nd–Sr isotopic values in some data sources from deserts in a previous study in western China (e.g. Honda et al., Citation2004; Tripathi et al., Citation2004; Chen et al., Citation2007; Yang et al., Citation2009; Lee et al., Citation2010; Wu et al., Citation2010). However, Research on Nd–Sr isotopic composition of Badain Jaran Desert (Chen et al., Citation2007) and Qaidam Basin (Lee et al., Citation2010; Yang et al., Citation2009) indicated very similar results with that of glaciers in western Qilian Mountains (), and our result shows large difference with other deserts, e.g. Junggar Basin, Gobi and Tengger Deserts (Honda et al., Citation2004; Chen et al., Citation2007; Lee et al., Citation2010). Thus, we can infer that dust particles deposited on the glaciers mainly originated from the Badain Jaran Desert and Qaidam Basin. Such an inference is also coincident with results of other research on Nd–Sr isotopic composition of deserts in western China. Moreover, the Taklimakan Deserts may also be the possible source of dust particles in snow of the Qilian Mountains, as data showing from other research (Honda et al., Citation2004), which need more samples and further work to demonstrate. Backward trajectory modelling is employed to analyse the sources of air masses and dust particles in the LHG Basin during central Asian dust periods (). We find that the dust in snow on Glacier No. 12 is mainly from regions to the west and north of our sampling sites, and the air mass originates mainly from the north and west (e.g. the Qaidam Basin, and Badain Jaran Desert) in springtime. Spring is the most important central Asian dust period, which typically sees transport of abundant aerosol-size dust particles from arid regions (Sun et al., Citation2001; Wang et al., Citation2004). Such an air-mass transport may significantly affect the transport and deposition processes of dust particles in the snow on the glacier in western Qilian Mountains.
Fig. 8 The Nd–Sr isotopic composition of insoluble particles in snow samples collected from LHG Glacier No.12, YNG Shiyi Glacier, and comparison with other glaciers in western China.
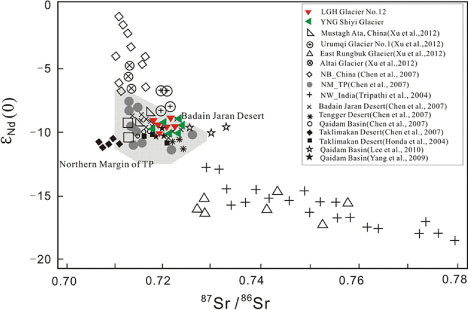
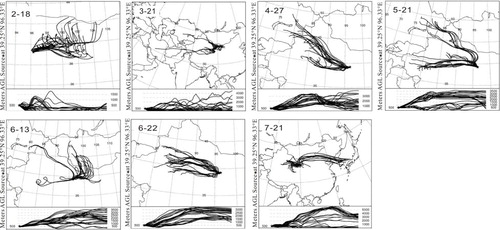
Fig. 9 Three-day backward trajectories terminated at 500 m above the ground level of the field observation site at LHG Glacier No.12 in Qilian Mountains, each panel showing trajectories on specific days of typical air-mass transport during winter, springtime and summer during the year 2012.
4. Conclusions
Atmospheric dust deposition was investigated in the snowpack on Glacier No.12 in the LHG Basin and Shiyi Glacier in the YNG Basin, of western Qilian Mountains, China. The concentration and flux of modern atmospheric dust deposition in snow is different between two glaciers, as the environment changes from west to east. Mean mass concentration of dust particles with 0.57 < d<40 μm in the snowpack is 3461 and 2876 μg kg−1, respectively. The rate of dust deposition on glaciers in the western Qilian Mountains was 143.8–207.6 μg cm−2 yr−1 for particles with 0.57<d<40 μm. Dust layers in the snowpit contain Ca- and Na-rich materials typically found in Asian dust particles. Number–size distributions of dust particles in the snowpack indicated that most of the dust particle diameter is <2.0 μm, implying the significant influences of finer particles to alpine glacier regions of central Asia. Volume size distributions of dust particles showed single-modal structures having volume median diameters from 3 to 22 μm, which is comparable to the results of adjacent Tianshan Mountains in western China. There is also an obvious difference of dust size distribution between snow samples in different dust layers, because variability of dust-storm intensity is quite large and the sampling locations in the Qilian Mountains are close to desert areas, and each dust event has shown different size distribution. The mineral phases were determined and quantified by SEM–EDX. Dust particles in the snow are mainly mineral particles, besides some fly ash and soot. EDX analysis showed that mineral particles contain Si-, Al-, Ca-, K-, and Fe-rich materials, such as limestone, quartz, albite, and aluminate, etc. According to chemical classification, Si-dominant fly ash particles were the most abundant in observed snow samples, and thus fly ash pollution from coal industry combustion was the dominant contributor in the snow pack on the glaciers. The Nd–Sr isotopic composition of insoluble mineral particles showed that the Badain Jaran Desert and Qaidam Basin were the most probable source regions for dust particles deposited in snowpacks on the glaciers of western Qilian Mountains. Physicochemical constituents of dust particles were influenced by both local atmospheric environment, e.g. local mineral dust, and anthropogenic activities in central Asia.
5. Acknowledgements
This work was funded by Innovative Research Group National Natural Science Foundation of China (41121001), by the National Natural Science Foundation of China (41301065), supported by the State Key Laboratory of Cryospheric Sciences, by the National Basic Research Program of China (973 Program, 2013CBA01801), by the China geological survey projects (1212011087114), and by the Open Foundation of MoE Key Laboratory of West China's Environmental System, Lanzhou University. We also thank the anonymous reviewers and the editor, Dr. Kaarle Hämeri, whose comments and suggestions were helpful in improving the quality of this paper.
Related Research Data
References
- Aizen V. B , Aizen E. M , Melack J , Martma T . Isotopic measurements of precipitation on central Asian glaciers (southeastern Tibet, northern Himalayas, central Tien Shan). J. Geophys. Res. 1996; 101(D4): 9185–9196.
- Aizen V. B , Aizen E. M , Melack J. M , Kreutz K. J , Cecil L. D . Association between atmospheric circulation patterns and firn-ice core records from the Inilchek glacierized area, central Tien Shan, Asia. J. Geophys. Res. 2004; 109(D8):
- Andreae M. O , Henderson-Sellers A . Climatic effects of changing atmospheric aerosol levels. Future Climates of the World: a Modeling Perspective World Survey of Climatology. 1995; Amsterdam: Elsevier. 347–398.
- Arao K , Itou K , Koja A . Secular variation of yellow sand dust events over Nagasaki in Japan: 1914–2001. J. Environ. Stud. Nagasaki Univ. 2003; 5: 1–10. (in Japanese).
- Buck C. F , Mayewski P. A , Spencer M. J , Whitlow S. L , Twickler M. S , co-authors . Determination of major ions in snow and ice cores by ion chromatography. J. Chromatogr. A. 1992; 594: 225–228.
- Chen J , Li G , Yang J , Rao W , Lu H , co-authors . Nd and Sr isotopic characteristics of Chinese deserts: implications for the provenances of Asian dust. Geochim. Cosmochim. Acta. 2007; 71: 3904–3914.
- Choël M , Deboudt K , Flament P , Aimoz L , Mériaux X . Single-particle analysis of atmospheric aerosols at Cape Gris-Nez, English channel: influence of steel works on iron apportionment. Atmos. Chem. 2007; 41: 2820–2830.
- Delmonte B , Basile-Doelsch I , Petit J. R , Maggi V , Revel-Rolland M , co-authors . Comparing the Epica and Vostok dust records during the last 220,000 years: stratigraphical correlation and provenance in glacial periods. Earth Sci. Rev. 2004; 66: 63–87.
- Dong Z , Li Z . Characteristics of atmospheric dust deposition in snow on Glacier No.72, Mt Tuomuer, China. Arct. Antarct. Alp. Res. 2011; 43(4): 517–526.
- Dong Z , Li Z , Edwards R , Wu L , Zhou P . Temporal characteristics of mineral dust particles in precipitation of Urumqi River Valley in Tian Shan, China: a comparison of alpine site and rural site. Atmos. Res. 2011; 101: 294–306.
- Dong Z , Li Z , Wang F , Zhang M . Characteristics of atmospheric dust deposition in snow on the glaciers of the eastern Tien Shan, China. J. Glaciol. 2009; 55(193): 797–804.
- Dong Z , Li Z , Xiao C , Zhang M , Wang F . Characteristics of aerosol dust in fresh snow in the Asian dust and non-dust periods at Urumqi glacier No.1 of eastern Tian Shan, China. Environ. Earth Sci. 2010; 60: 1361–1368.
- Dong Z , Li Z , Wang W , Li K , Zhou P . Characteristics of atmospheric dust deposition in snow on Glacier No.4, Mt Bogeda, China. Environ. Earth Sci. 2013; 70: 1423–1433.
- Du W , Qin X , Liu Y . Variation of the Laohugou Glacier No. 12 in the Qilian Mountains. J. Glaciol. Geocryol. 2008; 30(3): 373–379. (in Chinese).
- Falkovich A. H , Ganor E , Levin Z , Formenti P , Rudich Y . Chemical and mineralogical analysis of individual mineral dust particles. J. Geophys. Res. 2001; 106(D16): 18029–18036.
- Fisher D. A , Koerner R. M . Some apsects of climatic change in the High Arctic during the Halocene as deduced from ice cores. In Quaterman palaeoclimate (ed. W.C. Mahaney). University of East Anglia Press, Norwich . 1981; 249–271.
- Fujita K . Effect of dust event timing on glacier runoff: sensitivity analysis for a Tibetan glacier. Hydrol. Process. 2007; 21: 2892–2896.
- Gao Y , Arimoto R , Zhou M , Merrill J , Duce R . Relationships between the dust concentrations over Eastern Asia and the remote North Pacific. J. Geophys. Res. 1992; 97: 9867–9872.
- Goldstein S. L , Jacobsen S. B . Nd and Sr isotopic systematics of river suspended material: implications for crustal evolution. Earth Planet. Sci. Lett. 1988; 87: 249–265.
- Grousset F. E , Biscaye P. E . Tracing dust sources and transport patterns using Sr, Nd and Pb isotopes. Chem. Geol. 2005; 222: 149–167.
- Hinkley T. D . Composition and sources of atmospheric dust in snow at 3200 meters in the St. Elias Range, southeastern Alaska, USA. Geochim. Cosmochim. Acta. 1994; 58: 3245–3254.
- Honda M , Yabuki S , Shimizu H . Geochemical and isotopic studies of aeolian sediments in China. Sedimentology. 2004; 51: 211–230.
- Ichikuni M . Calcite as a source of excess calcium in rainwater. J. Geophys. Res. 1978; 83: 6249–6252.
- Junge C. E . Air Chemistry and Radioactivity. 1963; New York: Academic Publishers. pp. 382.
- Kahl J. D , Martinez D. A , Kuhns H , Davidson C. I , Jaffrezo J. L , co-authors . Air mass trajectories to Summit, Greenland: a 44-year climatology and some episodic events. J. Geophys. Res. 1997; 102(C12): 26861–26875.
- Koizumi K . Studies on Kosa, part 1. Kokumin Eisei (National Hygiene of Japan). 1932; 9: 983–1026. (in Japanese).
- Kreutz K. J , Aizen V. B , Cecil L. D , Wake C. P . Oxygen isotopic and soluble ionic composition of a shallow firn core, Inilchek glacier, central Tien Shan. J. Glaciol. 2001; 47(159): 548–554.
- Lee M. K , Lee Y , Yi H . Provenances of atmospheric dust over Korea from Sr-Nd isotopes and rare earth elements in early 2006. Atmos. Environ. 2010; 44: 2401–2414.
- Li Z , Li H , Dong Z , Zhang M . Chemical characteristics and environmental significance of fresh snow deposition on Urumqi Glacier No. 1 of Tianshan Mountains, China. Chin. Geogr. Sci. 2010; 20(5): 389–397.
- Li Z , Ross E , Thompson E. M . Seasonal variability of ionic concentrations in surface snow and elution processes in snow–firn packs at the PGPI site on Urumqi glacier No. 1, eastern Tien Shan, China. Ann. Glaciol. 2006a; 43: 250–256.
- Li Z , Wang F , Zhu G . Basic features of Miaoergou flat top glacier in east Tianshan and its thickness change over the past 24 years. J. Glaciol. Geocryol. 2006a; 29(1): 61–65. (in Chinese).
- Liu C , Yao T , Thompson L.G . Microparticle concentration within the Dunde ice core and its relationship with dust storm and climate. J. Glaciol. Geocryol. 1999a; 21(1): 9–14. (in Chinese).
- Liu W , Xiao Y , Peng Z . Preliminary study of hydrochemistry characteristics of boron and chlorine isotopes of salt lake brines in Qaidam Basin. J. Salt Lake Res. 1999b; 7(3): 8–14. (in Chinese).
- Marenco F . Characterization of atmospheric aerosols at Monte Cimone, Italy, during summer 2004: source apportionment and transport mechanisms. J. Geophys. Res. 2006; 111(D24): 24202.
- Maring H , Savoie D. L , Izaguirre M. A , Custals L , Reid J. S . Mineral dust aerosol size distribution change during atmospheric transport. J. Geophys. Res. 2003; 108(D19): 8592.
- Merrill J. T , Uematsu M , Bleck R . Meteorological analysis of long range transport of mineral aerosols over the north Pacific. J. Geophys. Res. 1989; 94: 8584–8598.
- Nakajima T , Tanaka M , Yamano M , Shiobara M , Arao K , co-authors . Aerosol optical characteristics in the yellow sand events observed in May, 1982 at Nagasaki – part II models. J. Meteorol. Soc. Jpn. 1989; 67: 279–291.
- Neinavaie H , Pirkl H , Trimbacher C . Herkunft und Charakteristik von Stäuben: Research Report. 2000; Wien: Umweltbundesamt. 1–61.
- Nihlén T , Mattsson J. O , Rapp A , Gagaoudaki C , Kornaros G . Monitoring of Saharan dust fallout on Crete and its contribution to soil formation. Tellus B. 1995; 47: 365–374.
- Osada K , Iida H , Kido M , Matsunaga K , Iwasaka Y , co-authors . Mineral dust layers in snow at Mount Tateyama, Central Japan: formation processes and characteristics. Tellus B. 2004; 56: 382–392.
- Painter H. T , Barrett P. A , Landry C. C , Neff C. J , Cassidy P. M , co-authors. . Impact of disturbed desert soils on duration of mountain snow cover. Geophys. Res. Lett. 2007; 34
- Prospero J. M , Uematsu M , Savoie D. L . Marine aerosol transport to the Pacific Ocean. Chem. Oceanogr. 1989; 10: 188–218.
- Raben P , Theakstone W. H , Tørseth K . Relations between winter climate and ionic variations in a seven-meter-deep snowpack at Okstindan, Norway. Arct. Antarct. Alp. Res. 2000; 32(2): 189–196.
- Ruth U , Wagenbach D , Steffensen J. P , Bigler M . Continuous record of microparticle concentration and size distribution in the central Greenland NGRIP ice core during the last glacial period. J. Geophys. Res. 2003; 108(D3): 4098.
- Sala J. Q , Cantos J. O , Chiva E. M . Red dust rain within the Spanish Mediterranean area. Clim. Chang. 1996; 32: 215–228.
- Steffensen J. P . The size distributions of microparticle from selected segments of the Greenland Ice Core Project ice core representing different climatic periods. J. Geophys. Res. 1997; 102: 26755–26763.
- Sun J , Zhang M , Liu T . Spatial and temporal characteristics of dust storms in China and its surrounding regions, 1960–1999: relations to source area and climate. J. Geophys. Res. 2001; 106: 10325–10333.
- Suzuki T , Tsunogai S . Origin of calcium in aerosols over the western north Pacific. J. Atmos. Chem. 1988; 6: 363–374.
- Tegen I , Lacis A . Modeling of particle size distribution and its influence on the radiative properties of mineral dust aerosol. J. Geophys. Res. 1996; 101: 19237–19244.
- Theakstone W. H . Dating stratigraphic variations of ions and oxygen isotopes in a high-altitude snowpack by comparison with daily variations of precipitation chemistry at a low-altitude site. Hydrol. Res. 2008; 39(2): 101–112.
- Thompson E. M , Thompson L. G . Glaciological interpretation of the microparticle concentration in the 905-meter Dome C core. Antarct. J. Unit. States. 1980; 11: 71–75.
- Thompson L. G , Davis M. E , Thompson E. M , Sowers T. A , Henderson K. A , co-authors . A 25,000-year tropical climate history from Bolivian ice cores. Science. 1998; 282: 1858–1864.
- Thompson L. G , Thompson E. M . Microparticle concentration variations linked with climatic change: evidence from polar ice cores. Science. 1981; 212: 812–816.
- Thompson L. G , Thompson E. M , Davis M. E , Bolzan J. F , Dai J , co-authors . Holocene-Late Pleistocene climatic ice core records from Qinghai-Tibetan Plateau. Science. 1989; 246: 474–477.
- Thompson L. G , Wayne L . Climatological implications of microparticle concentrations in the ice core from “Byrd” station. Western Antarctica. J. Glaciol. 1975; 14(72): 433–444.
- Tripathi J. K , Bock B , Rajamani V , Eisenhauer A . Is River Ghaggar, Saraswati? Geochemical constraints. Current Sci. 2004; 87(8): 1141–1144.
- Uno I , Amano H , Emori S , Kinoshita K , Matsui I . Trans-Pacific yellow sand transport observed in April 1998: a numerical simulation. J. Geophys. Res. 2001; 106: 18331–18344.
- Umbria A , Galán M , Muñoz M. J , Martin R . Characterization of atmospheric particles: analysis of particles in the Campo de Gibraltar. Atmósfera. 2004; 17: 191–206.
- Wagenbach D , Geis K , Leinen M , Sarnthein M . The mineral dust record in a high altitude alpine glacier (Colle Gnifetti, Swiss Alps). Paleoclimatology and Paleometeorology: Modern and Past Patterns of Global Atmospheric Transport. 1989; Dordrecht: Kluwer Academic. 543–564.
- Wake C. P , Mayewski P. A , Li Z . Modern eolian dust deposition in central Asia. Tellus B. 1994; 46: 220–223.
- Wang X , Dong Z , Zhang J , Liu L . Modern dust storms in China: an overview. J. Arid Environ. 2004; 58: 559–574.
- Warren S. G , Wiscombe W. J . A model for the spectral albedo of snow. II: Snow containing atmospheric aerosols. J. Atmos. Sci. 1980; 37: 2734–2745.
- Wu G , Zhang C , Zhang X , Tian L , Yao T . Sr and Nd isotopic composition of dust in Dunde ice core, Northern China: implications for source tracing and use as an analogue of long-range transported Asian dust. Earth Planet. Sci. Lett. 2010; 299: 409–416.
- Xu J , Yu G , Kang S , Hou S , Zhang Q , co-authors . Sr-Nd isotope evidence for modern aeolian dust sources in mountain glaciers of western China. J. Glaciol. 2012; 58(211): 859–865.
- Yang J. D , Li G. J , Rao W. B , Ji J. F . Isotopic evidences for provenance of East Asian Dust. Atmos. Environ. 2009; 43: 4481–4490.
- Yasunari T. J , Bonasoni P , Laj P , Fujita K , Vuillermoz E , co-authors . Estimated impact of black carbon deposition during pre-monsoon season from Nepal Climate Observatory – Pyramid data and snow albedo changes over Himalayan glaciers. Atmos. Chem. Phys. 2010; 10: 6603–6615.
- Zdanowicz C. M , Zielinski G. A , Wake C. P . Characteristics of modern atmospheric dust deposition in snow on the Penny Ice Cap, Baffin Island, Arctic Canada. Tellus B. 1998; 50: 506–520.
- Zhu Y , Li Z , You X . Application and technique in glacier by Accusizer 780A optical particle sizer. Mode. Sci. Appar. 2006; 81–84. (in Chinese).