
Abstract
To investigate the air quality during 2010 World Expo, continuous measurements of particle number size distributions and optical parameters were performed at urban Shanghai from April to June 2010. Total particle number and volume concentrations in the size range 16–600 nm were 12 700±6200 cm−3 and 16±8 µm3/cm3, respectively. Meanwhile, the optical parameters, particle light-scattering coefficient b sp,532nm and absorption coefficient b ap,532nm were 210±140 Mm−1 and 26±20 Mm−1, respectively. Strong correlation (R=0.69) was observed between b sp,532nm and the number concentration of accumulation mode particles, especially in the specific size range 300–500 nm (R=0.87). Cluster analysis on air mass history was performed to explore the relationship between air mass origins and the optical as well as microphysical parameters. Back trajectories were classified into four major clusters. Air masses came from the west direction, in which continental aerosols were predominant, associating with the polluted cases during the summertime in Shanghai. In addition, the northern air mass showed the lower values of aerosol single scattering albedo ω 0,532nm, indicating the presence of smaller light-absorbing particles originated from the North China Plain.
1. Introduction
The impacts of aerosol particles on the Earth–atmosphere system, including climate change, air quality and human health, determine its highlight in atmospheric environmental research. Aerosol particles influence the global energy budget by changing the microphysical structure, lifetime and coverage of clouds indirectly (Lohmann and Feichter, Citation2005), as well as by scattering and absorption of solar radiation directly (Stier et al., Citation2007). The total indirect (cloud albedo effect, also referred to as first indirect effect) and direct aerosol radiative forcings were estimated to be −0.7 [−1.1, +0.4] W/m2 and −0.5 [±0.4] W/m2, respectively (IPCC, Citation2007). To get a better understanding on the effect of aerosol particles to climate change, further knowledge of aerosol optical properties including particle light scattering and absorption as well as single scattering albedo are required.
In addition, the size of aerosol particles is believed to be a key to understand the atmospheric aerosol evolution process (Kleinman et al., Citation2009). Dusek et al. (Citation2006) pointed out that the aerosol size matters more than chemistry to influence the particles’ ability acting as cloud condensation nuclei (CCN). Therefore, the knowledge of particle size distributions, including their temporal and spatial variability, is crucial in exploring their direct and indirect forcing quantifications. Over the past decade, a large number of long-term or short-intensive measurements of particle number size distributions have been conducted in diverse atmospheric environments, including the remote atmosphere, above and inside the forest, coastal and mountain areas as well as rural and polluted urban regions (Kulmala et al., Citation2004; Putaud et al., Citation2010; Asmi et al., Citation2011; Wang et al., Citation2013c). However, most of these observations were performed in the developed countries in Europe and North America. In China, the first long-term continuous measurements of particle number size distributions have been conducted in urban Beijing since March 2004 (Wehner et al., Citation2004; Wu et al., 2008; Wang et al., Citation2013d). Meanwhile, more results have been reported in marine environment (Lin et al., Citation2007), regional background (Shen et al., Citation2011; Wang et al., Citation2013b), high-altitude mountain site (Kivekas et al., Citation2009; Li et al., Citation2011; Guo et al., Citation2012), rural areas (Liu et al., Citation2008; Yue et al., 2010a; Wang et al., Citation2013e; Herrmann et al., 2014) and suburban regions (Gao et al., Citation2009, Citation2011).
Shanghai, with approximately over 20 million inhabitants (http://www.stats-sh.gov.cn/), is the commercial centre of China, and one of the megacities in the world. With the rapid economic growth and urbanisation, the air quality has deteriorated in the past decades. The visibility showed a clear decreasing trend, especially since the middle of the 1990s (Chang et al., Citation2009). The hourly average PM10 concentration was higher than 150 µg/m3 with the atmospheric visibility within 10 km during the summertime haze pollution event (Du et al., Citation2011). The annual average PM2.5 concentration was 90 µg/m3 during 2005–2006 (Feng et al., Citation2009), which was 2.6 times higher than the new national ambient air quality standards for annual PM2.5, with a secondary level of annual average 35 µg/m3 in China. The concentrations of PM10 and PM2.5 exhibited the same seasonal variation, higher in winter and lower in summer. The carbonaceous species and secondary ions (sulphate, nitrate and ammonium) were the most abundant fine particles components, indicating the serious secondary particulate pollution in Shanghai (Ye et al., Citation2003; Wang et al., Citation2006). Most of these studies focus on the particle mass concentration and chemical composition; however, there is limited information on size distribution and optical property. Only one publication by Du et al. (Citation2012) reported the particle number size distribution and formation event in the urban environments of Shanghai. Therefore, the comprehensive insight into the ambient particle behaviours is necessary.
To improve the air quality during 2010 World Expo, the Shanghai government had conducted a series of emission control measures before the event, including reducing coal burning emissions from power plants, strict regulations on vehicle emission standards, closing highly emitting factories, etc. Meanwhile, the neighbouring Jiangsu and Zhejiang provinces also implemented several control measures to decrease potential regional transport of air pollutants to Shanghai. In this study, we displayed the aerosol number size distribution and optical properties measurements during the intensive campaign from April to June, 2010. The size distribution data were analysed in conjunction with the optical properties, focusing on the basic characteristics of fine particle pollution and their relationship with air mass origin.
2. Measurements
2.1. Location of sampling site
The intensive field campaign was performed between 15 April and 22 June, 2010. The sampling site was located in the eastern part of Shanghai, and approximately 8 km far to the northeast of World Expo Park. All the instruments were housed in the observatory, which was situated on the roof of a sixth floor building of Shanghai Pudong Environmental Monitoring Station (31.2267°N, 121.5382°E). The sampling inlets extended vertically from the laboratory window, which were ~25 m in height above the ground level. The surroundings of this site were mainly a residential and business area. Two major roads with heavy traffic at the west and south of the site were respectively 500 m away. There are no other significant local source emissions around. Hence, this site is assumed as representative for the Shanghai urban background aerosol.
2.2. Instrumentation
Number size distributions of atmospheric particles from 15 to 600 nm (mobility diameter) were measured by a SMPS (Scanning mobility particle sizer) system (TSI model 3936, TSI Inc., St. Paul, MN, USA). It consists of a long Differential Mobility Analyzer (DMA, TSI model 3081) transmitting only particles with a certain size, and a Condensational Particle Counter (CPC, TSI model 3022) for counting the particle number concentration. One inlet impactor with 0.071 cm diameter nozzle was installed ahead the whole system to remove big particles. The flow rate was 0.3 L/min for the sample air and 3.0 L/min for the sheath air. Particle number size distribution was taken every 5 minutes. The size-dependent diffusion losses in connecting tubes were corrected as compiled by Wiedensohler et al. (Citation2012).
A Multi-angle Absorption Photometer (MAAP, model Carusso 5012, Thermo, Inc., Waltham, MA USA) was used to obtain the aerosol light absorption coefficient at 670 nm (b ap,670nm). The b ap,670nm is determined from the simultaneous measurement of radiation passing through and scattered back from a particle-loaded filter. The measurement is operated at three detection angles to resolve the influence of light-scattering aerosol components on the angular distribution of the back scattered radiation (Petzold and Schönlinner, Citation2004). The flow rate of the MAAP was calibrated once per week. The uncertainty of MAAP at 99% confidence level has been estimated as 12% by Petzold and Schönlinner (Citation2004), and the minimum detection limit is lower than 100 ng/m3 at 2 minutes average.
Aerosol total light coefficient at a wavelength of 532 nm (b sp,532nm) was measured by a commercial integrating nephelometer (M9003, Ecotech Pty Ltd. Knoxfield, Australia) (Heintzenberg and Charlson, Citation1996; Müller et al., Citation2011). Before the field campaign, calibration was carried out with filtered particle-free air and CO2 as the low and high span gases, respectively. According to the manual, the lowest detectable limit is 0.4 Mm−1.
Measurement of the SO2 concentrations was carried out by using a commercial analyser (EC9850, Ecotech Pty Ltd. Knoxfield, Australia), and an automatic meteorology station was operated to measure meteorology parameters including temperature, relative humidity and pressure.
During the whole measurements, ambient aerosol particles were sample via a 3/4-inch stainless steel tubing with a PM10 sampling head, and then split to SMPS and MAAP. Total suspended particles were collected by the nephelometer via a 1/4-inch stainless steel tubing. The relative humidity for each device was kept within 40% by using the silica gel diffusion dryer. The frequency for changing the dryer was about 1 week.
2.3. Data analysis
2.3.1. Optical parameters normalised
The original data obtained from MAAP is the mass concentration of black carbon (M
BC), which is calculated based on the assumption that the proportional relationship between M
BC and b
ap (Gundel et al., Citation1984):1
where α ap is the mass absorption efficiency with a specific value (6.6 m2/g) recommended by the manufacturer. Hence, the output data M BC could be converted to b ap (670 nm) based on eq. (1).
Previous studies (Kirchstetter et al., Citation2004; Clarke et al., Citation2007) indicated that the wavelength dependence of b
ap is linked to particle size and composition. They reported that the absorption Ångström exponent varying from 0.7 to 1.1 for pollution aerosol, while increase to 2.1 for biomass burning plume. However, a basic hypothesis of the inverse wavelength ‘Power Law’ (Bergstrom et al., Citation2002; Collaud Coen et al., Citation2004) has been selected here. Accordingly, the absorption coefficient at 532 nm (b
ap,532nm) is retrieved from b
ap,670nm:2
Under the same wavelength, the aerosol single scattering albedo, ω
0,532nm, is defined as the ratio between the aerosol light scattering and the extinction coefficients (sum of the scattering and absorption):3
2.3.2. Mode fitting
The measured particle number size distributions were fitted and parameterised by a multiple log-normal distribution function (Seinfeld and Pandis, Citation2006):4
Here, N
i
and are the total number concentration and mean diameter of mode i, respectively. σ is the geometric mean standard deviation of the distribution. In this study, we applied an automatic algorithm for fitting every measured particle number size distribution (N: 19872) using MATLAB. The algorithm does not need a user decision for the initial input parameters, while it requires only the maximum number of possible modes. Detailed information could be found in Hussein et al. (Citation2005). displayed one example of fitting result for mean particle number size distribution during the entire measurement period.
Fig. 1 The fitting result of the mean atmospheric particle number size distribution for the whole campaign period. The modal concentrations (N), median diameters (MD) and geometric standard deviations (GSD) for the nucleation (red), Aitken (blue) and accumulation (green) modes are also shown.
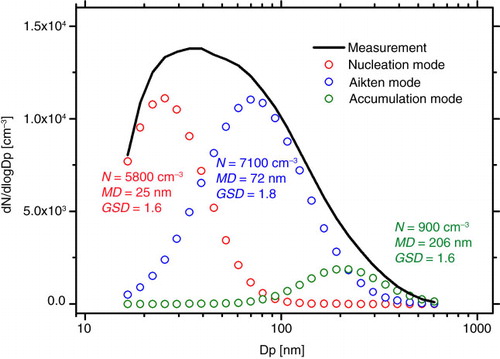
As a result, three modes were identified corresponding to the nucleation mode, Aitken mode and accumulation mode, respectively. The statistical analysis showed that the corresponding mean diameters were 21 nm, 56 nm and 186 nm, respectively, with the standard deviation of 6 nm, 21 nm and 69 nm. Hence, the diameter size ranges for the nucleation, Aitken and accumulation modes were chosen as 16 to 30 nm, 30 to 100 nm and 100 to 600 nm in this study.
2.3.3. Back trajectory analysis
To explore the influence of the air mass history and obtain a better understanding of regional atmospheric aerosol properties, the back trajectory analysis was performed using the HYbrid Single Particle Lagrangian Integrated Trajectory (HYSPLIT4) model developed by NOAA/ARL to trace the history of air masses arriving at measurement site (Draxler and Rolph, Citation2012; Rolph, Citation2012). The meteorological input data used in the model was obtained from the NOAA ARL archives (http://ready.arl.noaa.gov/archives.php). In this study, 48 hours back trajectories were chosen, and four trajectories per day (00, 06, 12 and 18 at local time) were calculated.
The trajectories terminated on a height of 500 m above ground level. In addition, a hierarchical clustering algorithm was applied to group a total of 284 backward trajectories according to their similarity in spatial distribution using the HYSPLIT4 software.
3. Results and discussion
3.1. Particle number concentrations and size distributions
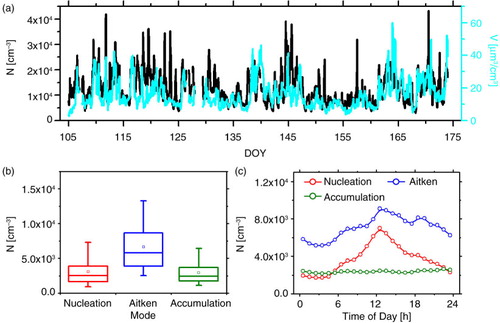
The temporal variability of hourly average number and volume concentrations of total particles (16–600 nm) during the entire measurement period are represented in a. The total aerosol number concentrations were observed from 3000 to 43 300 cm−3, with a mean value of 12 700±6200 cm−3. The particle volume concentrations were calculated from the observed number size distributions with an assumption of spherical particles. The values varied largely in the range of 3–60 µm3/cm3 during the campaign, with an average of 16±8 µm3/cm3. With the assumption of particle density as 1.7 g/cm3, this value was consistent with the PM1 (29.2 µg/m3), which was achieved both by High–Resolution Time-of-Flight Aerosol Mass Spectrometer (HR-ToF-AMS) and Single Particle Soot Photometer (SP2) during the same campaign (Huang et al., Citation2012). The average number concentrations were 3100 cm−3 for nucleation mode, 6700 cm−3 for Aitken mode and 2900 cm−3 for accumulation mode. The corresponding median values were 2600 cm−3, 5800 cm−3 and 2400 cm−3, respectively (b).
Fig. 2 (a) Temporal series of the total particle number (black line) and volume (Cyan line) concentrations; (b) box plot of number concentrations for nucleation, Aitken and accumulation modes particles; the upper and lower boundaries of boxes indicate the 75th and 25th percentiles; the line within the box marks the median; the whiskers above and below boxes indicate the 95th and 5th percentiles; and square symbols represent the means; (c) diurnal variation of three modes particles.
The total particle number concentration was lower than those measured in the other urban environments in North America and Europe, such as Pittsburgh (22 000 cm−3; Stanier et al., Citation2004), New York (22 100 cm−3; Bae et al., Citation2010),Leipzig (11 600–21 400 cm−3; Wehner and Wiedensohler, Citation2003), Atlanta (23 100 cm−3; Woo et al., Citation2001), New Delhi (20 000–250 000 cm−3; Mönkkönen et al., Citation2005). However, higher accumulation mode particles were observed in urban background sites of Shanghai compared with the other sites except for New Delhi, representing the more polluted situation. The summary of size-segregated particle number concentrations measured in various atmospheric environments of China is listed in . The mean total number concentration at Shanghai was close to the recent study conducted in the winter of 2008 (Du et al., Citation2012) and was much lower than the observations in the urban sites of Beijing (32 800 cm−3; Wu et al., Citation2008), Guangzhou (29 000 cm−3; Yue et al., Citation2010a) as well as the suburban of Shanghai (30 200 cm−3; Gao et al., Citation2009) and Nanjing (23 300 cm−3; Herrmann et al., Citation2014), even the rural sites like Yufa (17 000 cm−3; Yue et al., Citation2009) and Xinken (16 300 cm−3; Liu et al., Citation2008). However, the results were 3–7 times higher than the marine environment such as Yellow Sea (ship measurement, 4000 cm−3; Lin et al., Citation2007), as well as the regional background stations Waliguan (high–altitude mountain, 3816 m a.s.l., 2000 cm−3; Kivekas et al., Citation2009). Note that the differences may be due to the instrumentation techniques (the detections of lower and upper diameters), which may bring the diverse integrated size range. In addition, the different sampling locations and seasons would also cause the variability. In principle, the particle number concentrations in urban areas were twice than those in rural sites and approximately one order of magnitude higher than those in the marine/background environments. On average, the total particle count was dominated by ultrafine particles (Dp<100 nm, 77%), and in which Aitken mode particles account for 53%. This was comparable to the results found in Beijing regions (48–53%) (Wu et al., Citation2008; Yue et al., Citation2009).
Table 1. Comparisons of the size-resolved particle number concentrations over China
The diurnal variations of aerosol number concentrations in each mode are shown in c. The nucleation mode particles peaked around noon local time, which was similar to the gaseous sulphuric acid (Wang et al., Citation2013a). This is reasonable because it has been identified as a key precursor in the particle nucleation process (Yue et al., Citation2010b; Wang et al., Citation2011; Zhang et al., Citation2012). The Aitken mode particles showed a three-peak diurnal pattern, which was obvious in the midday (12:00) and vague both in the morning (7:00) and late afternoon time (18:00). The midday peak might be due to the growth of newly formed particles by condensation and coagulation processes (Wu et al., Citation2008), while the morning and late afternoon peaks are more related to the local traffic emissions. The accumulation mode particles did not show the significant change with time.
3.2. Optical properties
The time evolutions of particle light scattering and absorption coefficients during the campaign period are illustrated in a. The values (mean±standard deviation) were 210±140 Mm−1 and 26±20 Mm−1 at Shanghai, respectively. b sp,532nm values were approximately a factor of 2 higher than the other urban site, including Atlanta (summer, 121 Mm−1, 530 nm; Carrico et al., Citation2003), Mexico City (spring, 105 Mm−1, 550 nm; Marley et al., Citation2009) as well as New Delhi (summer, 110 Mm−1, 550 nm; Soni et al., Citation2010). b ap,532nm values, however, were typically much lower than Mexico City (37 Mm−1, 550 nm; Marley et al., Citation2009) and New Delhi (62 Mm−1, 550 nm; Soni et al., Citation2010), indicating less local emissions at Shanghai urban. Compared to the megacities in China, it is interesting to find that both higher b sp and b ap were shown in Beijing (summer, 300±270 Mm−1 and 55±32 Mm−1, 550 nm; Liu et al., Citation2009) and Guangzhou (autumn, 418±159 Mm−1 and 91±60 Mm−1, 540 nm; Andreae et al., Citation2008), even the surrounding regions, such as Wuqing (summer, 379±251 Mm−1 and 43±27 Mm−1, 550 nm; Ma et al., Citation2011) and Xinken (autumn, 333±138 Mm−1 and 70±42 Mm−1, 550 nm; Cheng et al., Citation2008). This phenomenon suggested that the pollutions in Beijing and Pearl River Delta (PRD) regions might be determined both by local and regional transport emissions.
Fig. 3 (a) Temporal series of the atmospheric aerosol light-scattering coefficients (b-sp), absorption coefficients (b-ap) and single scattering albedo (ω 0) at 532 nm; (b) correlations between scattering coefficients and number concentrations of particles in different size ranges; (c) relationship between absorption coefficient and single scattering albedo, the colour bar represents the scattering coefficients.
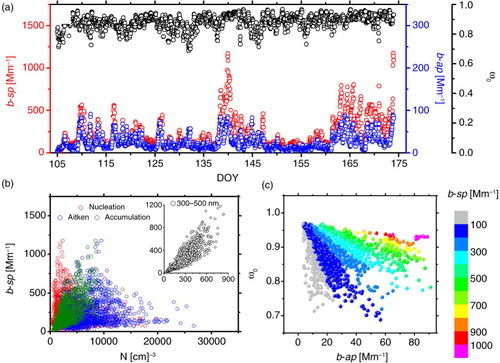
The aerosol single scattering albedo ω 0,532nm values at Shanghai ranged from 0.69 to 0.97, with a mean value of 0.88. Previous studies (Reid et al., Citation1998; Carrico et al., Citation2003; Cappa et al., Citation2009) demonstrated that ω 0 in mid-visible wavelength range varies from 0.79 (freshly biomass burning) to 0.99 (clean marine aerosol) depending on the air mass type, which could be generally characterised as the low value denotes the primary source, while the high value indicates the regional background aerosol. In this study, the values were higher than that at New Delhi (Soni et al., Citation2010) and Xinken (Cheng et al., Citation2008), which was significantly influenced by local sources, and comparable with Atlanta (Carrico et al., Citation2003) and Gosan (Kim et al., Citation2005).
b exhibited b sp,532nm as a function of particle number concentrations in different modes, including the particles in the size range of 300–500 nm (insert graph). In our results, the relations between b sp,532nm and the number concentration of nucleation and Aitken mode particles both displayed an envelope type pattern, with high values of b sp,532nm being always associated with low nucleation mode particle number concentration, and no clear correlation can be seen for the nucleation and Aitken modes. On the contrary, the high correlation (R=0.69) was observed between b sp,532nm and the number concentration of accumulation mode particles. This result was consistent with the Mie theory. However, if we look at specific size range (300–500 nm), the correlation (R=0.87) was found strongly, indicating that the aerosol particles in this certain diameter range had the highest scattering efficiency at 532 nm.
c presented the relationship between the ω 0 and the aerosol load (represented by b sp,532nm). It had been found that ω 0 generally decreased with increasing particle absorption coefficient, especially in the same lever of aerosol load. This indicated the variation of ω 0 was more sensitive to b sp than b ap at Shanghai. Meanwhile, the decreasing rate of ω 0 was smaller when the aerosol load was higher. One possible explanation was that the increasing aerosol pollution was always associated with more aged air mass and more internally mixed BC, thus the mass fraction of light-scattering materials (e.g., sulphate and most of the OC) will get higher. This conclusion had been confirmed by previous study (Cheng et al., Citation2008).
3.3. Back trajectory cluster analysis
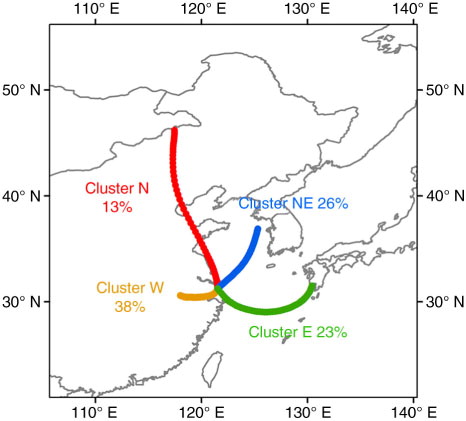
The air quality of the megacity, such as Beijing and Shanghai, is not only determined by the local source emission, but may also be influenced by the regional transport depending on the meteorological air mass history (Takegawa et al., Citation2009; Huang et al., Citation2012). Hence, to explore the impacts of the air mass history, the HYSPLIT4 model was used to follow the history of air masses arriving at Shanghai. As a result, four-cluster analysis was the optimum solution according to the change in total spatial variance, with the mean back trajectory of each cluster presented in . Each of the clusters represented between 37 (cluster N) and 108 (cluster W) back trajectories. The mean back trajectories showed significant differences in direction and length. Cluster N and W arrived from the northern and western sections of mainland China with different air mass speed, while cluster NE and E came from northeasterly and eastern marine areas, respectively. The air mass came from west was found to be the most frequent cluster, accounting for 38% on average of all back trajectories.
Fig. 4 Mean back trajectories for four trajectory clusters arriving at measurement site during the sampling period. The directions of four trajectory clusters are North (N, red), Northeast (NE, blue), East (E, green) and West (W, orange), respectively.
illustrated the mean number, surface and volume size distributions for each cluster. The number size distributions of different air mass types mostly peaked at around 25–60 nm, whereas the maximum of surface and volume size distributions were shown around 200–300 nm and 300–400 nm, respectively. The mean total particle number concentrations for the air masses came from northern and western directions through the continent and were 16 200 cm−3 and 14 300 cm−3, respectively, which were higher than when the air masses came from the East China Sea (). In addition, higher particle volume concentrations were observed associated with the higher number concentration, with mean values of 16 µm3/cm3 and 21 µm3/cm3, respectively, for cluster N and cluster W. On the contrary, the air masses coming from northeastern and eastern marine area contained less pollutant, with mean particle volume concentrations of 14 µm3/cm3 and 11 µm3/cm3, respectively. The highest particle volume concentration was observed in cluster W, which might be explained by the higher accumulation mode particles (3700 cm−3), accounting for 26% of the total number concentration compared with that (~20%) in other clusters. In summary, this particle volume concentration loading distribution pattern indicated that the westerly continental air mass represented the most severe pollutant regional transport condition in Shanghai. This finding was consistent with the previous study (Huang et al., Citation2012). However, it should also be pointed out that the structure of local emission might influence the results.
Fig. 5 Mean size distribution of aerosol (a) number, (b) surface and (c) volume concentrations for the four clusters, according to the classification in .
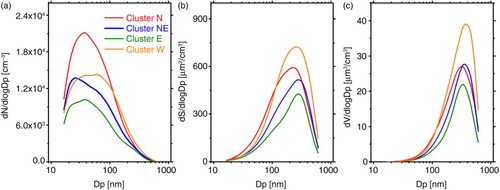
Table 2. Comparisons of the selected parameters for the four clusters: (mean±Standard deviation)
showed the mean diurnal evolutions of particle number size distributions, averaged for each of the trajectory clusters mentioned above. Significant differences were recognisable: the cluster N with fast moving air mass transport from north showed a clear pattern that the ultrafine mode particles formed in the morning (10:00) and growth into Aitken mode, indicating the new particle formation event. In contrast, the particle number size distribution of other three clusters showed different patterns, which was only observed the appearance of burst at noon. The condensation sink (CS) describes how rapidly vapour molecules could condense onto the pre-existing particles, which could be used representing the pre-existing particles concentration (Kulmala et al., Citation2001; Dal Maso et al., 2005). Its value could be calculated using eq. (5):5
Fig. 6 Diurnal evolutions of particle number size distributions and the mean diameters of the dominating mode (black square) for the four clusters.
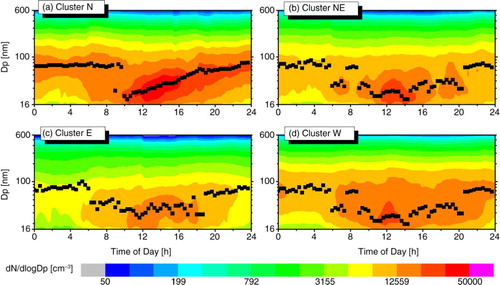
where D is the diffusion coefficient of the condensing vapour, β is the transitional regime correction factor, Dp is the aerosol particle diameter and N is their number concentration. However, it should be noticed that in this study the CS values were calculated based on the dry particle number size distributions. The CS values did not show the significant differences between cluster N (0.022 s−1) and cluster W (0.024 s−1), which were much higher than the cases where air masses came from marine areas, 0.017 s−1 and 0.012 s−1 for cluster NE and E (), respectively. However, the mean SO2 concentration was 11.4 ppb for cluster N, which was higher than the observations in cluster NE (6.2 ppb), cluster E (4.7 ppb) and cluster W (7.7 ppb). The higher SO2 concentration for cluster N might cause the different evolution of particle number size distribution. As a result, the mean particle number concentration in nucleation mode was 4700 cm−3 in cluster N, which was 1.2, 1.7 and 1.3 times higher than those in cluster NE, E and W, respectively. In addition, the lower temperature and relative humidity were observed in cluster N, with the mean values of 19% and 46%, respectively. Such meteorological conditions caused by the fast moving air mass from northerly direction favours the occurrence of nucleation. All of the above showed that air mass had an important effect on NPF events with significant subsequent growth. This result was consistent with the observations in previous studies (Wehner et al., Citation2008; Shen et al., Citation2011).
In terms of optical parameters, the variations of particle light absorption and scattering coefficients for four clusters were associated with the number concentration of accumulation mode particles (), as analysed in Section 3.2. The polluted west back trajectory had the highest b ap,532nm and b sp,532nm among four clusters, with the mean and standard deviation values of b ap,532nm and b sp,532nm of 35±19 and 328±197 Mm−1, respectively, indicating the slow air mass came from the continent area had a stronger extinction effect. However, the aerosol single scattering albedo ω 0 did not show the same variation trend as b ap,532nm and b sp,532nm. The North China Plain, which is the main route of cluster N, is a major black carbon emission area (Wang et al., Citation2012). Hence, the lowest values (ω 0=0.84) were observed when the fast air mass was moving from northern China (cluster N), compared with the other three clusters (ω 0 ~ 0.88–0.89).
4. Conclusions
Aerosol microphysical and optical properties were explored during the 2010 Shanghai World Expo at an urban site of Shanghai from April to June in 2010. Basic values of particle number concentrations as well as aerosol absorption and scattering coefficients were presented and their relations to air mass origin were investigated.
The mean values of total particle number and volume concentrations were 12 700 cm−3 and 16 µm3/cm3, respectively. Aitken mode particles were the most abundant in ultrafine particles, accounting for 53%. In addition, the particle light-scattering coefficient b sp,532nm and absorption coefficient b ap,532nm were 210±140 Mm−1 and 26±20 Mm−1, respectively. b sp,532nm correlated strongly (R=0.69) with the number concentration of accumulation mode particles (100–600 nm), especially in the specific size range 300–500 nm (R=0.87) according to Mie theory. The aerosol single scattering albedo ω 0 values varied from 0.69 to 0.97 with a mean value of 0.88 at 532 nm. ω 0 was found decreased when the particle absorption coefficient increased, and the decreasing rate of ω 0 was smaller when the aerosol load was higher.
Back trajectory cluster analysis was performed to investigate the impacts of the air mass history on the particle concentrations and optical properties. A total of four trajectory clusters were defined. The highest total particle number concentration (16 200 cm−3) was observed when the fast air mass came from northern China, leading to a clear new particle formation pattern. In contrast, the highest particle volume concentration (21 µm3/cm3) was shown when the air mass slowly came from the west, which was the major trajectory in Shanghai. The same variations were also achieved on the optical parameters b ap,532nm and b sp,532nm. The west back trajectory with the mean values of b ap and b sp were 35 Mm−1 and 328 Mm−1, respectively, which were the highest among the four clusters. In addition, the northern air mass showed the lower ω 0, indicating the presence of smaller absorbent particles originated from North China Plain. Overall, the continental back trajectories contained more pollutants which lead to a stronger light extinction effect compared with the air masses from the marine areas arriving at Shanghai.
5. Acknowledgements
This work was supported by the project of Air Quality Monitoring Campaign for 2010 Shanghai World Expo, the National Natural Science Foundation of China (21025728, 21190052) and the China Ministry of Environmental Protection's Special Funds for Scientific Research on Public Welfare (201009002).
References
- Andreae M. O. , Schmid O. , Yang H. , Chand D. , Yu J. Z. , co-authors . Optical properties and chemical composition of the atmospheric aerosol in urban Guangzhou, China. Atmos. Environ. 2008; 42: 6335–6350. 10.1016/j.atmosenv.2008.01.030.
- Asmi A. , Wiedensohler A. , Laj P. , Fjaeraa A. M. , Sellegri K. , co-authors . Number size distributions and seasonality of submicron particles in Europe 2008–2009. Atmos. Chem. Phys. 2011; 11: 5505–5538. 10.5194/acp-11-5505-2011.
- Bae M. S. , Schwab J. J. , Hogrefe O. , Frank B. P. , Lala G. G. , co-authors . Characteristics of size distributions at urban and rural locations in New York. Atmos. Chem. Phys. 2010; 10: 4521–4535. 10.5194/acp-10-4521-2010.
- Bergstrom R. W. , Russell P. B. , Hignett P . Wavelength dependence of the absorption of black carbon particles: predictions and results from the TARFOX experiment and implications for the aerosol single scattering Albedo. J. Atmos. Sci. 2002; 59: 567–577. 10.1175/1520-0469(2002)059<0567:WDOTAO>2.0.CO;2.
- Cappa C. D. , Bates T. S. , Quinn P. K. , Lack D. A . Source characterization from ambient measurements of aerosol optical properties. Geophys. Res. Lett. 2009; 36: L14813. 10.1029/2009gl038979.
- Carrico C. M. , Bergin M. H. , Xu J. , Baumann K. , Maring H . Urban aerosol radiative properties: measurements during the 1999 Atlanta Supersite Experiment. J. Geophys. Res-Atmos. 2003; 108: 8422. 10.1029/2001JD001222.
- Chang D. , Song Y. , Liu B . Visibility trends in six megacities in China 1973–2007. Atmos. Res. 2009; 94: 161–167. 10.1016/j.atmosres.2009.05.006.
- Cheng Y. F. , Wiedensohler A. , Eichler H. , Su H. , Gnauk T. , co-authors . Aerosol optical properties and related chemical apportionment at Xinken in Pearl River Delta of China. Atmos. Environ. 2008; 42: 6351–6372. 10.1016/j.atmosenv.2008.02.034.
- Clarke A. , McNaughton C. , Kapustin V. , Shinozuka Y. , Howell S. , co-authors . Biomass burning and pollution aerosol over North America: organic components and their influence on spectral optical properties and humidification response. J. Geophys. Res-Atmos. 2007; 112: 12S18. 10.1029/2006JD007777.
- Collaud Coen M. , Weingartner E. , Schaub D. , Hueglin C. , Corrigan C. , co-authors . Saharan dust events at the Jungfraujoch: detection by wavelength dependence of the single scattering albedo and first climatology analysis. Atmos. Chem. Phys. 2004; 4: 2465–2480. 10.5194/acp-4-2465-2004.
- Dal Maso M. , Kulmala M. , Riipinen I. , Wagner R. , Hussein T. , co-authors . Formation and growth of fresh atmospheric aerosols: eight years of aerosol size distribution data from SMEAR II, Hyytiälä, Finland. Boreal Environ. Res. 10: 323–336.
- Draxler R. R., Rolph G. D. 2012; Silver Spring, MD: NOAA Air Resources Laboratory. HYSPLIT (HYbrid Single-Particle Lagrangian Integrated Trajectory) Model Access Via NOAA ARL READY Website (http://ready.arl.noaa.gov/HYSPLIT.php).
- Du H. , Kong L. , Cheng T. , Chen J. , Du J. , co-authors . Insights into summertime haze pollution events over Shanghai based on online water-soluble ionic composition of aerosols. Atmos. Environ. 2011; 45: 5131–5137. 10.1016/j.atmosenv.2011.06.027.
- Du J. , Cheng T. , Zhang M. , Chen J. , He Q. , co-authors . Aerosol size spectra and particle formation events at urban Shanghai in Eastern China. Aerosol Air Qual. Res. 2012; 12: 1362–1372. 10.4209/aaqr.2011.12.0230.
- Dusek U. , Frank G. P. , Hildebrandt L. , Curtius J. , Schneider J. , co-authors . Size matters more than chemistry for cloud-nucleating ability of aerosol particles. Science. 2006; 312: 1375–1378. 10.1126/science.1125261.
- Feng Y. , Chen Y. , Guo H. , Zhi G. , Xiong S. , co-authors . Characteristics of organic and elemental carbon in PM2.5 samples in Shanghai, China. Atmos. Res. 2009; 92: 434–442. 10.1016/j.atmosres.2009.01.003.
- Gao J. , Chai F. , Wang T. , Wang W . Particle number size distribution and new particle formation (NPF) in Lanzhou, Western China. Particuology. 2011; 9: 611–618. 10.1016/j.partic.2011.06.008.
- Gao J. , Wang T. , Zhou X. , Wu W. , Wang W . Measurement of aerosol number size distributions in the Yangtze River delta in China: formation and growth of particles under polluted conditions. Atmos. Environ. 2009; 43: 829–836. 10.1016/j.atmosenv.2008.10.046.
- Gundel L. A. , Dod R. L. , Rosen H. , Novakov T . The relationship between optical attenuation and black carbon concentration for ambient and source particles. Sci. Total Environ. 1984; 36: 197–202. 10.1016/0048-9697(84)90266-3.
- Guo H. , Wang D. W. , Cheung K. , Ling Z. H. , Chan C. K. , co-authors . Observation of aerosol size distribution and new particle formation at a mountain site in subtropical Hong Kong. Atmos. Chem. Phys. 2012; 12: 9923–9939. 10.5194/acp-12-9923-2012.
- Heintzenberg J. , Charlson R. J . Design and applications of the integrating nephelometer: a review. J. Atmos. Ocean. Technol. 1996; 13: 987–1000. 10.1175/1520-0426(1996)013<0987:DAAOTI>2.0.CO;2.
- Herrmann E. , Ding A. J. , Kerminen V. M. , Petäjä T. , Yang X. Q. , co-authors . Aerosols and nucleation in eastern China: first insights from the new SORPES-NJU station. Atmos. Chem. Phys. 2014; 14: 2169–2183. 10.5194/acp-14-2169-2014.
- Huang X. F. , He L. Y. , Xue L. , Sun T. L. , Zeng L. W. , co-authors . Highly time-resolved chemical characterization of atmospheric fine particles during 2010 Shanghai World Expo. Atmos. Chem. Phys. 2012; 12: 4897–4907. 10.5194/acp-12-4897-2012.
- Hussein T. , Dal Maso M. , Petaja T. , Koponen I. K. , Paatero P. , co-authors . Evaluation of an automatic algorithm for fitting the particle number size distributions. Boreal Environ. Res. 2005; 10: 337–355.
- IPCC. Intergovernmental Panel on Climate Change. Report. 2007; Cambridge, UK: Cambridge University Press.
- Kim S.-W. , Yoon S.-C. , Jefferson A. , Ogren J. A. , Dutton E. G. , co-authors . Aerosol optical, chemical and physical properties at Gosan, Korea during Asian dust and pollution episodes in 2001. Atmos. Environ. 2005; 39: 39–50. 10.1016/j.atmosenv.2004.09.056.
- Kirchstetter T. W. , Novakov T. , Hobbs P. V . Evidence that the spectral dependence of light absorption by aerosols is affected by organic carbon. J. Geophys. Res-Atmos. 2004; 109 D21208 10.1029/2004JD004999.
- Kivekas N. , Sun J. , Zhan M. , Kerminen V. M. , Hyvarinen A. , co-authors . Long term particle size distribution measurements at Mount Waliguan, a high-altitude site in inland China. Atmos. Chem. Phys. 2009; 9: 5461–5474.
- Kleinman L. I. , Springston S. R. , Wang J. , Daum P. H. , Lee Y. N. , co-authors . The time evolution of aerosol size distribution over the Mexico City plateau. Atmos. Chem. Phys. 2009; 9: 4261–4278.
- Kulmala M. , Dal Maso M. , Mäkelä J. M. , Pirjola L. , Väkevä M. , co-authors . On the formation, growth and composition of nucleation mode particles. Tellus B. 2001; 53: 479–490.
- Kulmala M. , Vehkamäki H. , Petäjä T. , Dal Maso M. , Lauri A. , co-authors . Formation and growth rates of ultrafine atmospheric particles: a review of observations. J. Aerosol Sci. 2004; 35: 143–176. 10.1016/j.jaerosci.2003.10.003.
- Li W. J. , Zhang D. Z. , Shao L. Y. , Zhou S. Z. , Wang W. X . Individual particle analysis of aerosols collected under haze and non-haze conditions at a high-elevation mountain site in the North China plain. Atmos. Chem. Phys. 2011; 11: 11733–11744. 10.5194/acp-11-11733-2011.
- Lin P. , Hu M. , Wu Z. , Niu Y. , Zhu T . Marine aerosol size distributions in the springtime over China adjacent seas. Atmos. Environ. 2007; 41: 6784–6796. 10.1016/j.atmosenv.2007.04.045.
- Liu S. , Hu M. , Wu Z. J. , Wehner B. , Wiedensohler A. , co-authors . Aerosol number size distribution and new particle formation at a rural/coastal site in Pearl River Delta (PRD) of China. Atmos. Environ. 2008; 42: 6275–6283. 10.1016/j.atmosenv.2008.01.063.
- Liu X. G. , Zhang Y. H. , Jung J. S. , Gu J. W. , Li Y. P. , co-authors . Research on the hygroscopic properties of aerosols by measurement and modeling during CAREBeijing-2006. J. Geophys. Res-Atmos. 2009; 114 D00G16 10.1029/2008jd010805.
- Lohmann U. , Feichter J . Global indirect aerosol effects: a review. Atmos. Chem. Phys. 2005; 5: 715–737. 10.5194/acp-5-715-2005.
- Ma N. , Zhao C. S. , Nowak A. , Müller T. , Pfeifer S. , co-authors . Aerosol optical properties in the North China Plain during HaChi campaign: an in-situ optical closure study. Atmos. Chem. Phys. 2011; 11: 5959–5973. 10.5194/acp-11-5959-2011.
- Marley N. A. , Gaffney J. S. , Castro T. , Salcido A. , Frederick J . Measurements of aerosol absorption and scattering in the Mexico City Metropolitan Area during the MILAGRO field campaign: a comparison of results from the T0 and T1 sites. Atmos. Chem. Phys. 2009; 9: 189–206. 10.5194/acp-9-189-2009.
- Mönkkönen P. , Koponen I. K. , Lehtinen K. E. J. , Hämeri K. , Uma R. , co-authors . Measurements in a highly polluted Asian mega city: observations of aerosol number size distribution, modal parameters and nucleation events. Atmos. Chem. Phys. 2005; 5: 57–66. 10.5194/acp-5-57-2005.
- Müller T. , Laborde M. , Kassell G. , Wiedensohler A . Design and performance of a three-wavelength LED-based total scatter and backscatter integrating nephelometer. Atmos. Meas. Tech. 2011; 4: 1291–1303. 10.5194/amt-4-1291-2011.
- Petzold A. , Schönlinner M . Multi-angle absorption photometry – a new method for the measurement of aerosol light absorption and atmospheric black carbon. J. Aerosol Sci. 2004; 35: 421–441. 10.1016/j.jaerosci.2003.09.005.
- Putaud J. P. , Van Dingenen R. , Alastuey A. , Bauer H. , Birmili W. , co-authors . A European aerosol phenomenology - 3: physical and chemical characteristics of particulate matter from 60 rural, urban, and kerbside sites across Europe. Atmos. Environ. 2010; 44: 1308–1320.
- Reid J. S. , Hobbs P. V. , Ferek R. J. , Blake D. R. , Martins J. V. , co-authors . Physical, chemical, and optical properties of regional hazes dominated by smoke in Brazil. J. Geophys. Res-Atmos. 1998; 103: 32059–32080. 10.1029/98JD00458.
- Rolph G. D. 2012. Real-Time Environmental Applications and Display sYstem (READY) Website (http://ready.arl.noaa.gov). NOAA Air Resources Laboratory, Silver Spring, MD..
- Seinfeld J. H. , Pandis S. N . Atmospheric Chemistry and Physics. From Air Pollution to Climate Change. 2006; Wiley, New York.
- Shen X. J. , Sun J. Y. , Zhang Y. M. , Wehner B. , Nowak A. , co-authors . First long-term study of particle number size distributions and new particle formation events of regional aerosol in the North China Plain. Atmos. Chem. Phys. 2011; 11: 1565–1580. 10.5194/acp-11-1565-2011.
- Soni K. , Singh S. , Bano T. , Tanwar R. S. , Nath S. , co-authors . Variations in single scattering albedo and Angstrom absorption exponent during different seasons at Delhi, India. Atmos. Environ. 2010; 44: 4355–4363. 10.1016/j.atmosenv.2010.07.058.
- Stanier C. O. , Khlystov A. Y. , Pandis S. N . Ambient aerosol size distributions and number concentrations measured during the Pittsburgh Air Quality Study (PAQS). Atmos. Environ. 2004; 38: 3275–3284.
- Stier P. , Seinfeld J. H. , Kinne S. , Boucher O . Aerosol absorption and radiative forcing. Atmos Chem Phys. 2007; 7: 5237–5261. 10.5194/acp-7-5237-2007.
- Takegawa N. , Miyakawa T. , Kuwata M. , Kondo Y. , Zhao Y. , co-authors . Variability of submicron aerosol observed at a rural site in Beijing in the summer of 2006. J. Geophys. Res-Atmos. 2009; 114 D00G05 10.1029/2008jd010857.
- Wang R. , Tao S. , Wang W. , Liu J. , Shen H. , co-authors . Black Carbon Emissions in China from 1949 to 2050. Environ. Sci. Technol. 2012; 46: 7595–7603. 10.1021/es3003684.
- Wang Y. , Zhuang G. , Zhang X. , Huang K. , Xu C. , co-authors . The ion chemistry, seasonal cycle, and sources of PM2.5 and TSP aerosol in Shanghai. Atmos. Environ. 2006; 40: 2935–2952. 10.1016/j.atmosenv.2005.12.051.
- Wang Z. B. , Hu M. , Mogensen D. , Yue D. L. , Zheng J. , co-authors . The simulations of sulfuric acid concentration and new particle formation in an urban atmosphere in China. Atmos. Chem. Phys. 2013a; 13: 11157–11167. 10.5194/acp-13-11157-2013.
- Wang Z. B. , Hu M. , Sun J. Y. , Wu Z. J. , Yue D. L. , co-authors . Characteristics of regional new particle formation in urban and regional background environments in the North China Plain. Atmos. Chem. Phys. 2013b; 13: 12495–12506. 10.5194/acp-13-12495-2013.
- Wang Z. B. , Hu M. , Wu Z. J. , Yue D. L . Research on the formation mechanisms of new particles in the atmosphere. Acta Chimi. Sin. 2013c; 71: 519–527. 10.6023/a12121062.
- Wang Z. B. , Hu M. , Wu Z. J. , Yue D. L. , He L. Y. , co-authors . Long-term measurements of particle number size distributions and the relationships with air mass history and source apportionment in the summer of Beijing. Atmos. Chem. Phys. 2013d; 13: 10159–10170. 10.5194/acp-13-10159-2013.
- Wang Z. B., Hu M., Yue D. L., He L. Y., Huang X. F., co-authors. New particle formation in the presence of a strong biomass burning episode at a downwind rural site in PRD. China. Tellus B. 2013e; 65: 19965. http://dx.doi.org/10.3402/tellusb.v65i0.19965.
- Wang Z. B. , Hu M. , Yue D. L. , Zheng J. , Zhang R. Y. , co-authors . Evaluation on the role of sulfuric acid in the mechanisms of new particle formation for Beijing case. Atmos. Chem. Phys. 2011; 11: 12663–12671. 10.5194/acp-11-12663-2011.
- Wehner B. , Birmili W. , Ditas F. , Wu Z. , Hu M. , co-authors . Relationships between submicrometer particulate air pollution and air mass history in Beijing, China, 2004–2006. Atmos. Chem. Phys. 2008; 8: 6155–6168.
- Wehner B. , Wiedensohler A . Long term measurements of submicrometer urban aerosols: statistical analysis for correlations with meteorological conditions and trace gases. Atmos. Chem. Phys. 2003; 3: 867–879.
- Wehner B. , Wiedensohler A. , Tuch T. M. , Wu Z. J. , Hu M. , co-authors . Variability of the aerosol number size distribution in Beijing, China: new particle formation, dust storms, and high continental background. Geophys. Res. Lett. 2004; 31 L22108 10.1029/2004gl021596.
- Wiedensohler A. , Birmili W. , Nowak A. , Sonntag A. , Weinhold K. , co-authors . Mobility particle size spectrometers: harmonization of technical standards and data structure to facilitate high quality long-term observations of atmospheric particle number size distributions. Atmos. Meas. Tech. 2012; 5: 657–685. 10.5194/amt-5-657-2012.
- Woo K. S. , Chen D. R. , Pui D. Y. H. , McMurry P. H . Measurement of Atlanta aerosol size distributions: observations of ultrafine particle events. Aerosol Sci. Technol. 2001; 34: 75–87. 10.1080/02786820120056.
- Wu Z. J. , Hu M. , Lin P. , Liu S. , Wehner B. , co-authors . Particle number size distribution in the urban atmosphere of Beijing, China. Atmos. Environ. 2008; 42: 7967–7980. 10.1016/j.atmosenv.2008.06.022.
- Ye B. , Ji X. , Yang H. , Yao X. , Chan C. K. , co-authors . Concentration and chemical composition of PM2.5 in Shanghai for a 1-year period. Atmos. Environ. 2003; 37: 499–510. 10.1016/s1352-2310(02)00918-4.
- Yue D. L. , Hu M. , Wu Z. J. , Guo S. , Wen M. T. , co-authors . Variation of particle number size distributions and chemical compositions at the urban and downwind regional sites in the Pearl River Delta during summertime pollution episodes. Atmos. Chem. Phys. 2010a; 10: 9431–9439. 10.5194/acp-10-9431-2010.
- Yue D. L. , Hu M. , Wu Z. J. , Wang Z. B. , Guo S. , co-authors . Characteristics of aerosol size distributions and new particle formation in the summer in Beijing. J. Geophys. Res-Atmos. 2009; 114 D00G12 10.1029/2008jd010894.
- Yue D. L. , Hu M. , Zhang R. Y. , Wang Z. B. , Zheng J. , co-authors . The roles of sulfuric acid in new particle formation and growth in the mega-city of Beijing. Atmos. Chem. Phys. 2010b; 10: 4953–4960. 10.5194/acp-10-4953-2010.
- Zhang R. , Khalizov A. , Wang L. , Hu M. , Xu W . Nucleation and growth of nanoparticles in the atmosphere. Chem. Rev. 2012; 112: 1957–2011. 10.1021/cr2001756.