
Abstract
Here we present the first multi-year record of nitrate in the atmospheric aerosol (2005–2008) and surface snow (2006–08) from central Antarctica. PM10 and size-segregated aerosol, together with superficial snow, have been collected all year-round at high resolution (daily for all the snow samples and for most of aerosol samples) at Dome C since the 2004/05 field season and analysed for main and trace ionic markers. The suitability of the sampling location in terms of possible contamination from the base is shown in detail. In spite of the relevance of nitrate in Antarctic atmosphere, both for better understanding the chemistry of N cycle in the plateau boundary layer and for improving the interpretation of long-term nitrate records from deep ice core records, nitrate sources in Antarctica are not well constrained yet, neither in extent nor in timing. A recurring seasonal pattern was pointed out in both aerosol and snow records, showing summer maxima and winter minima, although aerosol maxima lead the snow ones of 1–2 months, possibly due to a higher acidity in the atmosphere in mid-summer, favouring the repartition of nitrate as nitric acid and thus its uptake by the surface snow layers. On the basis of a meteorological analysis of one major nitrate event, of data related to PSC I extent and of irradiance values, we propose that the high nitrate summer levels in aerosol and snow are likely due to a synergy of enhanced source of nitrate and/or its precursors (such as the stratospheric inputs), higher solar irradiance and higher oxidation rates in this season. Moreover, we show here a further evidence of the substantial contribution of HNO3/NOx re-emission from the snowpack, already shown in previous works, and which can explain a significant fraction of atmospheric nitrate, maintaining the same seasonal pattern in the snow. As concerning snow specifically, the presented data suggest that nitrate is likely to be controlled mainly by atmospheric processes, not on the daily timescale but rather on the seasonal one.
1. Introduction
Nitrate is the chemical species at the end of the oxidation chain of atmospheric reactive nitrogen and is one of the anions dominating the chemical composition of the polar snowpack (Legrand et al., Citation1999). Therefore, measurements of trace gas chemistry in polar areas aim to reach two different goals. One is filling the gap of knowledge on the current boundary layer chemistry of nitrogen cycle above snow surfaces in a clean atmosphere. Tropospheric concentrations of reactive trace gases such as NOx (NO and NO2) were revealed to be very low (at pptv level), as in the remote marine boundary layer (Logan, Citation1983), but the factors controlling their concentration in central polar areas have not been completely understood. In fact, nitrate may arise from many different sources, including: lightning (Wolff, Citation1995), downwelling of NOx (NO and NO2) from the lower stratosphere (Legrand and Kirchner, Citation1990) and long-range transport of N-species such as peroxyacetyl nitrate (PAN) generated at lower latitudes from surface sources (e.g. tropical lightning, anthropogenic emissions or biomass burning) in the southern hemisphere (Grannas et al., Citation2007 and references therein).
Secondly, once the current chemistry of nitrogen compounds in the boundary layer has been better understood, polar ice core record of concentrations could be used to reconstruct past levels of atmospheric nitrogen oxides (NOx=NO+NO2) and rates of stratospheric denitrification (Mulvaney and Wolff, Citation1993; Wolff, Citation1995).
Unfortunately, this task is particularly complicated due to nitrate multiple sources as well as to a non-conservative character of this species in the snow layers. Indeed, concentration in snow is affected by post-depositional processes, especially active at sites with low annual accumulation rates (e.g. Mulvaney et al., Citation1998; Wagnon et al., Citation1999; Röthlisberger et al., Citation2002; Blunier et al., Citation2005; Grannas et al., Citation2007; Wolff et al., Citation2008; Traversi et al., Citation2009) and to the complex chemical cycling of reactive nitrogen on the Antarctic plateau (Davis et al., Citation2001, Citation2004; Jones et al., Citation1999).
Post-depositional effects acting on nitrate lead to a net loss as function of depth of the snow layers (Wagnon et al., Citation1999; Traversi et al., Citation2009). Both photochemical and physical processes in the upper snowpack drive the observed net loss of nitrate but relative contributions from nitrate UV-photolysis and evaporation of nitric acid (HNO3) are still under debate (Grannas et al., Citation2007 and references therein). Recent studies in the Arctic and Antarctic suggested that the stable isotopic composition of in snow has great potential in providing constraints on
sources and NOx oxidation pathways and hence on its fate after deposition onto the snow layers (Frey et al. Citation2009 and references therein). In this framework, a recent isotopic study on Antarctic snow compared field and lab determined fractionation constants of the stable nitrogen isotope in
and concluded that photolysis is not the main process responsible for
loss at the snow surface (Blunier et al., Citation2005).
A better knowledge of the nature and extent of these processes would allow attempting a reliable interpretation of nitrate stratigraphies from deep ice cores, retrieved just in sites with a low accumulation rate and thus possibly suffering of such a complication. In fact, CitationTraversi et al. (2012) showed evidences of the potentiality of nitrate as a proxy of long-term solar activity, in a site where this species is preserved in the snow layers during the Holocene (Talos Dome – TALDICE project, East Antarctica).
At this purpose, it is particularly relevant that Dome C, where this study has been carried out, is the drilling site of a deep ice core drilling, performed in the framework of EPICA project and yielding palaeoclimatic records spanning the last 850 000 yr (Wolff et al., Citation2010).
In order to face these issues, here we present a multi-year data set of nitrate concentration in size-segregated aerosol and in surface snow collected at Dome C all year-round. These records represent the longest and the most resolved ever achieved from continental Antarctica. In fact, to our knowledge, the only comparable record from central Antarctica is the one discussed by Weller and Wagenbach (Citation2007) reporting nitrate (and other chemical species as well) record in the February 2003–December 2005 period, obtained at 7- and 15-d temporal resolution, at Kohnen Station (Dronning Maud Land). All the other available aerosol chemical measurements for plateau areas were performed only during austral summer (Arimoto et al., Citation2004, Citation2008; Huey et al., Citation2004).
2. Sampling and analysis
Year-round aerosol samplings have been carried out beginning in December of 2004 at the Concordia Station (Dome C, central Antarctica, 75° 06’ S, 123° 20’ E, 3220 m above sea level), which is located 1100 km away from the nearest coast in the inner Antarctic Plateau.
Sampling was carried out using PM10 cut-off head, Dekati 4-stage and Andersen 8-stage impactors with a daily (PM10) to 7-d (for 8-stage impactor) resolution, covering the 2005–2008 time period (PM10) and shorter time periods for the multi-stage impactors.
The sampling site was located at the edge of the ‘clean area’, approximately 700 m away from the Concordia Italian–French base and was upwind with respect to the dominant wind direction (south–west). In fact, the risks of a possible contamination from the base had been carefully evaluated before starting any sampling activity at Dome C and the location of the sampling site was chosen in the best possible position taking into account the minimum potential contamination and the optimal logistic feasibility altogether.
In particular, regarding nitrate collected on filters, it has to be noted that such a potential contamination is even of lower importance since nitrate is a secondary aerosol component. The emissions from the base, mainly related to combustion processes (heating, exhausts from vehicles used outside the clean area), are able to affect nitrate budget in the aerosol only indirectly. Gas-phase nitrogen oxides are the ones emitted directly and it is highly unlikely that, at the low temperatures characterising Dome C, the oxidation of NOx and the further gas-to-particle conversion (both needed to collect and detect particulate nitrate on filters) occur within a day and is able to enhance nitrate concentrations measured in that sampling daily.
However, in order to demonstrate the lack of relevance of the ‘pollution’ source for nitrate in the collected aerosol, we analysed the wind direction both for annual and seasonal variability and daily variability during each of the 33 cases presented in the paper. The analysis is based on data measured by the Italian Automatic Weather Station (AWSita, data obtained from www.climantartide.it) and French–US Automatic weather station (AWSus, data obtained from http://uwamrc.ssec.wisc.edu/aws/). The AWSita and AWSus measure the incoming wind speed (WS) and direction with an hourly and 10 minutes sampling rate, respectively. As a general observation, despite the different sampling rate, the comparison between meteorological data from different AWS (not shown), when both available, highlights a good agreement both for WS and direction.
The map of the Concordia station area shown in a reports: the filter sampling station, the AWSita and the AWSus position, along the South–West (sampling station and AWSita weather station) and South East (AWSus station) direction with respect to the Concordia base, at a distance of ~0.7, ~1 and ~2 km, respectively.
Fig. 1 (a) Map of Dome Concordia area. Large red filled squares represent: Italian Automatic Weather Station (AWSita), US–French Automatic Weather Station (AWSus), Concordia base, the Summer Camp, the EPICA drilling site and the site where the filter sampling station is placed. Small grey filled circles represent sampling sites for other disciplines near the base. (b) and (c) Wind direction rose histogram divided for 1–5, 5–7, 7–9, 9–11, 11–18 and >18 m s−1 wind speed classes, based on Italian Automatic Weather Station (AWSita) hourly data sampled for (b) all 1/1/2005–1/1/2009 time periods, (c) only during November–December months.
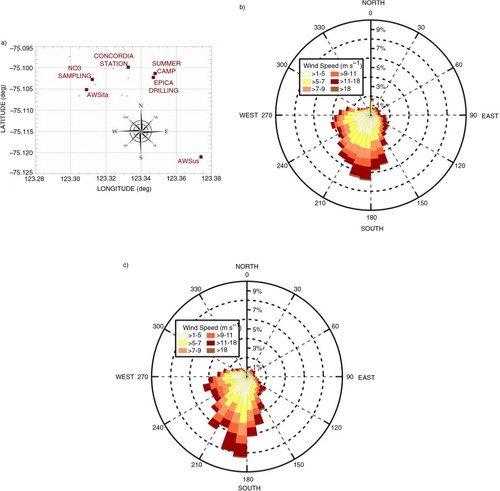
b shows the wind rose direction measured by AWSita during the period 1/1/2005–1/1/2009. It is evident that, on an annual basis, the main incoming wind direction is from South–West to North–East (180°–270° range is related to the 45% of the recorded meteorological samples) indicating that the wind blows from the filter sampling station towards the Concordia station. On the other hand, it is very infrequent that wind comes from North–East to South–West (the 0°–90° angle is associated with <10% of the collected meteorological samples).
During November and December months (c), when most of the presented cases occur, the gap between the South–West and North–East incoming wind is enhanced with an increase (55%) in the former and a decrease (7%) in the latter direction angle. The same result was obtained using data from AWSus. Consequently, according with the main dominant wind direction in the DC area, the sampling station is proven to be properly placed up wind with respect to the Concordia base and the occurrence of wind blowing from the opposite side is one order of magnitude lower and then negligible.
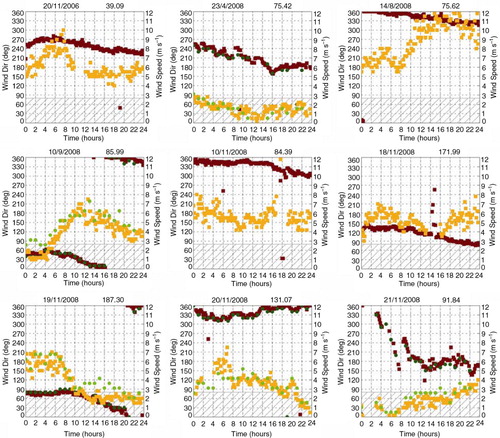
On a daily basis, we analysed WS and direction during the 33 presented cases, in order to discuss possible direction variation from annual and seasonal average. In particular, long lasting events of wind blowing from the base towards the filter during the daily acquisition were searched. Using a conservative approach, we chose an incoming wind in the angle between 0° and 80° as a marker of suspect events. Wind calm measurements were pre-emptively disregarded since, in case of null wind intensity, the direction of the wind is automatically set on ‘0°’ but there is actually no direction of the wind in such cases. The analysis is based on data measured by the AWSus because during the 33 cases the AWSus acquired more data with an enhanced sampling time period with respect to AWSita. shows the result of the queries. In nine cases AWSus measures direction from the suspect angle. However, five cases (20/11/2006, 23/4/2006, 10/11/2008, 20/11/2008 and 21/11/2008) should be excluded because the occurrences are related to artificial spikes in wind direction measurements, not infrequent in these raw data, or to very low WS (<1 m s−1) which does not allow reliable wind direction measurements. Only four cases out of 33 show wind with a direction from the base towards the filters. Among them, such a direction was maintained all through the day in two cases (on 23/04/2008 and 21/11/2008) while about half of the day (14 hours) on 19/11/2008 and only 4 hours on 10/09/2008. Moreover, as observed from , on those 2 d when the wind blew constantly from the ‘forbidden’ direction, its intensity was around 6 m/s or higher, making the oxidation and the gas-to-particle conversion of the N oxides along the base-sampling station route extremely unlikely.
Fig. 2 Wind speed (dark red and dark green) and direction (orange and green) for AWSus (filled squares) and AWSita (filled circle) during daily time window when filter sampling is active. Each plot shows one of the eight events (the title of each plot reports time data and concentration values as ng m−3) for the 33 cases reported in the paper when AWSus measures a wind direction in the 0°–80° angle at least once (grey dashed area).
In conclusion, as previously shown on a seasonal and annual timescale, and also on a daily basis, a significant impact of a potential pollution from the base's activities can be excluded.
The sampling parameters are reported in and other details concerning the sampling can be found in CitationBecagli et al. (2012).
Table 1. Information on devices, sampling period, time resolution, aerosol size classes and kind of membranes used for the performed samplings
The used Pall Teflo membrane (PTFE filters with polymethylpentene support ring) were chosen on the basis of the lowest blanks of the main and trace ionic components determined along with nitrate by Ion Chromatography (see Udisti et al., 2012; Becagli et al., Citation2012) and are certified to assure a sampling efficiency higher than 99.5% for particles of 0.3 µm a.e.d. (aerodynamic equivalent diameter).
Filter holders were prepared before sampling under a laminar flow hood and brought to the sampling site in polyethylene bags. After sampling, filters were stored in pre-cleaned Petri dishes and frozen until analysis. Field filter blanks were regularly obtained during the sampling period revealing an average nitrate content of about 0.1 mg per filter, representing <2% of the median nitrate content on PM10 samples; nevertheless, such a value was used to correct the whole nitrate data set used in this paper.
For analytical determination, the sample filter was cut into halves using pre-cleaned stainless steel scissors in a chemical clean bench. Half of each filter was extracted with 18 MΩ ultrapure MilliQ water (about 10 mL) in ultrasonic bath for 20 minutes.
A system consisting of three Dionex Ion Chromatographs (DX100, DX100, DX600) was used for all aerosol and snow ion analyses. Nitrate was determined together with chloride, nitrite, sulphate and oxalate using an IonPac AG4A (4×50 mm) guard column and an Ion Pac AS12A (4×250 mm) separation column. The sample was concentrated before injection through a TAC-2 (3×35 mm) pre-concentrator column loaded with a peristaltic pump. An ASRS-300 4 mm self-regenerating suppressor was used for background conductivity suppression before the detection system. 2.5 mM/
2.5 mM aqueous solution was used as eluent, with 2.0 ml/min flow in column. For nitrate, the uncertainty is mainly determined by the ion chromatography accuracy, which is typically 5%.
3. Results and discussion
3.1. Aerosol chemistry and potential sources
The whole data set of nitrate concentration measured in PM10 aerosol at Dome C and available to date is shown in a, where blue bars represent the sampled PM10 and black and red diamonds represent the nitrate concentration in PM10 as reconstructed by the 8-stage (2005–06) and 4-stage (2006–08) impactor, respectively.
Fig. 3 Nitrate concentration in actual and reconstructed PM10 in the 2005–2008 period. Temporal profile of nitrate concentration in PM10 aerosol at Dome C in the 2005–2008 time period. (a) Original concentration values of actual PM10 (blue bars) and PM10 reconstructed by summing concentrations from 8-stage (black diamonds) and 4-stage (red diamonds) impactors, used for sampling in 2005–06 and 2007–08, respectively. (b) Monthly averages and related standard deviations of PM10 nitrate with the indication of sampling representativeness in each month (red squares).
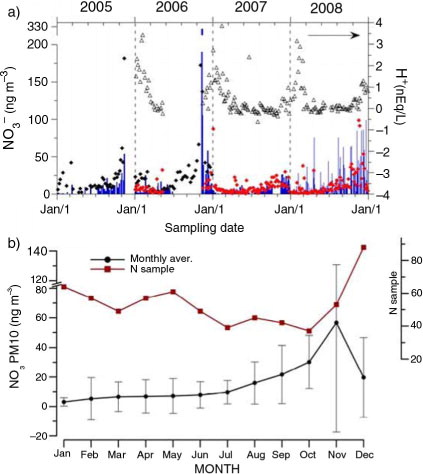
The annual trend of nitrate concentration can be observed in b, reporting the monthly averages, calculated over the whole sampling period, together with the number of samples available for each month.
Nitrate records in PM10 exhibit relatively low levels (mostly below 20 ng m−3 with median values settling on 2.8, 17.7 and 7.5 ng m−3 for actual, 8-stage and 4-stage PM10, respectively) for at least half of the year. From August on, mean values undergo a steep increase, reaching the highest values in the early austral summer, especially in November (showing a mean as almost twice as October), to settle back to the most recurring values in January–February. The availability of different kinds of samplings overlapping with the PM10 sampling allows evaluating the sampling efficiency of PM10 and its ability to catch the topical features of atmospheric nitrate temporal evolution along different years. In fact, the PM10 sampling on PTFE filters, as carried out here, undergoes possible artefacts such as: (1) evaporation of volatile nitric acid from the filter (after an exchange reaction with acidic compounds); and (2) passive absorption of gas-phase nitric acid so that gas-phase nitrate can be erroneously ascribed to the particulate phase.
As shown by Schaap et al. (Citation2002, Citation2004) on the basis of studies performed in different European sites, Teflon filters appear to be the most vulnerable concerning the possible nitrate post-collection loss due to heterogeneous-phase reactions on the filter and this is crucial at an Antarctic plateau site as Dome C, where acidic atmosphere usually dominates (this work and Udisti et al., 2004). On the contrary, the used multi-stage impactors are not supposed to suffer from this possible disadvantage since they keep separated four or eight different size classes, preventing the mixing and possible exchange reactions between components mainly belonging to particles of different size. Such exchange reactions can happen with a higher probability when ultra-fine, fine and coarse particles are collected together on the same substrate, as in the case of the PM10 sampler, and can lead to the formation of volatile species (HNO3 and, with much lesser extent in his environment, NH4NO3) which can be re-emitted to the atmosphere during the sampling time. In fact, acidic species (mainly sulphuric and nitric acid) often show a mode in the sub-micrometric class whereas sea salt and mineral dust particles are mainly associated with the 1–2.5 µm size class (Becagli et al., Citation2012; Udisti et al., 2012). The multi-stage impactors collect these size classes separately and the post-depositional exchange reactions are thus less likely to occur.
The extent of these potential artefacts is very hard to ascertain; nevertheless, the data from the multi-stage impactors shown in a can help in evaluating the sampling efficiency of the PM10 device.
By taking the size-segregated samplings as the most reliable for nitrate preservation, one has to select the exactly contemporaneous sampling days. In fact, the sampling resolution is usually 7 d for 8-stage impactor and 4 d for 4-stage impactor whereas PM10 samplings were performed with a resolution ranging from 1 to 3 d. Hence, when comparing absolute concentrations, we have selected those days covered completely by both kinds of the compared samplings.
Nitrate concentrations reconstructed by the 8-stage impactor usually show higher values with respect to the actual sampled PM10, as expected from the above-mentioned issues. In particular, average differences of 87.5% with respect to the 8-stage values are found for the January–February period, whereas smaller gaps are observed for full winter months, with percentage differences of 54.4% from June to August. As concerning the period characterised by the highest nitrate peaks, November–December, it shows an average percentage difference of 72.8%.
Nitrate concentrations in PM10 reconstructed from the 4-stage impactor show positive discrepancies with respect to the measurements performed on the PM10 filter in the months of January and February and negative (with values higher of 65.4%) and negative gaps in the winter months (June–July–August), with average percentages of −34.1%. We have to stress that the winter months belong completely to the year 2008, where particularly high concentrations of PM10 are observed. It has to be noticed that during the November–December period, only a percentage difference of −1.6% is observed as an average. In both cases, the percentage difference increases as a function of the free acidity content (shown as an empty triangle in the a), reaching its maximum in January and February. This is consistent with the assumed artefacts occurring on the filter collecting PM10 aerosol and indicates that during late summer, only the 12.5% of total nitrate is collected on PM10 PTFE filters, according to the 8-stage impactor reconstruction, taken as a more conservative estimation. During winter, when the acidity reaches its minimum, it appears that about half of the total nitrate is collected on PM10. During the most interesting months of November and December, where nitrate shows the highest values, we observe that about 30% is preserved on PM10. In these months, acidity shows intermediate values but the absolute concentrations are generally higher so that relative differences are smaller.
In conditions of higher atmospheric acidity, typical of summer season, it is more likely that the nitrate already collected on the filter can be converted into nitric acid and lost from the filter. Thus, an increased acidity enhances the negative sampling artefact.
Although these estimated percentage differences are substantial and vary along the year as a function of acidity content, we have to take into account the uncertainties affecting such comparisons. For instance, as reported by Arimoto et al. (Citation2001), Ion Chromatographic measurements on collected aerosol samples are associated to different kinds of uncertainties related to flow volumes, possible contamination (during sample preparation, collection and storage), analytical determinations and blank corrections. According with the estimations by Arimoto et al. (Citation2001), the resulting unavoidable uncertainties range between 15 and 20%. Moreover, accuracy checks performed by the use of denuders were affected by uncertainties of ±25% (Piel et al., Citation2006).
However, within all these uncertainties, it can be observed that all three seasonal patterns look very similar, with the lowest values during winter and values progressively increasing with the end of winter and reaching the top levels in early summer.
Hence, the most important information yielded by such a long series of PM10 samplings and measurements is its ability to catch the seasonal pattern of nitrate and the main events along different years. This has to be taken into account when long-term monitoring of the chemistry of the atmosphere has been accomplished and is planned to be carried out in the future in the Antarctic Plateau, such as in Dome C. For this reason, one needs a relatively simple, friendly-use device, allowing high resolution samplings, all through the year for different years, in order to study the climatic processes occurring on a seasonal as well as on a multi-year time scale. PM10 sampling meets these requirements although contemporaneous measurements with devices specifically designed for sampling gas-phase compounds (denuders) should be carried out within spot campaigns during different times of the year, in order to constrain better the PM10 sampling efficiency in each studied time period.
The repeatability of seasonal patterns of nitrate along the sampling years can be better appreciated in a and 4b, where samples belonging to different years are reported with different symbols. The seasonal trend is similar for all the sampled years but, if absolute concentration values are also very similar for 2005, 2006 and 2007, the whole of 2008 exhibits higher values all through the year, possibly due to the daily resolution against the 3-d resolution of all the other years, allowing a better preservation of nitrate on the filter (less time for post-collection re-emission). For the 2005–2007 period, it can be observed how the background nitrate concentration stays around 2.1 ng m−3 (mean value of 3.3 ng m−3) from January to August and starts to increase in September (with similar mean and median values of 7.5 and 7.8 ng m−3, respectively) steeply rising in October (mean and median values of 12.3 and 12.0 ng m−3, respectively), to reach the highest values in November, with peaks up to 320 ng m−3 (76.3 and 18.4 ng m−3, respectively, as average and median values of the 3 yr). Despite each month not evenly represented in all the 3 yr, such a pattern is clearly visible also from b, where the monthly averages are reported.
Fig. 4 Nitrate annual trend. Annual trend of PM10 nitrate superimposing all the different sampled years, with different symbols. In order to better appreciate the dynamic range of the concentration as well as the annual pattern, both a linear (a) and a logarithmic (b) scale were used.
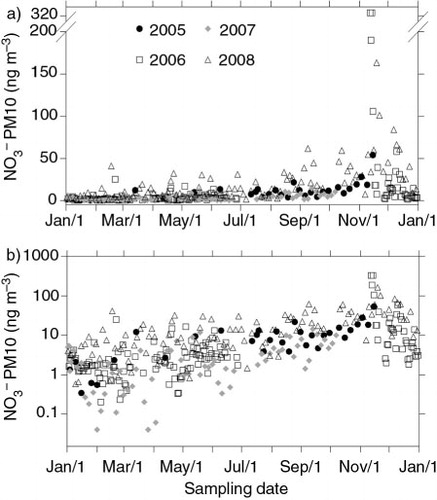
Such a trend is visible also for 2008 but the background and mean values are higher in the January–August period (6.3 and 10.4 ng m−3, respectively). The increase towards the highest early summer values is more gradual, reaching the top peaks again in November, although the maximum concentration value is around 187 ng m−3, markedly lower than the ones reached in November 2006.
Such a temporal pattern for atmospheric nitrate was also found by CitationErbland et al. (2013) at Dome C, in 2007–08 and 2009–10 annual campaigns, both showing the highest values in December and November–December, respectively. It is worth noticing that the absolute nitrate concentrations measured by the authors are perfectly comparable to the ones reported in this paper (background values within 20 ng m−3 and peaks around 150 ng m−3) despite the sampling methods are different: high-volume sampling with quartz fibre filters for CitationErbland et al. (2013), reported to collect efficiently the total nitrate (particulate and gas-phase) and low volume sampling with Teflon filters in our case. This result suggests the PM10 sampling here reported is able to provide quite a satisfactory estimation of the total nitrate present in Dome C atmosphere.
Considering the only other record available so far from an inner Antarctic station (Kohnen Station, Dronning Maud Land – Weller and Wagenbach, Citation2007), one can observe that the two patterns are similar. The record of total (particulate and gas-phase) nitrate from Kohnen also shows a broad November maximum (with concentrations around 52 ng m−3), followed in this case by a lower maximum in January. Such a pattern is also in agreement with long-term observations from the coastal Neumayer Station (Wagenbach et al., Citation1998). Also Mulvaney and Wolff (Citation1993) found nitrate peaks in Antarctic firn cores in the Weddell Sea sector corresponding to spring and early summer.
In order to understand the dominant nitrate sources at Dome C, all through the year, the chemical composition of each sample was studied in terms of ion balances. At this purpose, the events characterised by the highest concentrations, using the 95th percentile as a threshold, were selected for each sampled year. The number of selected events is different for every year due to a different value distribution and different width of yearly data set; in particular, only two events came out of the selection for 2005, eight events for 2006, six for 2007 and 17 for 2008.
Of all the 32 selected events, 27 belong to the month of November and December (16 and 11, respectively), two to the month of September and, within the remaining ones, one was sampled in August, one in April and one in February.
It is interesting to note that the sum of these single events above the 95th percentile of concentration represent, by themselves, between one quarter and one third (24±29%) of the total nitrate budget.
The chemical composition of these samples, especially at the acidic or alkaline character, can provide some information on the chemical species of nitrate present in Dome C aerosol at the time of collection. As usually accomplished with Antarctic samples (Legrand and Delmas, Citation1984), H+ and /
were not determined (the chromatographic method using
/
as eluent prevents the reliable determination of these compounds and H+ concentration is too low to be accurately determined without the interference of atmospheric CO2) and are calculated from the discrepancy between anion and cation budget.
a shows the temporal pattern of the residual free acidity for the selected events as well as for the remaining samples, while b and 5c show respectively the ion balances for all the selected events in November (b) and in December (c), as the months mostly interested by the occurrence of high nitrate concentrations. The two largest events in absolute (12 and 14 November 2006, reaching values of 325 ng m−3), as well as 11 of the selected events, are characterised by a significant free acidity and nitrate concentrations (in nEq/L) higher than the sum of Na+ and Ca2 + (see a and 5b). Besides, plotting nitrate concentration against the sum of Na+ and Ca2 + in each stage of the 8-stage impactor, no evidence of linear correlation can be observed. Such a feature indicates that during these events, even assuming that Na+ and Ca2 + are completely associated with nitrate due to adsorption of gas-phase nitric acid and particle growing processes on sea salt (Na+) and neutralisation with alkaline particulate (Ca2 + ) during transport (very conservative assumption), the dominant nitrate species in the atmosphere is gas-phase HNO3, which is collected on the filter after a gas-to-particle conversion processes and subsequent dry deposition. Thus, the above-mentioned events cannot be related to common advection processes of primary marine and crustal aerosol (as expected, /Na+ and
/SO4
2 − ratios are markedly higher than the typical sea salt and crustal ratios). Concerning the remaining 20 events, almost all of them (18) present a significant free acidity but a comparable or higher sea salt content with respect to nitrate content, suggesting the possible presence of nitrate as both sodium salt and nitric acid but not allowing to infer which is the dominant one. The remaining events (15 and 20 November 2006) show no significant free acidity, a relatively low nitrate content with respect to Na+ and Ca2 + , pointing towards the presence of nitrate mainly as sodium (and calcium) salt.
Fig. 5 Free acidity and ion balances of the selected nitrate events. (a) Temporal profile of the free acidity, expressed as nEq/L in the whole sampling period. Black filled diamonds refer to the events showing a concentration of nitrate higher than the 95th percentile while the grey filled diamonds indicate all the remaining samples. (b) Ion balances of the selected nitrate events occurring during the month of November (16 events). (c) Ion balances of the selected nitrate events occurring during the month of December (11 events).
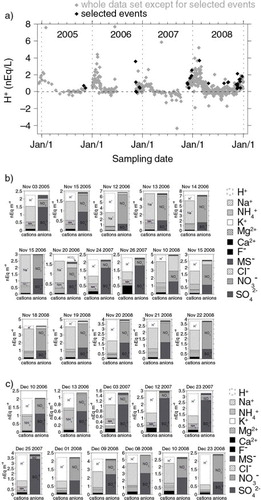
From the ionic compositions shown, it appears that nitrate is likely to be often present as acidic species when the concentration levels are particularly high. Such a consideration appears to be consistent also with the pronounced chloride depletion (with respect to the sea water composition) observed by the ion balances in a and 3b and likely caused by an exchange reaction of sulphuric and nitric acids with sea salt both in the air and/or on the filters (upon the adsorption of gas-phase H2SO4 and HNO3).
The significant impact as well as the large variability of gas-phase nitric acid is confirmed also by denuder measurements performed during summer at Kohnen station (DML) by Piel et al. (Citation2006), showing that a percentage of total nitrate between 33 and 76% was present as free acid.
As observed from b and 3c, ammonia plays a relevant role as a neutralising agent for the sulphuric and nitric acidity only in a couple of cases in December, namely 10 and 13 December 2006, where the NH4 + alone covers the 42 and 48% of the total cationic budget. In the remaining nitrate events, NH4 + accounts for only a minor percentage of the cationic amount, that is, within the 2.5–12.0% range for December, in the 1.0–16.0% range for November and reaching a maximum of 17.8% in the other events (18 February 2008).
Comparing nitrate concentrations measured at Dome C with the ones reported from other sites in central Antarctica such as the South Pole (Davis et al., Citation2008, ANTCI campaign) and Kohnen (Piel et al., Citation2006), we can observe a difference in absolute values with a concentration of the so-called filterable-nitrate (f-NO3-) determined at the South Pole much higher (up to two orders of magnitude) than nitrate collected on filters at Dome C (this paper and Udisti et al., 2004) and than total nitrate determined at Kohnen. Despite the difference in absolute concentration values, some common features can be highlighted. In particular, some peaks in f-NO3- from the South Pole were found to be synchronous with sulphate and MSA (as well as with Na+ for data here presented) but peaks in late December 2003 were not common to MSA and sulphate. Similarly, from our data, the contemporaneous occurrence of nitrate and MSA peaks is more likely during November than December. In fact, taking into account the data set of the largest nitrate events (as detailed previously), about half of the nitrate events (namely 54.5%) are associated with high MSA values (i.e. exceeding the 75th percentile of each annual distribution) in December whereas in November most of nitrate events correspond to high MSA values (75%). As shown by CitationBecagli et al. (2012), MSA in atmospheric aerosol at Dome C reaches its highest values just during the month of November.
Since in the same period, high concentration of gas-phase N species (such as NOy) were found by Davis et al. (Citation2008) at the South Pole, the authors support the hypothesis of a local source of NOy re-emitted from the snow during that period, as also shown by other recent works (e.g. Savarino et al., Citation2007; Frey et al., Citation2009; Legrand et al., Citation2009; Zatko et al., Citation2013). The data so far presented may confirm such a local source of ‘nitrate recycling’ but also a nitrate source related to purely atmospheric processes, such as stratospheric intrusions cannot be ruled out.
Indeed, the influence of the stratospheric source on nitrate and N-species atmospheric concentration in coastal and inland Antarctic sites is currently a highly debated issue (e.g. Frey et al., Citation2009).
The significance of the stratospheric source on a yearly-basis is supported by year-round measurements of total nitrate (Wagenbach et al., Citation1998) and of reactive N species (NOy) in gas-phase (Weller et al., Citation2002) at a coastal station (Neumayer), indicating that the input of stratospheric nitrate, including stratospheric NOy and sedimentation of Polar Stratospheric Clouds (PSC), may represent a major source at coastal Antarctic sites.
With regard to the Dome C site, a significant stratospheric contribution via PSC sedimentation was proposed by several authors, on the basis of isotopic signatures, to explain the winter (August) peak they found in nitrate and NOx in Dome C (Savarino et al., Citation2007; Frey et al., Citation2009) and this perfectly matches the timing of PSC settling process, reaching its maximum during the winter season but usually covering also the springtime. Moreover, the Δ17O isotopic signature at Dome C confirms previous coastal measurements that the peak of atmospheric in spring is of stratospheric origin (Frey et al., Citation2009), despite another source is strongly supported by the authors for this period (see later). Other authors found also early summer nitrate peaks, even higher than the secondary winter peak (Wagenbach et al., Citation1998) and regularly occurring through the years, similarly to what reported here, and ascribed them to stratospheric intrusions.
Moreover, measurements of cosmogenic 35S activity in Dome C aerosol (Priyadarshi et al., Citation2011) show spring–summer maxima of 35SO4 2 − , likely due, according to the authors, to a combined action of a higher oxidising capacity of the boundary layer and a double contribution of transport from the mid-latitudes and to stratosphere–troposphere exchanges (STE). In particular, the largest stratospheric 35SO4 2 − contributions (4–10%) were found for the November–December period.
Considering the measurements performed on different Antarctic snow pits, Mulvaney and Wolff (Citation1994) reported that the spring–early summer peaks found in nitrate record provided a circumstantial support to a stratospheric source of nitrate.
In fact, the strong seasonality of the stratosphere–troposphere coupling and the lower-stratospheric circulation, occurring most likely in late spring/early summer (October–January), has been widely acknowledged (Yang et al., Citation2007). The stratosphere–troposphere coupling is favoured by the vertical wave propagation, taking place when the background zonal flow is westerly and below a threshold value (Charney and Drazin, Citation1961); in the Southern Hemisphere, this occurs preferentially in late spring/early summer, when the polar vortex breaks up and in the autumn, when it is building up (Thompson and Solomon, Citation2002).
3.2. Meteorological analysis of selected nitrate events
Air mass back-trajectories (TJ) analysis is a powerful tool for tracking back in time and analysing modelled thermo dynamics and physical characteristics of the atmospheric flow path.
An ensemble of 10 d back in time TJ was created in order to take into account the atmospheric flow over the DC site spanning a time window from 2006 to 2010. TJ are calculated with the HYSPLIT Lagrangian model (Draxler and Rolph, Citation2012) initialised with the European Centre Medium Range Weather Forecast (ECMWF) ERA INTERIM atmospheric model data Re-analysis with a 1°×1° regular grid (Dee et al., Citation2011). TJ are starting at the synoptical hours (00/06/12/18) and from different heights above the selected site. The error in TJ calculation after 5 d is estimated in the 10–30% range of the travel distance (Schlosser et al., Citation2008; Scarchilli et al., Citation2011). Hence, only the first 5 d of TJ were considered in the analysis.
Each TJ is projected on to bi-dimensional +24 hours forecasted Snowfall (SF), surface Pressure (SP) and tri-dimensional Potential Vorticity (PV, 1PV = 10−6 m2s−1 K kg−1), WS ERA INTERIM data fields. The methodology allows tracking the evolution of those fields along the TJ, connecting to each TJ point the discrete field value (for SF and SP) or the profile values along the vertical (for WS and PV) of the nearest model grid point.
Analysis of synoptical pattern connected to stratospheric–tropospheric exchange was deployed with ERA INTERIM geopotential height and Potential vorticity fields at 500 hPa (GP500 and PV500, respectively). GP500 and PV500 fields were smoothed with a 101 weight Lanczos filter as described by Duchon (Citation1979) with a cut-off limit of 5 d, in order to disregard the high frequency transient systems from low frequency features. The zonal mean was removed from the GP500 field before the Lanczos filtering in order to highlight the wave train pattern along the atmospheric flow.
aerosol records highlight the strongest increase (up to 320 ng m−3) in mid-November 2006 (a) caused by the evolution of a stratospheric air intrusion that lasted from 4 to 6 d before over the Enderby Lands.
The mechanisms by which stratospheric air mixes into the troposphere are complex (Vaughan et al., Citation2001) but the tropopause folding is an important mesoscale process and likely one of the major sources of STE in the extratropics (Holton et al., Citation1995).
Back trajectories starting in the range 11–14 of November 2006 show air mass advection from the ocean toward the continent with intrusion over land shifting westward from Shackleton Ice Shelf toward Enderby Lands (a). The air mass movement is connected to an atmospheric ridging apparent in GP500 field (b, c, d). The ridge developed from 6 to 9 November 2006, it is centred over 60°S off shore Law Dome site and protruding toward the continent along 100° E. The area is frequently exposed to the effect of atmospheric ridging in the upper troposphere (Hirasawa et al., Citation2000; Rasmussen and Turner, Citation2003). b, c, d show how the mean zonal flow is partially destroyed by the presence of the stationary high-pressure anomaly greater than +200 gpm lasting 2–4 d. The transient eddies is consequently blocked over the American Highlands by the high pressure and gradually stretched westward along Enderby Lands. Warm and moist air masses are conveyed toward the continent, adiabatically lifted up and condensated with an enhancement in SF over the steep Antarctic coast (). Recent studies (Goodwin et al., Citation2003; Massom et al., Citation2004; Scarchilli et al., Citation2011) showed how blocking high condition or strong Rossby wave breaking at extratropical/high latitude increase SF over the Antarctic interior through the deflection of zonal flow and consequent channelling of warm and moist air masses over the continent.
Fig. 6 Back trajectory analysis for the largest nitrate event. (a) 5-d back trajectories (TJ) starting from DC every 6 hours from 13 to 11 November 2006. Colour scale represents air mass position along the TJ's path during the same days. (b–d) Map of 5-d low pass filtered of positive anomalies of Geopotential at 500 hPa (shaded scale contour), 5-d low pass filtered of Potential Vorticity anomalies (green scale contour) and positive and negative 5-d high pass filtered of Geopotential 500 hPa (red and blue line respectively) during 7 Nov 2006 00 UTC, 7 Nov 2006 12 UTC and 8 Nov 2006 00 UTC respectively.
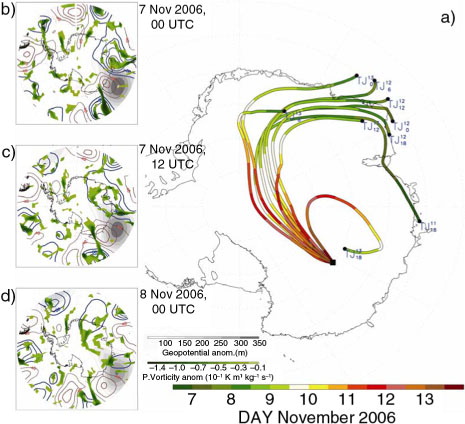
Fig. 7 Synoptical pattern analysis for the largest nitrate aerosol event. (a, b) Potential temperature (red line) and Snowfall (grey filled) values during 6 d back trajectories path starting from DC at 12 and 13 November 2006 00 UTC, respectively. (c, d) Potential vorticity (filled contour), wind speed (line contour) and surface (black line) cross-section along 6 d back trajectories path (green line) starting from DC at 12 and 13 November 2006 00 UTC, respectively.
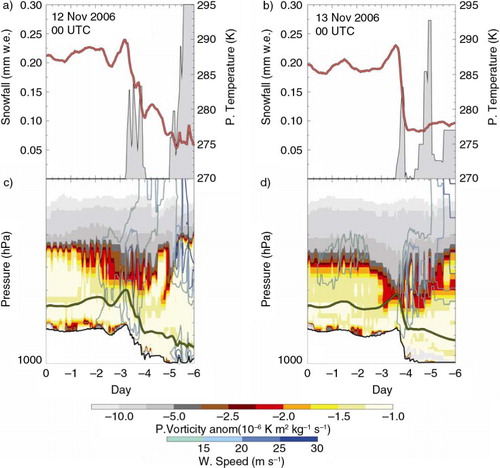
With the conventional definition of PV, the extratropical tropopause is found from observation to be remarkably close to the 2-PV potential vorticity surface (Holton et al., Citation1995). PV contour at 500 hPa (c, d) highlight the establishment of a stratospheric fold within the isentropic layers 285–315 K, which move westward over the Enderby Land, following the eddies path (b). Tropopause folds have long been known to form in the baroclinic zones beneath the polar jet streams (e.g. Danielsen, Citation1968); it occurs on the western flank of low system where the isentropes are steeped by the jet core (Mihalikova and Kirkwood, Citation2013) and consequently the tropopause is bend downwards (b, d). The fold intercepts TJ arriving on the 12 (6 UTC) and 13 (00 UTC) November, 3–4 d before their arrival at DC site, over the edge of the steep Antarctic coast, where the air masses are orographically lifted up to 400 hPa, well inside the fold and they last above the −1.5 PV layer for more than 12 hours.
Although further data and years of observations are needed to make the analysis of synoptical patterns more statistically significant, the reported results show the occurrence of favourable meteorological conditions for the STE, in correspondence of the most intense nitrate inputs to Dome C aerosol.
3.3. Comparison with meteorological data
An interesting relationship between the early-summer nitrate peaks at Dome C and PSC can be observed in . Here, we report the data (provided by the NASA Ozone Hole Watch website http://ozonewatch.gsfc.nasa.gov/ by using MERRA satellite) related to the estimated area and volume of PSC I, basically made of nitric acid trihydrate (NAT), in the time period covered by Dome C aerosol data. a and 8b report the area and volume, respectively, of PSC I in the years from 2005 and 2008, in different colours, and, in black, the same parameters averaged in the 1979–2012 period. It can be observed, in a sharper way for the area with respect to the volume, that 2006 was characterised by the largest amount of PSCs, always larger than the 33-yr long mean, followed by the year 2008. Moreover, the favourable conditions for PSC formation lasted for a longer time in 2006 as shown by the data of mean zonal T at 150 hPa (Ozone Hole Watch NASA website) covering the period comprised between half July and the beginning of October while, during the other years, the favourable conditions start later (end of July) or end earlier (mid-September). Such a difference with respect to the mean and to the other years can be better appreciated in the c and 8d reporting the sum of all the differences (daily resolution) between each sampling year and the 33-yr mean, in order to have a view on the integral of the NAT curves just shown and, therefore, on the total budget of PSC I formed during each year in the Southern Hemisphere (the data refer to the 60°–90° latitude range). Concerning the NAT area, these differences are always positive with a delta for 2006 which is at least twice of the other 3 yr, whereas, concerning the NAT volume, 2005 and 2007 show a gap with respect to the mean while 2006 and 2008 show a positive difference, with 2006 exhibiting a PSC I volume twice that of the one estimated for 2008.
Fig. 8 NAT area and volume in the sampled years (rough data and yearly cumulative averages). Temporal profile of area (a) and volume (b) of nitric acid trihydrate (NAT) in Polar Stratospheric Clouds I (NASA Ozone Hole Watch website) in the time period covered by Dome C aerosol data (2005–2008). Different colours were used for the different single years while the same parameters, averaged in the 1979–2012, are reported in black. Cumulative difference of area (c) and volume (d) of NAT for each year with respect to the relative 33-yr mean.
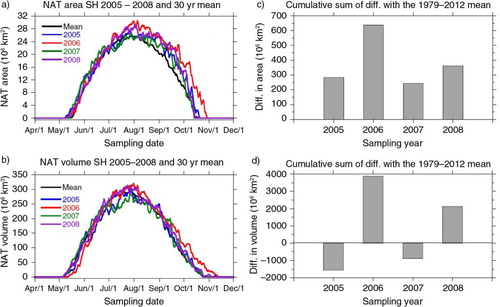
Given that the stratosphere–troposphere exchange is more likely to occur with the breakup of the polar vortex (by the end of the winter–early summer, Thompson and Solomon, Citation2002), we can reasonably assume that the more nitric acid was present in the stratosphere during the Antarctic winter, the more would be exchanged with the troposphere in early summer. These data indicate a larger formation of PSC I containing nitric acid in 2006, which is the year where the highest spikes in nitrate aerosol concentration were observed.
By looking specifically at the extent of the time period interested by PSC I formation, estimated on the basis of temperature at 100 and 150 hPa (again, provided by NASA Ozone Hole Watch website), a similar feature can be highlighted. In fact, it can be observed that 2006 and 2008 are characterised by the longest duration of favourable conditions for PSC I formation. Indeed, these conditions appear to have lasted for almost 3 months at 100 hPa and more than 2 months at 150 hPa pressure in both 2006 and 2008, whereas their formation occurred in about 2 months at 100 hPa and something more than 1 month at 150 hPa pressure in both 2005 and 2007.
In addition, using MIPAS satellite data to calculate the extent of the stratosphere-to-troposphere loss of NOy (N, NO, NO2, NO3, N2O5, HNO3, HNO4, ClONO2) in the Southern Hemisphere (60°–90° S) in the same period covered by aerosol measurements (unpublished data), it appears that the largest loss, expressed as N mass, occurs indeed in the 2006, with the other years following the same order of decreasing peak concentration, as above reported. It has to be noted that at the altitude of the tropopause, where this loss occurs, NOy are mainly constituted by nitric acid; in fact, the typical HNO3 fraction to NOy is 80–90% at the tropopause level (Mengistu Tsidu et al., Citation2005). This can hardly be a coincidence and, although it should be confirmed by a longer aerosol data set, it hints towards the stratosphere as a significant source of sporadic but intense nitrate inputs, regularly through the different years.
One feature yet to be fully understood is the reason for the constant 3-month lag between the maximum of the loss from the stratosphere, occurring in August–September, and the observed nitrate peaks, occurring in November–December. Actually, given that detailed studies concerning specific residence times and gas-to-particle conversion times of N species in the tropopause are needed, it is known that the estimated residence time of aerosol particles in the tropopause can reach a few months (Brimblecombe, Citation1996) and this could be taken into account to justify such a lag.
However, the possible relationship between area and volume of PSC I, stratospheric NOy and the peak of atmospheric nitrate measured at Dome C should be confirmed by devoted meteorological analyses and longer lasting observations, which we are confident to achieve thanks to the continuous aerosol sampling still on-going at Dome C.
3.4. Surface snow
As mentioned earlier, a possible explanation for higher summer levels of nitrate is the re-emission from the snowpack through photolysis-emission of NOx and subsequent oxidation in the atmosphere (in oxidising conditions) or through HNO3 re-emission (e.g. Grannas et al., Citation2007; Erbland et al., Citation2013). At inland sites, the hypothesis of a nitrate source due to the re-emission from the snow layers is supported by several authors, such as Weller and Wagenbach (Citation2007) for Kohnen, who suggest such a source is very likely restricted to the summer months. Piel et al. (Citation2006) supported the occurrence of this process for MSA also, again at Kohnen.
Arimoto et al. (Citation2008) also propose local emissions of NOx from the snow as a dominating source for ‘filterable nitrate’ at South Pole even though transport of nitrate or nitric acid from distant sources (not actually ascertained) might also contribute. In the same site, Huey et al. (Citation2004) found relatively high mixing ratios of HNO3 and low NO (in the framework of ISCAT 2000 campaign) when air was mixed downward, but the source for the HNO3 could not be definitively ascertained. At South Pole, the observation showing high HNO3 and low NO values contemporaneously (Huey et al. Citation2004) suggests that HNO3-rich air from the free troposphere may descend onto the plateau and serve as primary source of nitrate to the snowpack although high values of HNO3 can also be explained from oxidised snowpack emissions upwind of South Pole, according to the authors.
Nevertheless, they concluded that NOx emitted from the snowpack by photolysis of nitrate and potentially other species (Huey et al., Citation2004 and references therein) is efficiently oxidised to HNO3 and HO2NO2 and then returned to the snowpack with a lifetime of a few hours so that it is a hard task assessing if the net balance of loss by photolysis/re-emission and re-deposition is positive or negative in a certain season.
From a different kind of measurement, Frey et al. (Citation2009) also support the existence of a ‘re-emission’ source just at Dome C, on the basis of nitrogen and oxygen isotopic composition of nitrate, determined in the atmosphere and in the snow layers. In these samples, δ15N in atmospheric shows a strong decrease from background levels (4±7‰) to −35‰ in spring followed by a new increase in the next summer, consistent with significant emissions of reactive nitrogen from the snowpack (Frey et al., Citation2009).
On the basis of field and laboratory evidence, Frey et al. (Citation2009) suggest that photolysis is an important process driving fractionation and associated loss from snow at Dome C. After sunrise, photolysis drives then redistribution of
from the snowpack photic zone to the atmosphere and a snow surface skin layer, thereby concentrating
at the surface.
Help in understanding the timing and relative extent of these different sources of nitrate in atmospheric aerosol might come from the analysis of snow layers, sampled contemporaneously with aerosol in the clean area surrounding Dome C base. The sampling of surface snow (within a depth range of about 0.5–2 cm, depending on the hardness of the snow cover) was performed, when possible, twice a day, every day, in conditions of minimum and maximum solar irradiance, just to study its effect of the chemical content of the superficial snow layers.
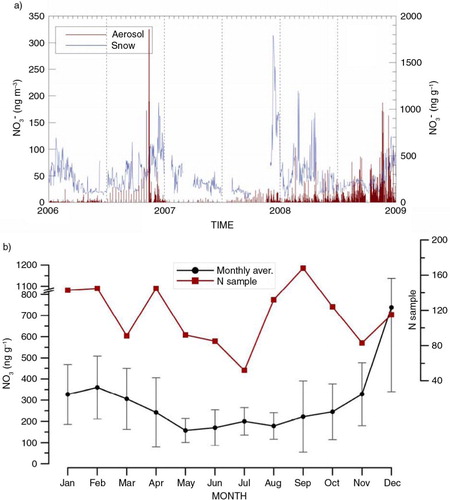
The record of nitrate in surface snow (2006–2008) does not cover exactly the same time span of aerosol measurements (2005–2008) but 3 yr are represented by both kinds of measurements allowing us to draw some preliminary conclusions from the study of seasonal patterns.
As one can observe from , nitrate concentration in the snow layers exhibits a similar pattern to the concentration in aerosol, with winter minima and early summer maxima, in all the three analysed years. Background concentration values in winter are between 147 and 212 ng/g each year and tend to rise approaching summer, reaching levels of 1000 ng/g, as in December 2006, and even up to 1500 ng/g in December 2007. One has to notice that the concentration maxima in aerosol and snow do not coincide neither in timing, with occurring in early summer in aerosol and late summer in the snow (lag of 1–2 months), nor in intensity (e.g. the peak in snow samples in 2007 is the highest in absolute while it is the lowest among the annual maxima in aerosol samples). A similar lag (3–4 weeks) between nitrate maxima in aerosol and snow was found by CitationErbland et al. (2013) for p-NO3+g-HNO3 and skin snow layers simultaneously sampled at Dome C in 2009–10.
Fig. 9 Nitrate concentration in aerosol and snow. (a) Temporal profile of nitrate concentration in aerosol (red line) and surface snow (blue line) for the period covered by contemporaneous samplings (2006–09). (b) Monthly averages and related standard deviations of nitrate in surface snow with the indication of sampling representativeness in each month (red squares).
CitationErbland et al. (2013) ascribe such a shift in atmosphere and snow maxima to a larger flux of reactive nitrogen species from the snow to the atmosphere due to UV photolysis when compared to a lower deposition flux of nitrate in this period. We support the possibility that this temporal dephasing might be due to actual processes involving a nitrate loss from surface snow layers (with a consequent enrichment in the possibly formed hoar layers, Udisti et al., Citation2004) depending on the seasonal and daily meteorological conditions (UV intensity, temperature and wind intensity, mostly) but a sampling artefact cannot be ruled out. In fact, considering the low snow accumulation at Dome C (25 kg m−2 yr−1, as reported consistently by several authors, e.g. Stauffer et al., Citation2004; Frey et al., Citation2009) and given that a layer a few millimetres thick is collected each time (with a not negligible uncertainty due to the different hardness conditions and to the specific operator's skills), it is probable that the snow sample collected on a certain day actually relates to snow deposited in earlier days–weeks, thus preventing a reliable temporal comparison of aerosol and snow chemical temporal series on the daily–weekly timescale. However, despite these limitations, which need to be taken into account, the comparison between nitrate series in aerosol and snow is able to provide useful information on the major sources of this component in Dome C tropospheric aerosol. In fact, on the annual time scale, it can be observed that both snow and aerosol maxima occur within the summer season, in every sampled year. This evidence deserves some attention since the ‘re-emission’ source of nitrate at this site, either coming from direct re-emission of volatile HNO3 from the snow layers or from a combination of photolysis/oxidation processes (nitrate in the superficial layers can be decomposed to NOx by sunlight, NO are re-emitted in gas-phase into the atmosphere and there they can be re-oxidised to when a sufficient amount of oxidants and sufficient sunlight are available), is supposed to be stronger during summer, both due to higher temperature and solar irradiation.
In order to quantify the extent of such a ‘re-emission’ source at Dome C, we can use an estimation of nitrate loss to the atmosphere carried out by Traversi et al. (Citation2009) on the basis of four snowpit records at the same site. After 1 yr of deposition, the average nitrate loss from the snow layers can be estimated in 50.5±21.4 ng/g (covering about the 30±8.6% of nitrate concentration in the top layer of the sampled snowpits). Consequently, considering the average nitrate concentration in the top layer and the average annual accumulation rate, the emission flux of nitrate from the surface is 1.6±0.5 mg m−2 yr−1. Hence, following the consideration of a 100-m thick atmospheric layer (Weller and Wagenbach, Citation2007), we can assess in 43.6 ng m−3 d−1 the daily nitrate concentration supplied to this atmospheric compartment by pure re-emission. This would be fully sufficient in itself to explain the summer background values and a significant fraction of the summer peaks (roughly from 10 to 40% considering all the sampled years). However, other sources are needed to explain the full nitrate budget, and especially the summer spikes. According to the above results and considerations, a significant impact of the stratospheric source in summer sounds reasonable (see, for instance, Wagenbach et al., Citation1998 and Savarino et al., Citation2007), together with a larger oxidation rate in the boundary layer (shifting the NOx– equilibrium towards nitrate) and also larger contributions of nitrate from mid-latitudes (Wolff et al., Citation2008).
Considering the relatively low value of the estimated loss from the snowpack with respect to the summer nitrate levels measured in the surface snow in 2006–2008, which are at least one order of magnitude larger than the loss, the snow nitrate record is not able to show any evident signatures of the re-emission occurring in summer, like a possible depletion during this season. On the contrary, summer values are the highest through the year.
As proposed by Davis et al. (Citation2008) and demonstrated by the works of Savarino et al. (Citation2007), Frey et al., (Citation2009) and CitationErbland et al. (2013), a possibility to explain nitrate summer maxima in surface snow layers is that nitrate re-emission and/or photolysis in the very top layers can enhance the nitrate gradient between the most superficial layers and the underlying layers (down to 25 cm for photolysis – Grannas et al., Citation2007 and down to 80 cm for HNO3 re-emission – Traversi et al., Citation2009) causing a sort of bottom-up movement of HNO3 to the first cm depth. This would lead to a further HNO3 re-emission into the atmosphere and/or would allow a more efficient nitrate photolysis; the emitted nitrate could be then re-deposited as such and the NOx produced by photolysis could undergo further oxidation in a highly oxidising atmosphere and the formed gas-phase HNO3 could again be deposited onto the snowpack by absorption processes. In any case, our data support that the dynamical interaction occurring at the air–snow interface (uptake and re-emission/photolysis) would eventually cause an enrichment of HNO3 in the most superficial layers.
In fact, as one can observe by the anionic chemical composition of the uppermost snow layers (hoar), nitrate represents by far the most abundant anion (Udisti et al., Citation2004 and unpublished data) in the skin layer at Dome C, probably due to the preferential repartition of nitrate in gas-phase nitric acid, able to be absorbed by the hoar layers, characterised by a large surface/volume ratio.
This effect can work by itself or in synergy with other sources, acting in the same period (November–December) like the STE causing higher NOx and HNO3 concentration in the troposphere. If such an exchange is able to transfer to the troposphere HNO3 as such, this could justify the higher nitrate levels seen during early summer; instead, in order to highlight the nitrate enhancement due to NOx transfer, an atmospheric oxidation process is necessary. This process probably requires both a sufficient amount of oxidising species as well as the presence of sunlight, both enhanced during summer. This would explain the high summer values and also the low values during winter, when low or no sunlight and a low oxidants amount are present.
4. Conclusions
The presented data allowed us to provide a preliminary assessment of nitrate aerosol concentration all through the year at Dome C, which improves our knowledge of the chemistry of the boundary layer over the Antarctic plateau and gives us further tool to better interpret the nitrate stratigraphies from the deep EPICA-Dome C ice core.
The most evident feature highlighted in both atmospheric aerosol and surface snow was a recurring seasonal pattern, with a temporal shift within summer to be investigated in further studies, consisting in winter minima and summer maxima.
Higher summer concentration of nitrate during early summer can be explained by a synergy effect of:
an enhanced source of nitric acid and/or nitrate precursors due to stratospheric inputs and re-emission from the surface, both sources being active in summer season, under consideration of transport times.
With regard to re-emission from snow layers, this can involve uppermost layers as well deeper layers enriching nitrate content in the very top layers of snow and, possibly, also in the atmosphere through snow/atmosphere exchange.
an enhanced oxidation of NOx to nitrate during the season of highest irradiance and highest oxidation capacity of the atmosphere. This stresses the complexity of the photochemical cycling of NOx–NO3 − since our results indicate that UV flux appears to play mostly in favour of increasing nitrate concentration in the uppermost snow layers rather than decomposing them.
Summer maxima in snow can be explained both by uptake processes of gas-phase nitric acid (in higher concentration in the atmosphere during summer) and also by re-emission from deeper layers triggering the most efficient air-to-snow exchanges leading eventually to nitrate enrichment in the very top layers.
In conclusion, nitrate content in the snow at Dome C appears to be mostly dominated by the processes active at the air–snow interface, unlike other chemical markers. This is to be taken into serious account when interpreting data from EPICA Dome C ice core, since not only the well-known post-depositional effect of nitrate loss by re-emission but also other processes seems to take place, such as the uptake from the atmosphere, in complex relationship with the extent and type of snow deposition.
Acknowledgements
This research was performed in the framework of the Air-Glacs1181 ‘Station Concordia’ project, which was funded by the MIUR through the Italian ‘Programma Nazionale di Ricerche in Antartide’ (PNRA) and in the framework of ‘PRIDE’ (2009/A2.21) and ‘DECA-POL’ (2010/A3.05) PNRA projects. The field operations benefited from the support of the French-Italian Concordia Station. This paper is a contribution to the HOLOCLIP project, which is funded by the European Science Foundation. This is HOLOCLIP publication no. 25. Meteorological data and information were obtained from IPEV/PNRA Project “Routine Meteorological Observation at Station Concordia – www.climantartide.it. Moreover, the authors appreciate the support of the AMRC, SSEC, UW-Madison for the data set, NSF grant numbers ANT-0944018 and ANT-1245663. B. Funke was supported by the Spanish MCINN under grant AYA2011-23552 and EC FEDER funds. We are grateful to the anonymous reviewers whose comments markedly improved the final manuscript.
Related Research Data
References
- Arimoto R. , Hogan A. , Grube P. , Davis D. , Webb J. , co-authors . Major ions and radionuclides in aerosol particles from the South Pole during ISCAT-2000. Atmos. Environ. 2004; 38: 5473–5484.
- Arimoto R. , Nottingham A. S. , Webb J. , Schloessin C. A. , Davis D. D . Non-sea salt sulfate and other aerosol constituents at the South Pole during ISCAT. Geophys. Res. Lett. 2001; 28(19): 3645–3648.
- Arimoto R. , Zeng T. , Davis D. , Wang Y. , Khaing H . Concentrations and sources of aerosol ions and trace elements during ANTCI-2003. Atmos. Environ. 2008; 42: 2864–2876.
- Becagli S. , Scarchilli C. , Traversi R. , Dayan U. , Severi M. , co-authors . Study of present-day sources and transport processes affecting oxidised sulphur compounds in atmospheric aerosols at Dome C (Antarctica) from year-round sampling campaigns. Atmos. Environ. 2012; 52: 98–108.
- Blunier T. , Floch G. L. , Jacobi H.-W. , Quansah E . Isotopic view on nitrate loss in Antarctic surface snow. Geophys. Res. Lett. 2005; 32: L13501.
- Brimblecombe P . Air Composition and Chemistry. 1996; Cambridge, UK: Cambridge University Press.
- Charney J. G. , Drazin P. G . Propagation of planetary-scale disturbances from the lower into the upper atmosphere. J. Geophys. Res. 1961; 10466: 1692583–16928109.
- Danielsen E. F . Stratospheric–tropospheric exchange based on radioactivity, ozone and potential vorticity. J. Atmos. Sci. 1968; 25: 502–518.
- Davis D. , Nowak J. B. , Chen G. , Buhr M. , Arimoto R. , co-authors . Unexpected high levels of NO observed at South Pole. Geophys. Res. Lett. 2001; 28: 3625–3628.
- Davis D. D. , Eisele F. , Chen G. , Crawford J. , Huey G. , co-authors . South Pole NOx chemistry: an assessment of factors controlling variability and absolute levels. Atmos. Environ. 2004; 38: 5375–5388.
- Davis D. D. , Seelig J. , Huey G. , Crawford J. , Chen G. , co-authors . A reassessment of Antarctic plateau reactive nitrogen based on ANTCI 2003 airborne and ground based measurements. Atmos. Environ. 2008; 42: 2831–2348.
- Dee D. P. , Uppala S. M. , Simmons A. J. , Berrisford P. , Poli P. , co-authors . The ERA-Interim reanalysis: configuration and performance of the data assimilation system. Q. J. Roy. Meteorol. Soc. 2011; 137: 553–597.
- Draxler R. R. , Rolph G. D . HYSPLIT (HYbrid Single-Particle Lagrangian Integrated Trajectory). 2012. NOAA Air Resources Laboratory, Silver Spring, MD. Model access via NOAA ARL READY Website. Online at: http://ready.arl.noaa.gov/HYSPLIT.php .
- Duchon C. E . Lanczos filtering in one and two dimensions. J. Appl. Meteorol. 1979; 18: 1016–1022.
- Erbland J. , Vicars W. C. , Savarino J. , Morin S. , Frey M. M. , co-authors . Air-snow transfer of nitrate on the East Antarctic Plateau – Part 1: isotopic evidence for a photolytically driven dynamic equilibrium in summer. Atmos. Chem. Phys. 2013; 13: 6403–6419.
- Frey M. M. , Savarino J. , Morin S. , Erbland J. , Martins J. M. F . Photolysis imprint in the nitrate stable isotope signal in snow and atmosphere of East Antarctica and implications for reactive nitrogen cycling. Atmos. Chem. Phys. 2009; 9: 8681–8696.
- Goodwin I. , de Angelis M. , Pook M. , Young N. W . Snow accumulation variability in Wilkes Land, East Antarctica, and the relationship to atmospheric ridging in the 130°–170° E since 1930. J. Geophys. Res. 2003; 108(D21): 4673.
- Grannas A. M. , Jones A. E. , Dibb J. , Ammann M. , Anastasio C. , co-authors . An overview of snow photochemistry: evidence, mechanisms and impacts. Atmos. Chem. Phys. 2007; 7: 4329–4373.
- Hirasawa N. , Nakamura H. , Yamanouchi T . Abrupt changes in meteorological conditions observed at an inland Antarctic Station in association with wintertime blocking. Geophys. Res. Lett. 2000; 27(13): 1911–1914.
- Holton J. R. , Haynes P. H. , McIntyre M. E. , Douglass A. R. , Rood R. B. , co-authors . Stratosphere-troposphere exchange. Rev. Geophys. 1995; 33: 403–439.
- Huey L. G. , Tanner D. J. , Slusher D. L. , Dibb J. E. , Arimoto R. , co-authors . CIMS measurements of HNO3 and SO2 at the South Pole during ISCAT 2000. Atmos. Environ. 2004; 38: 5411–5421.
- Jones A. E. , Weller R. , Minikin A. , Wolff E. W. , Sturges W. T. , co-authors . Oxidised nitrogen chemistry and speciation in the Antarctic troposphere. J. Geophys. Res. 1999; 104(D17): 21355–21366.
- Legrand M. , Delmas R. J . The ionic balance of Antarctic snow: a 10-year detailed record. Atmos. Environ. 1984; 18: 1867–1874.
- Legrand M. R. , Kirchner S . Origins and variations of nitrate in south polar precipitation. J. Geophys. Res. 1990; 95(D4): 3493–3507.
- Legrand M. , Preunkert S. , Jourdain B. , Gallee H. , Goutail F. , co-authors . Year-round record of surface ozone at coastal (Dumont d'Urville) and inland (Concordia) sites in East Antarctica. J. Geophys. Res. 2009; 114(D20306):
- Legrand M. , Wolff E. , Wagenbach D . Antarctic aerosol and snowfall chemistry: implications for deep Antarctic ice core chemistry. Ann. Glaciol. 1999; 29: 66–72.
- Logan J. A . Nitrogen oxides in the troposphere: global and regional budgets. J. Geophys. Res. 1983; 88: 10785–10807.
- Massom R. A. , Pook M. J. , Comiso J. C. , Adams N. , Turner J. , co-authors . Precipitation over the interior East Antarctic ice Sheet related to midlatitude blocking-high activity. J. Clim. 2004; 17: 1914–1928.
- Mengistu Tsidu G. , Stiller G. P. , von Clarmann T. , Funke B. , Höpfner M. , co-authors . NOy from Michelson interferometer for passive atmospheric sounding on environmental satellite during the Southern Hemisphere polar vortex split in September/October 2002. J. Geophys. Res. 2005; 110: 11301.
- Mihalikova M. , Kirkwood S . Tropopause fold occurrence rates over the Antarctic station Troll (72°S, 2.5°E). Ann. Geophys. 2013; 31: 591–598.
- Mulvaney R. , Wagenbach D. , Wolff E. W . Post depositional change in snow pack nitrate from observation of year-round near surface snow in coastal Antarctica. J. Geophys. Res. 1998; 103(D9): 11021–11031.
- Mulvaney R. , Wolff E. W . Evidence for winter/spring denitrification of the stratosphere in the nitrate record of Antarctic firn cores. J. Geophys. Res. 1993; 98(D3): 5213–5220.
- Mulvaney R. , Wolff E. W . Spatial variability of the major chemistry of the Antarctic ice sheet. Ann. Glaciol. 1994; 20: 440–447.
- Piel C. , Weller R. , Huke M. , Wagenbach D . Atmospheric methane sulfonate and non-sea salt sulphate records at the EPICA deep-drilling site in Dronning Maud Land, Antarctica. J. Geophys. Res. 2006; 111(D03304):
- Priyadarshi A. , Dominguez G. , Savarino J. , Thiemens M . Cosmogenic 35S: a unique tracer to Antarctic atmospheric chemistry and the polar vortex. Geophys. Res. Lett. 2011; 38: L13808.
- Rasmussen E. A. , Turner J . Polar lows: Mesoscale weather systems in the Polar Regions. 2003; Cambridge: Cambridge University Press. 612. ISBN 0-521-62430-4.
- Röthlisberger R. , Hutterli M. A. , Wolff E. W. , Mulvaney R. , Fischer H. M. , co-authors . Nitrate in Greenland and Antarctic ice cores: a detailed description of post-depositional processes. Ann. Glaciol. 2002; 35: 209–216.
- Savarino J. , Kaiser J. , Morin S. , Sigman D. M. , Thiemens M. H . Nitrogen and oxygen isotopic constraints on the origin of atmospheric nitrate in coastal Antarctica. Atmos. Chem. Phys. 2007; 7: 1925–1945.
- Scarchilli C. , Frezzotti M. , Ruti P. M . Snow precipitation at four ice core sites in East Antarctica: provenance, seasonality and blocking factors. Clim. Dynam. 2011; 37: 2107–2125.
- Schaap M. , Müller K. , ten Brink H. M . Constructing the European aerosol nitrate concentration field from quality analysed data. Atmos. Environ. 2002; 36: 1323–1335.
- Schaap M. , Spindler G. , Schulz M. , Acker K. , Maenhaut W. , co-authors . Artefacts in the sampling of nitrate studied in the “INTERCOMP” campaigns of EUROTRAC-AEROSOL. Atmos. Environ. 2004; 38: 6487–6496.
- Schlosser E. , Oerter H. , Masson-Delmotte V. , Reijmer C . Atmospheric influence on the deuterium excess signal in polar firn: implications for ice-core interpretation. J. Glaciol. 2008; 54(184): 117–124.
- Stauffer B. , Flückiger J. , Wolff E. W. , Barnes P. R. F . The EPICA deep ice cores: first results and perspectives. Ann. Glaciol. 2004; 39: 93–100.
- Thompson D. W. J. , Solomon S . Interpretation of recent Southern Hemisphere climate change. Science. 2002; 296: 895–899.
- Traversi R. , Becagli S. , Castellano E. , Cerri O. , Morganti A. M. , co-authors . Study of Dome C site (East Antarctica) variability by comparing chemical stratigraphies. Microchem. J. 2009; 92: 7–14.
- Traversi R. , Usoskin I. G. , Solanki S. K. , Becagli S. , Frezzotti M. , co-authors . Nitrate in polar ice: a new tracer of solar variability. Solar Physi. 2012; 280: 237–254.
- Udisti R. , Becagli S. , Benassai S. , Castellano E. , Fattori I. , co-authors . Atmosphere – snow interaction by a comparison between aerosol and uppermost snow layers composition at Dome C (East Antarctica). Ann. Glaciol. 2004; 39: 53–61.
- Udisti R. , Dayan U. , Becagli S. , Busetto M. , Frosini D. , co-authors . Sea-spray aerosol in central Antarctica. Present atmospheric behavior and implications for paleoclimatic reconstructions. Atmos. Environ. 2012; 52: 109–120.
- Vaughan G. , O'Connor F. M. , Wareing D. P . Observations of streamers in the stratosphere and troposphere using ozone lidar. J. Atmos. Chem. 2001; 38: 295–315.
- Wagenbach D. , Legrand M. , Fischer H. , Pichlermayer F. , Wolff E. W . Atmospheric near-surface nitrate at coastal Antarctic sites. J. Geophys. Res. 1998; 103(D9): 11007–11020.
- Wagnon P. , Delmas R. J. , Legrand M . Loss of volatile acid species from the upper firn layers at Vostok, Antarctica. J. Geophys. Res. 1999; 104(D3): 3423–3431.
- Weller R. , Jones A. E. , Wille A. , Jacobi H.-W. , McIntyre H. P. , co-authors . Seasonality of reactive nitrogen oxides (NOy) at Neumayer Station, Antarctica. J. Geophys. Res. 2002; 107(D23): 4673.
- Weller R. , Wagenbach D . Year-round chemical aerosol records in continental Antarctica obtained by automatic samplings. Tellus B. 2007; 59: 755–765.
- Wolff E. W . Delmas R. J . Nitrate in polar ice. Ice Core Studies of Global Biogeochemical Cycles. 1995; Berlin: Springer-Verlag, R.J.. 195–224. (NATO ASI Series I: Global Environmental Change 30).
- Wolff E. W. , Barbante C. , Becagli S. , Bigler M. , Boutron C. F. , co-authors . Changes in environment over the last 800 000 years from chemical analysis of the EPICA Dome C ice core. Quat. Sci. Rev. 2010; 29: 285–295.
- Wolff E. W. , Jones A. E. , Bauguitte S. J.-B. , Salmon R. A . The interpretation of spikes and trends in concentration of nitrate in polar ice cores, based on evidence from snow and atmospheric measurements. Atmos. Chem. Phys. 2008; 8: 5627–5634.
- Yang X.-Y. , Huang R. X. , Wang D. X . Decadal changes of wind stress over the Southern Ocean associated with Antarctic Ozone depletion. J. Clim. 2007; 20: 3395–3410.
- Zatko M. C. , Grenfell T. C. , Alexander B. , Doherty S. J. , Thomas J. L. , co-authors . The influence of snow grain size and impurities on the vertical profiles of actinic flux and associated NOx emissions on the Antarctic and Greenland ice sheets. Atmos. Chem. Phys. 2013; 13: 3547–3567.