
Abstract
During the mid-1980s, there were 31 stations in China that successfully participated in the Global Network of Isotopes in Precipitation. However, most observations were suspended after the mid-1990s. The discontinuous data hindered the application of precipitation isotopes, which are strongly affected in China by the Asian monsoon and are thus of intrinsic interest for palaeoclimatologists. Therefore, to continuously observe precipitation isotopes nationwide, the Chinese Network of Isotopes in Precipitation was established in 2004. The current study reviewed the major characteristics of the 928 samples that were collected from 2005 to 2010. The ranges of δD and δ18O values generally followed the pattern NE>NW>TP>NC>SC, and the amount-weighted δ-values followed the pattern SC>NW>NC>TP>NE. Temporal variations presented a ‘V’-shaped pattern at the SC region and reverse ‘V’-shaped patterns at the NE and NW regions. Decreasing trends with the advent of the rainy season were found at the NC and TP regions. The Chinese Meteoric Water Line has been established as δD=7.48δ18O+1.01. The distributions of scattering along the line demonstrated different water vapour origins and characteristics. The values of δ18O showed strong temperature dependence at the NE (0.27‰/°C) and NW stations (0.37‰/°C), and this dependent variable switched to water vapour pressure and vapour pressure at the SC stations. The geographical controls of δ18O were −0.22‰/° and −0.13‰/100 m for latitude and altitude, respectively. The δ18O/Latitude gradient increased from south to north at the Eastern Monsoon Region, and the δ18O/Altitude gradient (−0.30‰/100 m) was especially significant for the TP region. The results of this study could provide basic isotopic information for on-going investigations in hydrology, meteorology, palaeoclimatology and ecology at different regions of China.
1. Introduction
Environmental hydrogen and oxygen isotopes are ideal tracers of water, as they are incorporated in the water molecules and their behaviours and variations reflect the origin of, and the hydrological and geochemical processes undergone by, natural water bodies (Gonfiantin, Citation1998). Isotopes are primarily used in one of two ways: as tracers or to monitor a process. Tracer applications rely directly on the isotopic labelling of atmospheric vapour and/or the resultant precipitation. Process applications focus on factors that control the water isotope evolution in atmospheric vapour or the fractionation between precipitation and the oxygen-bearing proxies (Bowen and Revenaugh, Citation2003). The Global Network of Isotopes in Precipitation (GNIP), which was initiated in 1958 by the International Atomic Energy Agency (IAEA) and the World Meteorological Organization (WMO), is by far the largest endeavour of this type. The network became operational at approximately 106 observation sites from 50 countries with the aim of systematically collecting basic data on the isotope content of precipitation on a global scale and determining its temporal and spatial variations. Currently, the network has expanded to more than 1380 sites from 136 countries (IAEA, Citation2013). Some long-standing participants of GNIP also incorporate multiple stations to form their national networks, such as the ANIP (Austrian Network of Isotopes in Precipitation; Kralik et al., Citation2003), CNIP (Canadian Network of Isotopes in Precipitation; Gibson et al., Citation2005) and USNIP (United States Network for Isotopes in Precipitation; Vachon et al., Citation2007), to better document and understand the distribution of water isotope tracers in precipitation. The accumulated data, some of which span more than five decades, provide a framework for applications in national surface and groundwater hydrology, synoptic climatology, palaeoclimatology and plant–water interactions.
The study of precipitation isotopes started relatively late in China; the earliest study may be from the scientific investigation of the Qomolangma, on the southern Tibetan Plateau (TP) in the 1960s (Zhang et al., Citation1973). The first systematic study on precipitation D and 18O across China was conducted in 1980 (Zheng et al., Citation1983). Samples were collected every 10 d or monthly at eight stations. A meteoric water line (MWL) was established (δD=7.48δ18O+1.01), and the ranges of D (−190–+20‰) and 18O (−24–+2.0‰) were provided. A series of studies were also made in different parts of China during the 1980s. Based on 78 samples collected over the eastern part of the TP, a depletion gradient of −0.26‰/100 m was found for variations in 18O with elevation (Yu et al., Citation1980). In Beijing, enrichment (April and May) or depletion (June to August) of precipitation isotopes was found, which were due to the evaporation of raindrops or the continental effect, respectively (Wei et al., Citation1982). The main characteristics of isotopes have also been explored for the Eastern Monsoon Region (EMR) of China, with a strong correlation having been identified between isotope and latitude (approximately −0.24‰/°) for stations with altitude ranges between 300±100 m (Yu et al., Citation1987).
Since the mid-1980s, China has had 31 stations successfully participating in the GNIP. Site-specific, continuous observations have been carried out. The accumulated data provide possibilities for comparing precipitation isotopic compositions in China with global levels. Based on the data from the 1980s to 1990s, MWL was revised and the spatial distributions of precipitation isotopes were depicted. The influence of the monsoon on the isotopic composition (Wei and Lin, Citation1994) and correlations between isotopes and meteorological variables were also discussed at station scales (Liu et al., Citation1997a, Citation1997b; Zhang and Yao, Citation1998; Johnson and Ingram, Citation2004). However, most of the Chinese GNIP stations suspended observations after the mid-1990s for various reasons. Until the early 2000s, there were only six stations (Hong Kong, Wulumuqi, Zhangye, Shijiazhuang, Tianjin and Kunming) that continued to observe. The discontinuous data, to a large extent, hindered the application of isotope tools in China. China is located in the Asian monsoon region. The stable isotopes are highly complex due to distinct circulation changes during winter and summer periods. It is necessary to determine the relative importance of each effect in different parts of China (Johnson and Ingram, Citation2004). Additionally, the interpretation of proxy records also relies on our understanding of stable isotope variations in modern precipitation in China. Therefore, to continue systematic observations nationwide, in 2004, the Chinese Network of Isotopes in Precipitation (CHNIP) was established based on the Chinese Ecosystem Research Network (CERN) stations (Song et al., Citation2007). From 2005 to 2010, a total of 928 groups of monthly precipitation samples were collected at 29 CHNIP stations. A detailed review of the accumulated data is presented in the current study, with the aim of answering the following questions: (1) what are the basic characteristics of precipitation D and 18O and their temporal and spatial distributions across China; (2) how could the water vapour source conditions and the intensity of evaporation of falling raindrops be indicated by those establish MWLs; (3) what are the major environmental controls of 18O at each station? Are these factors similar in the same region? The results of this study could provide basic input isotopic information for on-going investigations in hydrology (groundwater recharge, interactions between surface water and groundwater), meteorology and climatology (e.g. moisture origins and transport pathways, characteristics of the Asian monsoon, validation of the Global Circulation Models), palaeoclimatology (climate change, reconstructions of the historical climate based on proxies) and ecology (water balance in ecosystem, evapotranspiration and water use efficiency of plants) in different regions of China.
2. Data and methods
2.1. The CHNIP isotope and meteorological data
The CHNIP includes 29 stations that represent different geographical and climatic regions. Stations located in the northeastern (NE), northern (NC) and southern (SC) regions represent the Eastern Monsoon climate. Stations locate in the northwestern (NW) and southwestern regions stand for the arid/semiarid and the TP climates, respectively (a). Monthly composite precipitation samples were collected from 2005 to 2010. Most stations lack observations in 2008, mainly due to the extreme events of the snow disaster that occurred in the early part of the year and the Wenchuan earthquake, which occurred in the middle of the year, causing difficulties in routine observation. The sampling method is as follows: a rain collector is placed outside, which is composed by a Polyethylene bottle and a funnel. A Ping-Pong ball is placed at the funnel mouth to prevent evaporation during rainfall. After each rainfall event, rainwater is collected and immediately transferred to a bottle, sealed and stored indoors below 4°C. Snow samples are collected using a pail that has been installed on the ground. After each snowfall event, snow samples melt at room temperature. At the end of the month, all collected water is well mixed, then serving as a monthly composite sample. Isotopic measurements are carried out at the IGSNRR's (Institute of Geographic Sciences and Natural Resources Research, Chinese Academy of Sciences) Environmental Isotope Laboratory, using a Finnigan MAT253 mass spectrometer and the Temperature Conversion Elemental Analyzer (TC/EA) method for 18O and D content. The results are expressed as δ-values, which are relative to V-SMOW (Vienna Standard Mean Ocean Water) on a normalised scale; δ (‰)=(Rsample − Rstandard)/Rstandard×1000, where R refers to the 18O/16O or 2H/1H ratio. The measurement accuracy is consistently ±1‰ for δD and ±0.3‰ for δ18O, respectively.
Fig. 1 Locations of (a) CHNIP stations and (b) GNIP stations.
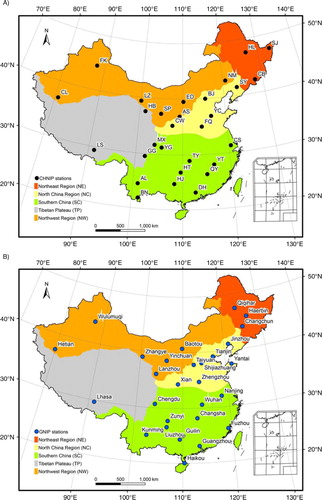
Meteorological variables, including the precipitation amount (P, mm), temperature (T, °C), relative humidity (RH, %), water vapour pressure (Wp, kPa), vapour pressure (Vp, hPa), sunshine duration (S, h), wind speed (Ws, m/s) and wind direction (Wd, °), are observed at each observation station. All the meteorological data are collected and compiled by the CERN Synthesis Centre.
2.2. The GNIP isotope and meteorological data
The other isotopic dataset is obtained from the ISOtopic Hydrology Information System (ISOHIS)-GNIP database (http://isohis.iaea.org). China has 31 stations that participate in the GNIP (b). Two stations are not considered in the current study: the Chongqing station, which has only 5 months of δ18O data, and the Hong Kong station, for which the observation period (1961–2009) is much longer than it is for the other GNIP stations. Observation periods vary among the 29 stations, most of which are during the mid-1980s–1990s. As the locations of the GNIP stations are generally identical to Chinese meteorological observation sites, the missing or incomplete meteorological data are replaced and collected from the China Meteorological Data Sharing Service System (CMDSSS, http://cdc.cma.gov.cn/home.do).
3. Results and discussion
3.1. Fundamental isotopic characteristics of the CHNIP stations
Descriptive statistical information for the CHNIP stations is depicted in . The ranges of δD and δ18O generally follow the pattern of NE>NW>TP>NC>SC, which indicates that the inner continental stations and the coastal stations have large or small δ-ranges, respectively. The BN station, which is located in the far south of China and close to the oceanic vapour origin, has the smallest ranges of both δD (−68.4–−21.8‰) and δ18O (−9.74–−3.44‰). The LS (at TP) and CB (at NE) stations have the largest ranges for δD (−169.9–+38.5‰) and δ18O (−22.33–+3.10‰), respectively. The LZ station has the largest standard deviations in both δD and δ18O, while the BN and CS stations have the smallest δD and δ18O standard deviations, respectively.
Table 1. Descriptive statistics of precipitation isotope values of CHNIP stations
The weighted δDp and δ18Op values in precipitation follow the pattern of SC>NW>NC>TP>NE. The precipitation moisture arises primarily from a well-mixed source (i.e. South China Sea, the Pacific and Indian Ocean) and undergoes progressive rainout of heavy isotopes during the subsequent pole-ward atmospheric transport. These effects cause a general shift towards lower δD and δ18O contents from coastal to inland areas (continental effect) and with increasing latitude (latitude effect) or altitude (altitude effect). Most SC and NW stations have relatively higher δp values; however, the mechanisms behind them are not the same: the SC region is located close to the oceanic vapour origins and under the control of moist maritime air masses (Liu et al., Citation2008). The vapour, on the other hand, undertakes a relatively short journey from the evaporation origins to the precipitation sites, which results in a smaller loss of 18O and D and therefore relatively high δp values. By contrast, the NW region is located inland and is under the control of dry continental polar air masses. The oceanic water vapour that was carried by the summer monsoon can hardly arrive here. Thus, a substantial part of the precipitation is from local recycled vapour. The δ-values for surface water bodies are rather high in the arid regions, which means that the vapour evaporates from them is also high in isotope content (Zhang and Yao, Citation1998; Liu et al., Citation2009; Pang et al., Citation2011). Additionally, the partial evaporation of falling raindrops through the dry atmosphere beneath the cloud further aggravates the depletion of light isotopes. Although some of the δ-values during winter may be quite low, the precipitation amount is very small. When weighted by precipitation amount, however, the δp values are still high. The highest values (−4.24‰, −1.47‰) are found at the CL station, where it is very dry, with only 51 mm annual precipitation. Lower δp values are found in the NE and TP regions. With the air masses proceeding from the vapour origins to higher latitudes and inland areas, the 18O and D of the residual vapour continuously deplete. The decreasing trends in δp from south to north and from east to west reflect a combination of the latitude and continent effects. In the TP region, in addition to these two effects, the depletion of 18O and D is further augmented by cooler average temperatures that cause increased fractionation (altitude effect). Stations located in the southern TP region have lower δp values than do the stations that are located in the northern TP region. Water vapour for the southern part of the plateau is mainly from the Bay of Bengal and the Arabian Sea. When the vapour climbs the high Himalayas, a large amount of precipitation is generated, resulting in the heavy isotope depletion of the residue vapour. As a result, the LS station (3688 m) has the lowest δp values (−110.93‰, −15.02‰). At the northern part of the plateau, as it is under the influence of the recycled water vapour, the precipitation carries higher isotope values.
3.2. Seasonal variations of the precipitation isotopes
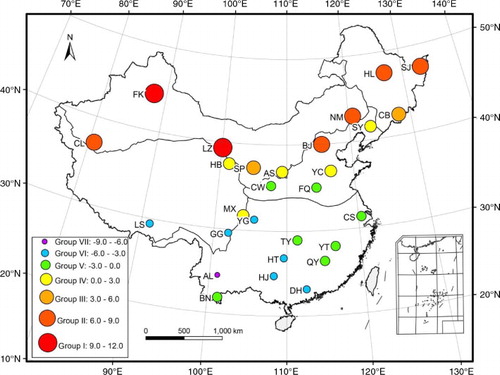
Dansgaard (Citation1964) used values of (δs–δw) to detect the seasonal variations in the isotopes and the potential contribution of the surface air temperature and the precipitation amounts. The δs and δw values denote the un-weighted means of the summer (May–Oct.) and winter months (Nov.–Apr.), respectively. Calculations of (δs–δw) were made for each station (). Stations with (δs–δw)>3, which indicates that the δ-values for the summer months are higher than those of winter months, all have the inner continental climate. The seasonal variations of the surface temperature are very distinct, approximately 30°C for group II (6<(δs–δw)<9, CL, NM, BJ, HL and SJ) and group III stations (3<(δs–δw)<6, SP and CB) and more than 40°C for group I (9<(δs–δw)<12, FK and LZ). Some of these stations have very dry seasons. The positive values of (δs–δw) reflect the contribution of the temperature. Except for BN, stations of group IV and V (0<∣δs–δw∣<3) are generally located in the middle and southeastern parts of China. Some stations in group IV have relatively dry summers. Both precipitation amount and temperature may contribute to the relatively small values of (δs–δw). Stations with −9<(δs–δw)<−3 are located at the southern and southwestern part with latitude lower than 30°N, which have rainy summers and relatively dry winters. The negative (δs–δw) values are mainly due to the contributions of precipitation amounts.
Fig. 2 Distributions of (δs–δw) values. The δs and δw denote the un-weighted means of the summer (May–Oct.) and winter months (Nov.–Apr.), respectively. Group I, II and III all belong to the inner continental climate, indicating a major temperature contribution to the δ18O variation. Group IV and V are generally located in the middle and southeastern parts of China, and both the precipitation and temperature may contribute to the small (δs–δw) values. Group VI and VII distribute to latitude <30°N, and with a precipitation contribution.
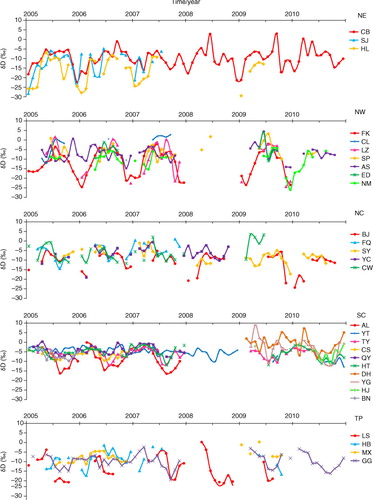
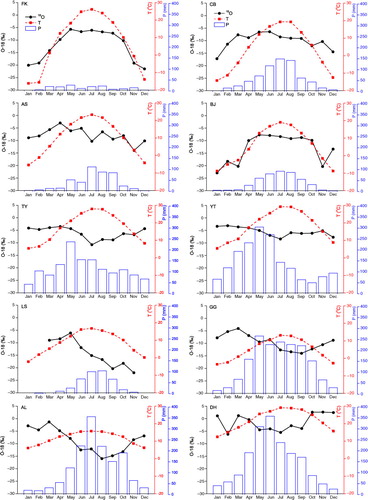
Temporal variations of δ18O during 2005 and 2006 have been discussed for the Arid Northwestern Region (ANR; Liu et al., Citation2009) and the EMR (Liu et al., Citation2010a). Temporal variations of δ18O between 2005 and 2010 are depicted in . Large, small and mediate seasonal fluctuations of δ18O are found at the northern (NW and NE), southern (SC) and transition regions (NC), respectively. Though there are differences in both of the magnitude of the annual cycle and the response to the inner-annual variations in climate during the whole observation period, the annual variations of δ18O mainly present ‘V’-shaped pattern in the SC region and reverse ‘V’-shaped patterns in the NE and NW regions. At the inner continental NW and NE, the δ18O are higher during warm periods while lower during cold periods. Particularly, at those NW stations with a relatively small annual precipitation amount, the summer δ18O values are quite high. At SC, the δ18O values are lower during the rainy seasons. Decreasing trends of δ18O with the advent of the rainy season are distinguishable at some NC and TP stations (e.g. the LS and CW stations), though the overall seasonal patterns of δ18O are not clear.
Fig. 3 Temporal variations of δ18O during 2005–2010. Large, small and mediate seasonal fluctuations of δ18O are found in the northern (NW and NE), southern (SC) and NC regions, respectively. A ‘V’-shaped δ18O pattern is found at SC, while a reverse ‘V’-shaped pattern is found at NE and NW.
3.3. Local MWL
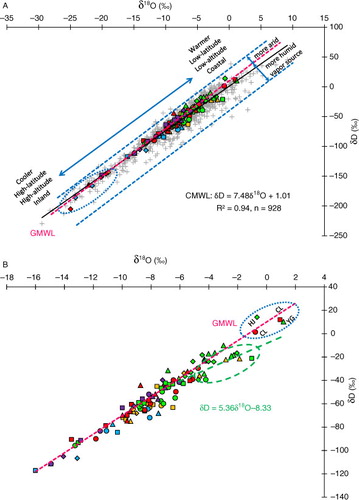
Isotopic ratios of D/H and 18O/16O in precipitation are closely related, lying on a single line known as the MWL. The best-fit local MWL (LMWL) drawn through these clusters can provide isotopic input functions for hydrological studies, such as identifying surface water and groundwater sources as well as evaporation effects. Based on the 928 groups of precipitation, a Chinese Meteoric Water Line (CMWL) is established as δD=7.48δ18O+1.01 (a). The slope is slightly lower than the global average of 8 (GMWL: Craig, Citation1961) but slightly higher than those of δD=7.46δ18O+0.90 (n=274) and δD=7.42δ18O+1.38 (n=95), achieved at EMR and ANR, based on the data collected between 2005 and 2006. Deviations from GMWL often occur because of the humidity differences at the vapour source or source of evaporation. China is located in the Asian monsoon region, which experiences the most distinct variation in its annual cycle and the alternation of dry and wet seasons. This alternation is in concert with the seasonal reversal of the monsoon circulation features (Webster et al., Citation1998). In the winter, air masses develop over high-latitudinal Siberia, which is extremely cold and dry. Conversely, warm and moist air masses penetrate the continent in summer, carrying abundant moisture from the Indian Ocean and the Pacific Oceans (Tao and Chen, Citation1987). As most of the annual precipitation is concentrated during the summer monsoon period, the majority of the δD-δ18O scatters, distributing below the GMWL indicate humid vapour sources. Seasonal changes typically produce shifts along the GWML, accounting for the extended range of observed isotope compositions. To illustrate this more explicitly, the seasonally amount-weighted δ-values (δs) are plotted for reference. All of the SC samples lie along the upper end of the line, while the TP, NW and NE samples are along the mid and lower end. Scattered data points that are located in the left lower circle are autumn or winter samples, including one TP (LS), one NC (BJ), two NE (HL and SJ), three NW (FK, LZ and NM) points, which correspond to cooler, high-latitude, high-altitude and inland vapour origins. Except for two NW samples, scatters located at the upper end are mainly from the SC region, indicating warmer, low-latitude, low-altitude and coastal vapour origins. The two rather enriched CL samples located in the upper blue circle (b) are the result of the evaporation of raindrops or mixing with local recycled moisture. Furthermore, the spring samples from the SC and NC regions, distributed in the green circle, are also enriched, forming an evaporation line of δD=5.36δ18O–8.33. These higher isotope values can be mainly ascribed to the evaporation from falling raindrops through the dry atmosphere during the pre-summer monsoon periods.
Fig. 4 Linear δD–δ18O relationships (CMWL) based on all the CHNIP precipitation measurements from 2005 to 2010 (grey crosses). Seasonal amount weighted δ-values (triangle–spring, circle–summer, rectangle–autumn and diamond–winter) of different regions (blue–NE, yellow–NC, green–SC, red–NW and purple–TP) are also given for reference. The arrows indicate potential vapour source conditions (McGuire and McDonnell, Citation2007).
The LMWLs have also been calculated for individual stations to study their fit in a large pattern over a country-wide scale. According to the slopes and intercepts (), the LMWLs can generally be grouped into four types: (1) All samples stay relatively close together, with slope≈8. This group includes the HT, BN and AL stations, with locations all in SC and under the strongest influence of the Asian monsoon. The AL and BN stations are also situated close to the landing area of the South Asian monsoon. (2) The δ-ranges are wider than group I, with linear correlations of 7<slope<8. The wider δ-ranges are caused by considerable seasonal temperature variations and relatively low condensation temperature. All of the NW and TP stations, as well as the SJ, HL, BJ and QY stations, belong to this group. Except for the QY station, all the others have a mid-latitude continental climate. Relatively lower δ-values are present during cold seasons and are along the lines with slope≈8, while higher δ-values are present during warm seasons, especially during late spring and summer, along the lines with slope<8. The fast evaporation of the falling raindrops in the relatively dry climate may account for the slope decrease. Three NW stations (SP, ED and AS) with mean annual precipitation of only 126, 279 and 460 mm, respectively, have slopes≈7. (3) Slope<7. Stations belonging to this type can be divided into two subgroups: (1) The YT and DH stations. They are located at the southeastern coast, which is the source of the monsoon vapour (South China Sea monsoon and the Subtropical monsoon). The net evaporation is extremely high, and the vapour cannot be expected to be in equilibrium with the ocean water (Dansgaard, Citation1964). (2) The CB, SY, CW, FQ and YG stations. All of these stations are located at the 30°–45°N continental inlands, and three of them belong to the NC region. Stations in this category mainly have periodic dry periods with very sparse rainfall, except after the summer monsoon. During the dry period, the precipitation is usually very light and cannot saturate the vapour below the cloud. The low humidity of the air causes a great loss of liquid material and considerable enrichment of the rain (Dansgaard, Citation1964). The non-equilibrium evaporation from the falling raindrops during this period most likely accounts for the low slope. (4) Slope>8. Three SC stations (HJ, TY and CS) are of this type. The condensation of water vapour is under non-equilibrium (e.g. over-saturation); the relatively high fractionation rate of the light isotope would offset the preferential condensation effect of the heavy isotopes, leading to a smaller fractionation factor during the fast evaporation processes than that during the equilibrium conditions (Zhang and Yao, Citation1994).
The theoretical slope of LMWL (ST) can be calculated based on the condensation temperature, which is usually represented by the surface temperature (Criss, Citation1999):1
where α2 and α18 are temperature dependent (Friedman and O'Neil, Citation1977; Criss, Citation1999):2
3
The results show that, except for the CS, TY and HJ stations, the measured slopes are generally lower than the theoretical-ST values (). The deviation of measured slopes from the expectations suggests that most of the precipitation has undergone raindrop evaporation effect (Clark and Fritz, Citation1997; Araguás-Araguás et al., Citation1998; Peng et al., Citation2010). The stations with the largest deviations appear in groups III (1.73–2.45) and II (0.26–1.80). The greater the deviation, the higher evaporation intensity it may indicate.
3.4. Correlations between δ18O and environmental variables
3.4.1. Temperature and amount effect of δ18O
Linear correlation coefficients between δ18O and T (or P) are calculated for each station (). In the NE and NW (except the AS and ED stations) regions, the variations of δ18O show a strong dependence on T, while variations of δ18O, for GG, AS and some SC stations (TY, HT, DH and AL), show dependence on P. The δ/T coefficients for the NW stations are generally more significant than those for the NE stations. The δ/T coefficients for stations with (δs–δw)>3 are all significant, which confirms the contribution of temperature to the seasonal isotope variations. The δ/T gradient is 0.27 and 0.37‰/°C for NE and NW regions, respectively, which seem to be smaller than the 0.55‰/°C gradient that was achieved at mid- to high-latitudes (Rozanski et al., Citation1993) or the 0.69‰/°C, which was achieved at much wider temperature ranges, including North Atlantic coastal stations and Greenland ice cap stations (Dansgaard, Citation1964). The maximum gradient (0.58‰/°C) is found at the CL and LZ stations. The δ/T coefficients at SC, NC (except BJ) and TP (except HB) regions are not significant, which agrees with the findings that between 45°N and 45°S, the δ/T relationship is significantly weaker than that at higher latitudes, due to the greater degree of water vapour recycling in this region (Hendricks et al., Citation2000). At TP, the δ/T (r=0.430, p≤0.1) and δ/P (r=−0.496, p≤0.05) are significant at HB and GG, respectively, which confirms the previous findings that the temperature effect only occurs in the north of the TP, while the δ18O follows the amount effect in the middle and southern part (Zhang et al., Citation1995; Yao et al., Citation1999; Tian et al., Citation2003). The δ/P gradient for the SC region varies from −0.62‰/100 mm at the TY station to −2.07‰/100 mm at the AL station.
Previous investigation shows that the seasonal march of the East Asian summer monsoon displays a distinct stepwise northward and northeastward advance, with two abrupt northward jumps and three stationary periods. It typically commences in mid-May with the rainy season first appearing over South China and the East China Sea. Then, it extends abruptly to the Yangtze River Basin in early to mid-June and finally penetrates to North China and the tropical western West Pacific. After the onset of the Asian summer monsoon, the moisture transport coming from the Indochina Peninsula and the South China Sea plays a crucial ‘switch’ role in the moisture supply for the precipitation in East Asia (Qian et al., Citation2002; Ding and Chan, Citation2005). To illustrate the response of δ18O to different precipitation patterns, 10 representative stations are selected (). The monthly rainfall amounts at DH, TY, YT and GG present abruptly increases in May, demonstrating the onset of the Asian summer monsoon. During the monsoon's most active period, most of the annual rainfall is concentrated in a range of 3 months (June to August), and the δ18O composition presents a trend of continuous depletion. However, not all of the most depleted δ18O values are in correspondence with the heaviest rainfall; rather, there exist certain delays. At the DH and AL stations, maximum rainfall appears in June and July, respectively, but the minimum δ18O values appear 1 month later. There is a similar delayed response of about 2 months at stations TY and YT station. With the monsoon entering its mature phase, the land gets wetter. Vapour evaporates from the surface such as lakes, rivers, wet soils and vegetation is much more isotopically depleted, compared with the previously monsoon-affected vapour. Therefore, the subsequent precipitation, which mixes with the recycled water vapour, is the lowest in δ18O.
Fig. 5 Seasonal variations of δ18O (precipitation amount weighted), temperature and precipitation amount (averages during the respective observation period) for the 10 selected CHNIP stations. The seasonal effect is more pronounced for continental sites with strong temperature variations.
In addition to the delayed response, the extreme complexity of the isotopic turnover in the processing of convective rain, a main form of precipitation during summer is most likely another contributing factor to weakening the effects of the isotope. In the processes of convective rain, the air moves in a vertical direction and the condensate forms at any stage fall down through all the foregoing ones. Thereby, it is mixed with the droplets and takes up new vapour at lower stages. Additionally, further complications are added by the process of exchange in the clouds (Dansgaard, Citation1964). In China, rain and heat typically occur together. During the summer monsoon period, evaporation from the surface is strongest. Therefore, as the droplets fall to the ground, processes of exchange and evaporation further complicate the amount effect.
The Asian summer monsoon finally penetrates North China in July, and the rainy season lasts until September. During this period, the δ18O values for CB and BJ are rather high, and there is a slightly declining trend of δ18O. Therefore, although the δ/P value may not be significant on a whole-year scale, the amount effect is still not negligible during the monsoon period. The highest δ18O value appears in May for BJ, when evaporation is highest before the arrival of the summer monsoon. Evaporation of the falling raindrops, with the addition that the amount effect has yet been activated, leads to the relatively high values of δ18O. As for the two TP stations, both LS and GG have a distinct declining trend in δ18O during the rainy season. The declining trend is larger for LS, as it has a higher altitude (3688 m) and an inner continental location. The additional altitude effect and longer moisture transport pathway result in additional fractionation and a loss of D and 18O. For the AS station, which is located at the edge of the monsoon region and the transition zone, the co-variations of δ18O with temperature or precipitation are less clear. During the summer monsoon period, the temperature and rainfall are both high, which leads to the temperature and amount effects partially cancelling each other out (Johnson and Ingram, Citation2004).
3.4.2. Meteorological controls of δ18O
From the simple linear correlations of δ/T and δ/P, the δ18O variations for the NC (except BJ) and SC regions (except TY, HT, DH and AL) are generally not influenced by either temperature or precipitation amount. To detect the meteorological controls for these NC and SC stations and whether there are variables besides temperature that may co-control the δ18O in the NE and NW regions, regularly observed surface meteorological variables are measured and collected, including RH, Wp, Vp, S, Ws and Wd. Stepwise regressions are used to select a subset of predictors that significantly affect the δ18O values. Potential bivariate correlations between δ18O and these meteorological variables, including linear, logarithmic, power, quadratic and exponential, are calculated to determine which forms should be presented in the regression models. A 0.05 or 0.1 significant level is used (F-distribution probability theory) for selecting variables (Liu et al., Citation2010b, Citation2011).
Remarkable influential factors are selected for the regression models at each station (). In the NE and NW regions, all of the stations select T as a dominant control factor of δ18O, which confirms that temperature plays an absolutely vital role in isotope abundance at mid-to-high latitudinal inland areas. At the SJ, HL, LZ and NM stations, T is also found to be the only factor that affects the δ18O value. In addition to temperature, some other variables such as RH, Vp, Wd and P are also found to be critically influential for different NW stations. Regressions for stations HL and NM could explain over 50% of δ18O variations, and regressions for stations FK, CL and LZ could explain approximately 80% of the δ18O variations. In SC, except for the CS, TY, HJ and BN stations, all stations select Vp (in logarithmic form) and/or Wp (in quadratic form). If the vapour condensation proceeds under the Rayleigh conditions (i.e. a slow process with immediate removal of the condensate from the vapour after formation), δc for the liquid or solid phase can be expressed as , where Fv refers to the remaining fraction of the vapour phase, and α, α0 and αm refer to the fractionation factors at the momentary condensation temperature t, the initial temperature t0 and to (t+t0)/2, respectively (Dansgaard, Citation1961). In SC, the condensation can be approximated as isothermal condensation, where α=α0=αm; thus, the δc value appears to be mostly dependent on Fv. This is likely the reason that, instead of P, most regression analyses selected the Wp, a measurement of moisture content in the atmosphere. It also explains that the amount effect is not found to be significant at most SC stations. The isotopic abundance may depend more on how much the water vapour contains in the atmosphere rather than the total amount of precipitation that is generated. Except for TY, QY, DH and BN, regressions for other SC stations could capture approximately 40–70% of δ18O variations. Regressions for the BN and DH stations can explain approximately 35% δ18O variations, and one of the probable reasons for the less ideal regression relationships are their short observation time, which is only 1 and 2 yr, respectively.
Table 2. Stepwise regression models for CHNIP stations
In NC, rather than T or P, the δ18O is more closely related to Wd (SY and YC), RH (CW and FQ) or Vp (CW), and most models are able to predict 20% δ18O variations. Compared with the NE and NW results, the correlation coefficients achieved for the NC stations seem to be relatively low. One reason for this is the remarkable evaporation of the falling raindrops, which has been indicated by three out of five of the NC stations having low slopes (≈6) for their LMWLs. Correlations between isotope content and meteorological variables may be cancelled by the evaporation effect. Another reason is that the air masses influencing the precipitation are more complicated in NC than in other regions. For example, in Beijing, a former study has asserted that there are at least six different types of air masses influencing its summer precipitation events (Liu et al., Citation2011). Each type of air mass has distinct meteorological characteristics (e.g. origins, paths, humidity or velocity). However, the samples we collected here are monthly composite ones, which generally reflect the average meteorological conditions of all precipitation events within the month. Therefore, the correlations between the isotopes and their control factors, which are significantly presented in event-based precipitation, to a great extent are smoothed out in the monthly samples. As for the TP stations, the equations are formed by different variables, such as the Ws for LS, T for HB, Wd and RH for MX, while Wp and RH for GG. The R2 for the regressions varies from 0.15 to 0.55.
From the mid-1980s to the 1990s, a series of stations in China participated in GNIP. Although most of the locations of these stations are not identical with the CHNIP stations, they also have representative significance of different climatic zones of China. Therefore, their isotope data and the corresponding meteorological data are collected to select dominant control factors and make comparisons with the CHNIP results. Except for the Haerbin and Baotou stations, all NE and NW regressions select T as the primary control factor (). Except for Guangzhou and Kunming stations, all SC regressions select Wp2 and/or log Vp as their primary control factor. Most models could thus predict the δ18O values well, with the R2 values varying from 0.4 to 0.8. Regressions for NE, NW and SC regions, including both the variables and the R2, are found to be identical with the CHNIP results. In NC, the RH (either in linear or quadratic form) is a dominant control factor for δ18O in three out of the five regressions (Tianjin, Yantai and Xi'an). However, except for Tianjin (R2=0.613), equations for the other four stations capture less than 30% of the δ18O variations. There is only one station (Lhasa) that belongs to the TP region. With only vapour pressure being represented, the regression account for approximately 28.3% of δ18O variations. The Lhasa (GNIP, 91.13°E, 29.7°N, 3649 m) and LS stations (CHNIP, 91.21°E, 29.41°N, 3688 m) are geographically close to each other; however, the dominant control factor that is selected by regression is different for these two stations. This may be related to the different climate conditions during the respective observation periods, namely, 1986–1992 for Lhasa, and 2005–2009 for LS.
Table 3. Stepwise regression models for GNIP stations
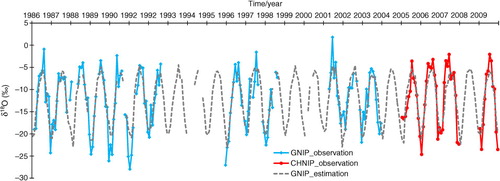
According to the above results, regression models established for three groups of NW stations, namely, FK and Wulumuqi, CL and Hetian, and LZ and Zhangye, which are geographically close, capture more than 70% δ18O variations. In particular, regressions for CL and Hetian select the same variables (T2, Wd2 and Vp), which indicates that the control factors and fractionation mechanisms for δ18O are similar before and after 2000s. The Wulumuqi station, with the observation period spanning from 1986 to 2003, exhibited a δ18O time series that is among the longest and most systematic GNIP datasets for China. Based on the established model (δ18O=−14.101+0.428T–0.146Wd), and the corresponding temperature and wind direction data, monthly δ18O time series for the period of 1986–2009 could be reconstructed and estimated. The results clearly depict the seasonal cycle of δ18O, except for some values during extreme cold or hot months (). Furthermore, the calculated δ18O values for most spring and autumn seasons are very close to the observations. This demonstrates that basic fractionation mechanisms can be reflected by the established model. Therefore, the selected control factors and established regressions can potentially be used as a proxy of a historic environment.
Fig. 6 Reconstruction of monthly δ18O time series for the period of 1986–2009, based on the regression model established for Wulumuqi station (δ18O=−14.101+0.428T−0.146Wd). With the exception of a few values during extreme cold and hot months, the reconstructions depict the seasonal cycle of δ18O. The calculated δ18O values for most spring and autumn seasons are very close to the observations.
3.4.3. Geographical controls on δ18O
In addition to the influence of meteorological variables on diverse isotopic compositions, each station's unique geographic situation also means that each will be vulnerable to different geographical controls. The CHNIP stations are distributed between 20°N and 50°N in latitude and 80°E to 140°E in longitude. The stations’ altitudes range from less than 10 m on the eastern plain to over 3000 m on the TP. To quantitatively describe the geographical controls, we establish regressions composed of latitude, longitude and altitude. On a whole-country scale, the model is expressed as δ18O (‰)=8.892–0.041Lon (°)–0.312Lat (°)–0.002Alt (m), which indicates that the variations in δ18O depend on both the station's location and elevation. Partial correlation coefficients for latitude, altitude and longitude are −0.369 (p≤0.05), −0.190 (p≤0.05) and −0.040, respectively, which demonstrates that the latitude effect is most significant. The decreasing gradient for δ18O vs. Lat is −0.22‰/°, meaning that the precipitation δ18O value depletes approximately 0.22‰ for every one degree northward in latitude. The change in height is about −0.13‰/100 m, which is comparable with the rate found as −0.17 to −0.22‰/100 m for Taiwan, China (Peng et al., Citation2010). The δ18O/Alt gradient is also within the ranges found in other countries, e.g. −0.14‰/100 m for Syria (Kattan, Citation2006), −0.1 to −0.6‰/100 m for Argentina (Vogel et al., Citation1975), −0.09 to −0.25‰/100 m for Switzerland (Siegenthaler and Oeschger, Citation1980), −0.18‰/100 m for Colombia (Saylor et al., Citation2009), −0.2‰/100 m for Mexico (Cortés et al., Citation1997) and −1‰/100 m for Chile (Aravena et al., Citation1999).
Latitude and altitude are both important geographical controls for EMR, e.g. NE: δ18O=133.460–3.069Lat–0.018Alt, NC: δ18O=18.334–0.651Lat–0.002Alt and SC: δ18O=3.296–0.285Lat–0.002Alt. Only latitude is important for the NW region (δ18O=25.731–0.856Lat). The δ18O/Lat gradients are relatively large at continental inland areas (−0.59‰/° for NE and −0.57‰/° for NW) and the TP (−0.57‰/°). In EMR, the δ18O/Lat gradients increase from south to north (−0.05‰/° for SC and −0.33‰/° for NC). A gradient of −0.24‰/° was found for EMR in a former study (Yu et al., Citation1987), which is within the range of the current study. The altitude effect is especially significant for the TP region, with the δ18O depleting 0.3‰ as the elevation increases every 100 m. This gradient is slightly higher than that (−0.26‰/100 m) found for the eastern TP area (Yu et al., Citation1980).
4. Summary and conclusions
Based on the stable D and 18O values in the precipitation that was collected from 2005 to 2010 at 29 CHNIP stations, this study has analysed their major characteristics and their relationships with meteorological variables. The inner continental and coastal stations have larger or smaller δ-ranges, respectively, and generally follow the NE>NW>TP>NC>SC pattern. The amount-weighted δ-values follow the SC>NW>NC>TP>NE pattern. The spatial distribution of δ-values is a result of both temperature and continental effect. Temporal variations of δ18O mainly present as a ‘V’-shaped pattern at SC and a reverse ‘V’-shaped pattern at NE and NW. At NC and TP, δ18O decreases with the coming of the rainy season. The CMWL is established as δD=7.48δ18O+1.01, with the SC or TP, NW and NE samples being distributed to the upper or lower end of the line, respectively, indicating different water vapour origins and characteristics. The δ18O values are strongly reactive to temperature at the NE and NW stations, with δ18O/T gradients of 0.27 and 0.37‰/°C, respectively. At SC, the δ18O value depends on water vapour pressure and vapour pressure, which indicates that isotopic abundance depends on atmospheric water vapour content rather than precipitation amount. As for the NC stations, wind speed, relative humidity and vapour pressure are more important controls for δ18O. The established regressions and selected variables are potentially useful for the historical climate reconstructions. At a whole-country scale, the gradients of δ18O/Lat and δ18O/Alt are −0.22‰/° and −0.13‰/100 m, respectively. The δ18O/Lat gradient increases from south to north (−0.05‰/°→−0.33‰/°→−0.59‰/°) for EMR and is relatively large (−0.57‰/°) for NW and TP. The altitude effect is especially significant for TP, with a gradient of −0.30‰/100 m.
5. Acknowledgements
This work was supported by the National ‘973 Program’ of China (No.2010CB428805), the State Key Program of National Natural Science Foundation of China (40830636) and the Field Station Foundation of Chinese Academy of Sciences. The authors would like to thank the Synthesis Centre of CERN and CMDSSS for providing the meteorological data. Sincere appreciation is also extended to all of the CHNIP site operators who contribute the monthly data collections. We also would like to thank Prof. Jinrong Yang, Dr. Xin Liu, Lei Cao and Jingjing Yuan for assisting with isotopic analysis, mass spectrometer maintenance, data synthesis and sample preparation. The authors are very grateful to the anonymous reviewers for their constructive comments in greatly improving our manuscript.
Related Research Data
References
- Araguás-Araguás L. , Froehlich K. , Rozanski K . Stable isotope composition of precipitation over southeast Asia. J. Geophys. Res. 1998; 103(D22): 28721–28742.
- Aravena R. , Suzuki O. , Pena H. , Pollastri A. , Fuenzalida H. , co-authors . Isotopic composition and origin of the precipitation in Northern Chile. Appl. Geochem. 1999; 14: 411–422.
- Bowen G. J. , Revenaugh J . Interpolating the isotopic composition of modern meteoric precipitation. Water Resour. Res. 2003; 39(10): 1299.
- Clark I. , Fritz P . Environmental Isotopes in Hydrogeology. 1997; New York.: Lewis Publishers.
- Cortés A. , Durazo J. , Farvolden R. N . Studies of isotopic hydrology of the basin of Mexico and vicinity: annotated bibliography and interpretation. J. Hydrol. 1997; 198: 346–376.
- Craig H . Isotopic variations in meteoric waters. Science. 1961; 133: 1702–1703.
- Criss R. E . Principles of Stable Isotope Distribution. 1999; New York: Oxford University Press. 89–138.
- Dansgaard W . The isotopic composition of natural waters. Medd. Om Grønland. 1961; 165(2): 1–120.
- Dansgaard W . Stable isotopes in precipitation. Tellus. 1964; 16: 438–468.
- Ding Y. , Chan J. C. L . The East Asian summer monsoon: an overview. Meteorol. Atmos. Phys. 2005; 89: 117–142.
- Friedman I., O'Neil J. R.Fleischer M. Compilation of stable isotope fractionation factor of geochemical interest. Data of Geochemistry 6th. 1977; Washington, DC: U.S. Government Printing Office.440.
- Gibson J. J. , Edwards T. W. D. , Birks S. J. , St Amour N. A. , Buhay W. M. , co-authors . Progress in isotope tracer hydrology in Canada. Hydrol. Process. 2005; 19: 303–327.
- Gonfiantin R . Causse C. , Gasse F . On the isotopic composition of precipitation. International Symposium in memory of J. Ch. Fontes. 1998; Paris: Orstom. 3–22. June 1995.
- Hendricks M. B. , DePaolo D. J. , Cohen R. C . Space and time variation of delta (super 18) O and delta D in precipitation; can paleotemperature be estimated from ice cores?. Glob. Biogeochem. Cycle. 2000; 14: 851–861.
- IAEA. Isotope hydrology information system, the ISOHIS database. 2013. Online at: http://isohis.iaea.org.
- Johnson K. R. , Ingram B. L . Spatial and temporal variability in the stable isotope systematics of modern precipitation in China: implications for paleoclimate reconstructions. Earth Planet. Sci. Lett. 2004; 220: 365–377.
- Kattan Z . Characterization of surface water and groundwater in the Damascus Ghotta basin: hydrochemical and environmental isotopes approaches. Environ. Geol. 2006; 51: 173–201.
- Kralik M. , Papesch W. , Stichler W . Austrian Network of Isotopes in Precipitation (ANIP): quality assurance and climatological phenomenon in one of the oldest and densest networks in the world. Isotope Hydrology and Integrated Water Resources Management. 2003; Vienna, Austria: IAEA. 146–149. 19–23 May.
- Liu J. , Fu G. , Song X. , Charles S. P. , Zhang Y. , co-authors . Stable isotopic compositions in Australian precipitation. J. Geophys. Res. 2010b; 115: D23307.
- Liu J. , Song X. , Fu G. , Liu X. , Zhang Y. , co-authors . Precipitation isotope characteristics and climatic controls at a continental and island site in Northeast Asia. Clim. Res. 2011; 49(1): 29–44.
- Liu J. , Song X. , Sun X. , Yuan G. , Liu X. , co-authors . Isotopic composition of precipitation over Arid Northwestern China and its implications for the water vapour origin. J. Geogr. Sci. 2009; 19: 1641–1674.
- Liu J. , Song X. , Yuan G. , Sun X. , Liu X. , co-authors . Stable isotopes of summer monsoonal precipitation in southern China and the moisture sources evidence from δ18O signature. J. Geogr. Sci. 2008; 18: 155–165.
- Liu J. , Song X. , Yuan G. , Sun X. , Liu X. , co-authors . Characteristics of δ18O in precipitation over Eastern Monsoon China and the water vapour sources. Chinese Sci. Bull. 2010a; 55: 200–211.
- Liu J. , Zhao Y. , Liu E. , Wang D . Discussion on the stable isotope time-space distribution law of China atmospheric precipitation. Site Invest. Sci. Technol. 1997a; 3: 34–39. (in Chinese).
- Liu J. , Zhao Y. , Liu E. , Wang D . Analysis of the chief factors influencing the stability isotope composition of China atmospheric precipitation. Site Invest. Sci. Technol. 1997b; 4: 14–18. (in Chinese).
- McGuire K. , McDonnell J . Michener R. H. , Lajtha K . Stable isotope tracers in watershed hydrology. Stable Isotopes in Ecology and Environmental Science. 2007; Oxford, UK: Blackwell Publishing. 346 pp. 2nd ed.
- Pang Z. , Kong Y. , Froehlich K. , Huang T. , Yuan L. , co-authors . Processes affecting isotopes in precipitation of an arid region. Tellus B. 2011; 63(3): 352–359.
- Peng T.-R. , Wang C.-H. , Huang C.-C. , Fei L.-Y. , Chen C.-T. A. , co-authors . Stable isotopic characteristic of Taiwan's precipitation: a case study of western Pacific monsoon region. Earth Plan. Sci. Lett. 2010; 289: 357–366.
- Qian W. , Kang H. S. , Lee D. K . Distribution of seasonal rainfall in the East Asian monsoon region. Theor. Appl. Climatol. 2002; 73: 151–168.
- Rozanski K. , Araguas-Araguas L. , Gonfiantinni R . Swart P. K. , Lohmann K. C. , McKenzie J . Isotopic patterns in modern global precipitation. Climate Change in Continental Isotopic Records. 1993; Washington, DC: Geophysical Monograph, American Geophysical Union. 1–36.
- Saylor J. E. , Mora A. , Horton B. K. , Nie J . Controls on the isotopic composition of surface water and precipitation in the Northern Andes, Colombian Eastern Cordillera. Geochim. Cosmochim. Acta. 2009; 73: 6999–7018.
- Siegenthaler U. , Oeschger H . Correlation of 18O in precipitation with temperature and altitude. Nature. 1980; 285: 314–317.
- Song X. , Liu J. , Sun X. , Yuan G. , Liu X. , co-authors . Establishment of Chinese Network of Isotopes in Precipitation (CHNIP) based on CERN. Adv. Earth. Sci. 2007; 22(7): 738–747. (in Chinese).
- Tao S. , Chen L . A Review of Recent on the East Asian Summer Monsoon in China. 1987; New York, USA: Monsoon Meteorology, Oxford University Press. 60–92.
- Tian L. , Yao T. , Schuster P. F. , White J. W. C. , Ichiyanagi K. , co-authors . Oxygen-18 concentrations in recent precipitation and ice cores on the Tibetan Plateau. J. Geophys. Res. 2003; 108(D9): 4293–4302.
- Vachon R. W. , White J. W. C. , Gutmann E. , Welker J. M . Amount-weighted annual isotopic (δ18O) values are affected by the seasonality of precipitation: a sensitivity study. Geophys. Res. Lett. 2007; 34: L21707.
- Vogel J. C. , Lerman J. C. , Mook W. G . Natural isotopes in surface and groundwater from Argentina. Hydrol. Sci. Bull. 1975; 20: 203–221.
- Webster P. J. , Magaña V. , Palmer T. N. , Shukla J. , Tomas R. A. , co-authors . Monsoons: processes, predictability and prospects for prediction. J. Geophys. Res. 1998; 103: 14451–14510.
- Wei K. , Lin R . The influence of the monsoon climate on the isotopic composition of precipitation in China. Geochimica. 1994; 23(1): 33–41. (in Chinese).
- Wei K. , Lin R. , Wang Z . The isotopic content of deuterium and oxygen-18 in precipitation of Beijing. Sci. China (Ser. B). 1982; 8: 754–757. (in Chinese).
- Yao T. , Masson V. , Jouzel J. , Stievenard M. , Sun W. , co-authors . Relationship between δ18O in precipitation and surface air temperature in the Urumqi River Basin, East Tianshan Mountain, China. Geophys. Res. Lett. 1999; 26(23): 3473–3476.
- Yu J. , Yu F. , Liu D . The oxygen and hydrogen isotopic compositions of meteoric waters in the eastern part of China. Geochimica. 1987; 1: 22–26. (in Chinese).
- Yu J. , Zhang H. , Yu F. , Liu D . Oxygen isotopic composition of meteoric water in the eastern part of Xizang. Geochimica. 1980; 2: 113–121. (in Chinese).
- Zhang S. , Yu W. , Zhang Q. , Huang C. , Zhang R. , co-authors . Distribution of 2H and 18O in ice, firn and water in Qomolangma, Southern Tibetan Plateau. China. Sci. China (Ser. A). 1973; 4: 430–433. (in Chinese).
- Zhang X. , Shi Y. , Yao T . Variational features of precipitation δ18O in northeast Tibet Plateau. Sci. China (Ser. B). 1995; 38(7): 854–864.
- Zhang X. , Yao T . Mathematical modelling on fractionation process of oxygen isotope in atmospheric precipitation. J. Glaciol. Geocryaol. 1994; 16(2): 156–165. (in Chinese).
- Zhang X. , Yao T . Distribution features of δ18O in precipitation in China. Acta Geographica Sinica. 1998; 53(4): 357–364. (in Chinese).
- Zheng S. , Hou F. , Ni B . The studies of stable hydrogen and oxygen isotopes in precipitation in China. Chin. Sci. Bull. 1983; 28(13): 801–806. (in Chinese).