
Abstract
A high precision continuous measurement system has been developed for analysis of the atmospheric O2/N2 and Ar/N2 ratios based on a mass spectrometry method. Sample and reference air flows through an inlet system and only a miniscule amount of each is transferred to the ion source of the mass spectrometer through thermally insulated thin fused silica capillaries. The measured O2/N2 and Ar/N2 values are experimentally corrected for the effects of pressure imbalance between the sample air and reference air during their introduction into the mass spectrometer, as well as for the influence of CO2 concentration and O2/N2 ratio of the sample air. Standard deviations of the measured O2/N2 and Ar/N2 ratios of standard air are ±3.2 and ±6.5 per meg, respectively, for our normal measurement time of 62 seconds. Our standard air is prepared by drying natural air and then stored in 48-L high-pressure cylinders; its O2/N2 and Ar/N2 ratios are stable to within ±1.1 and ±5.8 per meg, respectively, over a period of 11 months. The CO2/N2 ratio is also simultaneously measured by this system, and converted to CO2 concentration with a precision better than ±0.3 ppm using an experimentally determined relationship. This system has been field tested in Tsukuba, Japan since February 2012. Preliminary results show clear seasonal cycles of atmospheric potential oxygen (APO=O2 +1.1×CO2), as well as of Ar/N2. If we ignore the fossil fuel influence, then that part the seasonal APO cycle driven by the air–sea heat flux accounts for 23% of the observed seasonal APO cycle, as estimated from the seasonal cycle of Ar/N2; any residuals are attributed to ocean biology and ventilation.
1. Introduction
Precise observations of the secular trend and the seasonal cycle of the atmospheric O2/N2 ratio would contribute to a better understanding of the global CO2 budget and marine biological activities, respectively (Keeling et al., Citation1993). For this purpose, intense observations of the O2/N2 ratio have been carried out since the early 1990s (Keeling and Shertz, Citation1992) at ground-based stations (e.g., Bender et al., Citation1996; Manning and Keeling, Citation2006; Tohjima et al., Citation2008; van der Laan-Luijkx et al., Citation2010; Ishidoya et al., Citation2012a), on oceanographic research/commercial vessels (Tohjima et al., Citation2005, Citation2012; Battle et al., Citation2006; Thompson et al., Citation2007), from aircraft in the free troposphere (e.g. Ishidoya et al., Citation2012b), and from a balloon-borne cryogenic air sampler in the stratosphere (Ishidoya et al., Citation2006, Citation2013).
On the other hand, a difference in the solubility between Ar and N2 and its subsequent effect on the air–sea Ar and N2 fluxes are basically the only contribution to changes in the atmospheric Ar/N2 ratio. Since the solubility varies in response to ocean warming/cooling, variation in the atmospheric Ar/N2 ratio is a unique tracer for air–sea heat fluxes. Therefore, a concurrently observed Ar/N2, along with O2/N2, can be used to estimate the contribution of the air–sea heat fluxes to atmospheric potential oxygen (APO=O2+1.1×CO2), which is a conservative variable for terrestrial biospheric activities and is an indicator of air–sea O2 fluxes (Stephens et al., Citation1998). Such an estimation is useful for not only deriving the contribution of marine biological activities, including the effects of ventilation of deep water with depleted O2 from the seasonal APO (Battle et al., Citation2003; Blaine Citation2005; Nevison et al., Citation2012), but also for clarifying long-term trends and interannual variation of APO driven by net air–sea heat fluxes (e.g. Bopp et al., Citation2002; Manning and Keeling, Citation2006; Ishidoya et al., Citation2012a). However, atmospheric Ar/N2 is very difficult to measure because of the significant artificial fractionations of Ar and N2 that occur during collection of air samples and subsequent analyses (e.g. Blaine, Citation2005; Blaine et al., Citation2006; Sturm et al., Citation2006). As a result, only a few studies have succeeded in observing the seasonal cycles of the atmospheric Ar/N2 ratio at surface stations (Battle et al., Citation2003; Keeling et al., Citation2004; Blaine, Citation2005; Cassar et al., Citation2008).
Atmospheric O2/N2 and Ar/N2 are usually reported in per meg units;
and
where the subscripts ‘sample’ and ‘standard’ indicate the O2/N2 (Ar/N2) ratios of the sample and the standard air, respectively. Because O2 (Ar) constitutes 20.946 (0.934)% of air by volume (Nicolet, Citation1960; Machta and Hughes, Citation1970), 4.8 (107) per meg of δ(O2/N2) [δ(Ar/N2)] is equivalent to 1 ppm. Peak-to-peak amplitudes of the seasonal cycle and secular trends of atmospheric δ(O2/N2) reported by past studies are about 50–150 per meg and −15–−20 per meg yr−1, respectively (e.g. Keeling et al., Citation1996; Battle et al., Citation2000; van der Laan-Luijkx et al., Citation2013), with a required precision of at least ±5 per meg (~±1 ppm) to infer something about the global CO2 cycle based on the δ(O2/N2) observations (Keeling et al., Citation1993). Therefore, various methods have been developed to measure δ(O2/N2) with a precision better than ±5 per meg using various instruments such as interferometer (Keeling, Citation1988; Keeling et al., Citation1998), mass spectrometer (Bender et al., Citation1994, Citation2005), gas chromatograph (Tohjima, Citation2000), paramagnetic analyser (Manning et al., Citation1999), vacuum ultraviolet analyser (Stephens et al., Citation2003) and fuel cell analyser (Stephens et al., Citation2007).
On the other hand, peak-to-peak amplitudes of the seasonal δ(Ar/N2) cycle reported in past studies are in a range of 6–35 per meg (Battle et al., Citation2003; Keeling et al., Citation2004; Blaine, Citation2005; Cassar et al., Citation2008); these are significantly smaller than those of the seasonal δ(O2/N2) cycles. Since Keeling et al. (Citation2004) estimated the long-term change of atmospheric δ(Ar/N2) to be only about 2.6 per meg due to an ocean warming of about 10×1022 J, roughly corresponding to an increase in heat content in the top 0–700 m layer during 1990–2005 (Levitus et al., Citation2009) (http://www.nodc.noaa.gov/OC5/3M_HEAT_CONTENT/). This requires a precision of ±10 per meg or better to detect a significant seasonal cycle and a long-term trend in δ(Ar/N2), the latter of which has not been observed so far.
In analysing flask air samples of atmospheric δ(Ar/N2), Battle et al. (Citation2003) and Keeling et al. (Citation2004) achieved a precision of about ±10 per meg using a mass spectrometer with a customised dual inlet system (Finnigan Delta Plus XL) and a single capillary mass spectrometer (ISOPRIME), respectively. Keeling et al. (Citation2004) and Blaine (Citation2005) also developed a continuous measurement system for atmospheric δ(O2/N2) and δ(Ar/N2) using ISOPRIME and achieved more precise measurements of δ(Ar/N2) (±2–3 per meg for 1 hour mean values).
In this paper, we present a newly developed high-precision system that simultaneously measures atmospheric δ(O2/N2), δ(Ar/N2) and CO2 using a mass spectrometer equipped with a customised dual inlet system. We also present preliminary observational results of O2/N2, Ar/N2 and CO2 obtained using the measurement system in Tsukuba (36°N, 140°E), Japan and estimate the relative contribution of the air–sea heat flux to the seasonal APO cycle based on the seasonal cycle of the Ar/N2 ratio.
2. Method
2.1. Measurement system and procedures
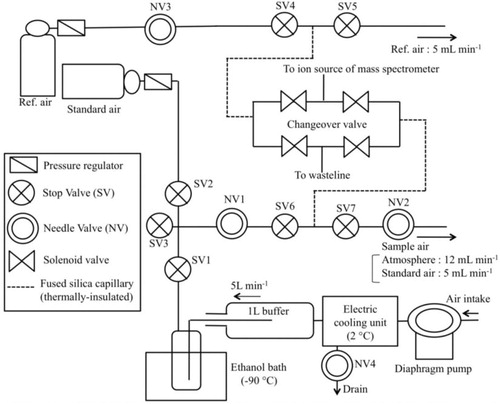
Our newly developed measurement system is schematically illustrated in . A mass spectrometer (Thermo Scientific Delta-V) is adopted to measure the ion beam currents for masses 28 (14N14N), 29 (15N14N), 32 (16O16O), 33 (17O16O), 34 (18O16O), 36 (36Ar), 40 (40Ar) and 44 (12C16O16O) simultaneously. The values of δ(O2/N2), δ(Ar/N2), and δ(CO2/N2) reported in this study are expressed using the following formula;3
4
5
Fig. 1 Schematic diagram of the continuous measurement system for the atmospheric δ(O2/N2), δ(Ar/N2) and δ(CO2/N2).
The measured δ(CO2/N2) of a sample air is converted to CO2 concentration units of ppm using experimentally determined relationships between δ(CO2/N2) and the CO2 concentration measured using a non-dispersive infrared analyser (NDIR) (see Section 2.5). It is noted that a response of the δ(O2/N2) [δ(Ar/N2)] value measured by our mass spectrometer to the O2/N2 (Ar/N2) ratio of a sample air has been confirmed to be linear with a correlation coefficient of 0.9999 (0.9995), by analysing 5 air samples with different O2/N2 ratios from the atmospheric value by ±20% (Ar/N2 ratios of ±50%); these samples were prepared by mixing pure O2 (Ar) and N2 using an absolute pressure sensor. The difference between the slopes of δ(O2/N2)/(O2/N2) [δ(Ar/N2)/(Ar/N2)] obtained from the measurement by the mass spectrometer and that calculated from eq. (3) [eq. (4)] has been also confirmed to be within 2 (1.5)%.
Sample air is taken from an air intake (4 mm inner diameter (ID) and 30 mm length stainless-steel tube) through a 100 m-length Dekabon tube [6 mm outer diameter (OD)] by using a diaphragm pump. Water vapour in the sample air is then reduced significantly using an electric cooling unit (ECU) at 2°C. The ECU unit is equipped with a drain, and a small portion of the sample air always flows out from the drain at a rate of 12 mL min−1 to draw out condensed water vapour. After passing ECU, the remaining sample air is introduced into a 1-L stainless-steel buffer tank, from where the gas is exhausted at a flow rate of 5 L min−1. A small portion of this exhausted gas is introduced into a 1/8-inch OD stainless-steel tube and any remaining water vapour is removed using a 350-mL cold trap at −90°C. During the continuous analysis of the sample air, a stop valve SV1 (SV2 and SV3) is opened (closed), and the flow rate of the gas is adjusted using needle valves (NV1 and NV2). Stop valves SV4, SV5, SV6 and SV7 are always open during the analysis. Finally, the remaining sample air is vented through an outlet path at a rate of 12 mL min−1, and only a miniscule amount of it is transferred to the ion source (or waste line) of the mass spectrometer through a 1.5-m length 25-µm ID insulated fused-silica capillary. The length and the diameter of the capillary have been chosen so that the sample air can be introduced into the ion source at an appropriate pressure (about 1.8×10⁻⁵ Pa). The insulation of the capillary is necessary to avoid a fractionation of air molecules due to temperature gradient (Keeling et al., Citation1998; Ishidoya et al., Citation2003). Ishidoya et al. (Citation2003) reported that the standard error of each δ(16O16O/15N14N) measurement for a sample air (consisted of 10 alternate analyses for the sample air and the reference air) was decreased considerably from 9.0–30.0 per meg to below 6.0 per meg, by insulating the fused-silica capillary used in the measurement system. As for the reference air, it is always supplied from a high-pressure cylinder at a flow rate of 5 mL min−1, and a miniscule amount of it is introduced into the ion source (or waste line) through another fused-silica capillary with the same length and shape as the one for the sample air. We use an air-based CO2 standard air filled in a 48-L aluminium high-pressure cylinder produced by Japan Fine Products (JFP) (hereafter referred to as the ‘air-based CO2 standard air’) as the reference air. The air-based CO2 standard air is prepared by mixing purified natural air with pure CO2. The δ(O2/N2) and δ(Ar/N2) values of the air-based CO2 standard air are found to be different from those of the ambient natural air by several ‰, and those of the reference air by about 5.9 and 3.2 ‰, respectively, against our primary standard air (see Section 2.6). The pressures of the sample and reference air are equalised using three needle valves (NV1, NV2 and NV3) to minimise the pressure-imbalance effects on the measured values (see Section 2.2).
For the continuous measurements of δ(O2/N2), δ(Ar/N2) and δ(CO2/N2), each mass spectrometry measurement (hereafter referred to as the ‘1 block measurement’) consists of 50 alternate analyses for the sample and reference air (hereafter referred to as the ‘50 cycles measurements’), and the block measurements are made repeatedly. The integration and idle times of each analysis are 16 and 15 seconds, respectively, and 1 block (1 cycle) measurement takes about 1 hour (62 seconds). The δ(O2/N2) and δ(Ar/N2) values of the sample air against the reference air are converted to values against our primary standard air for δ(O2/N2) and δ(Ar/N2) (see Section 2.6), by analysing the standard air periodically to determine the values of the reference air. The standard air, supplied from a high-pressure cylinder at a flow rate of 5 mL min−1, is introduced into the ion source (or waste line) of the mass spectrometer like the reference air, but through the sample-air line (i.e. SV1 and SV2 are closed and opened, respectively).
2.2. Influence of pressure imbalance between sample air and reference air on measured δ(O2/N2), δ(Ar/N2) and δ(CO2/N2) values
The ion beam current of a mass spectrometer depends on the kind and pressure of gas to be introduced, as well as on the ion source condition. To examine the effects of the pressure imbalance between sample and reference air on measured values, we have measured the ion beam currents by changing the pressure of air introduced into the mass spectrometer. shows typical relationships of the measured δ(O2/N2), δ(Ar/N2) and δ(CO2/N2) with the pressure imbalance. The pressure imbalance is expressed as a relative pressure change (ΔP/P) as follows:6
Fig. 2 Dependence of the measured δ(O2/N2), δ(Ar/N2) and δ(CO2/N2) on the relative pressure change (ΔP/P) between the sample air and the reference air to the pressure of the reference air at their introduction into the mass spectrometer.
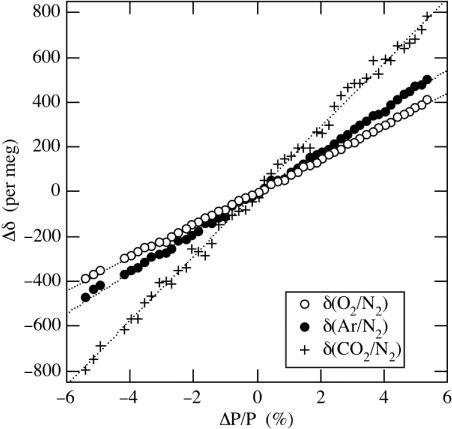
where 14N14Nsa and 14N14Nref are the detector outputs of the ion beam current for 14N14N of the sample and the reference air, respectively. Since 14N14N is a major component in the atmosphere and is nearly constant in concentration, the current is used as a measure for the pressure. As seen from , the measured values change in proportion to ΔP/P, and the change rates of δ(O2/N2), δ(Ar/N2) and δ(CO2/N2) relative to ΔP/P are 73, 90 and 144 per meg%−1, respectively. Because ΔP/P is usually adjusted to be within ±0.1% during continuous measurements, typical corrections for the measured δ(O2/N2), δ(Ar/N2) and δ(CO2/N2) values are within ±7, ±9 and ±14 per meg, respectively. The change rates of δ(O2/N2), δ(Ar/N2) and δ(CO2/N2) relative to ΔP/P are also observed to vary with time in ranges of ±8, ±13 and ±95 per meg %−1 (±1σ), respectively, from the respective average rateswhen using the same cathode unit of the ion source, so we have examined the above relationships about once a month.
2.3. Influence of CO2 concentration in sample air on measured δ(O2/N2) and δ(Ar/N2) values
When sample air is introduced into the ion source of the mass spectrometer, some of the CO2 molecules in the sample are converted to CO. The molecular mass of CO (12C16O) is equal to that of N2 (14N14N), so that mass spectrometry measured values of δ(O2/N2) and δ(Ar/N2) could be affected by the converted CO (Bender et al., Citation1994; Leuenberger et al., Citation2000; Ishidoya et al., Citation2003; Keeling et al., Citation2004). To examine this effect, we repeat number of times an experiment in which a very small and different amount of pure CO2 is added through SV3 to an air-based CO2 standard air flowing in the sample-air line shown in , and measure δ(O2/N2), δ(Ar/N2) and δ(CO2/N2) against the reference air.
An example of the experimental results is shown in . ΔCO2 represents the difference in the CO2 concentration of the air-based CO2 standard between after adding and before adding pure CO2. In this figure, the measured δ(CO2/N2) are already converted to CO2 concentration using the method described in Section 2.5. As seen in , the measured δ(O2/N2) and δ(Ar/N2) decrease with increasing ΔCO2. Linear regression lines fitted to δ(O2/N2) and δ(Ar/N2) yield slopes of −0.08 and −0.20 per meg ppm−1, respectively. Based on these slopes, the respective corrections to δ(O2/N2) and δ(Ar/N2) associated with the seasonal CO2 cycle in the northern mid-latitude, which is about 15 ppm (e.g. Nakazawa et al., Citation1997), are estimated to be about 1.2 and 3.0 per meg, while larger corrections would be needed for anthropogenic CO2 increase in an urban area. Therefore, the measured δ(O2/N2) and δ(Ar/N2) values are corrected for the measured CO2 concentration in the sample air using the above experimentally determined relationships. Because the slopes of the linear regression lines are found to be somewhat variable depending on the ion source condition, the relationships are examined every time when we exchange the cathode unit of the ion source.
Fig. 3 Changes of the measured δ(O2/N2) and δ(Ar/N2) values of the air sample dependent on its CO2 concentration. ΔCO2 represents the difference between the CO2 concentration of the air-based CO2 standard air after and before adding pure CO2 (see text).
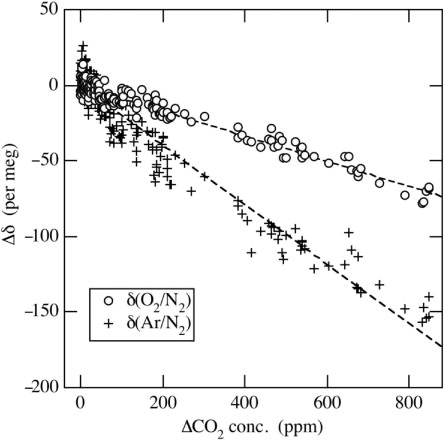
The decreases in measured δ(O2/N2) and δ(Ar/N2) with increasing ΔCO2 seen in are consistent with what one would expect from an apparent increase in 14N14N due to an increase in the generated 12C16O accompanied by an increase in the CO2 concentration. However, rates of change in δ(O2/N2) and δ(Ar/N2) against ΔCO2 are expected to be identical to each other if the influence on both δ(O2/N2) and δ(Ar/N2) is increased in proportion to the 12C16O/14N14N ratio. In this regard, Blaine (Citation2005) analysed a mixture of O2 and CO2, and a mixture of Ar and CO2, and found nearly identical change rates for both δ(O2/N2) and δ(Ar/N2) against ΔCO2. However, the change rate in δ(O2/N2)/ΔCO2 clearly differs from that of δ(Ar/N2)/ΔCO2 in this study. This discrepancy suggests that the influence of CO2 concentration on δ(O2/N2) and δ(Ar/N2) could be attributable not only to CO converted from CO2, but also to a yet-to-be-defined mutual interference of O2, N2, Ar and CO2.
2.4. Mutual influence of Ar/N2 and O2/N2 ratios in sample air on measured δ(O2/N2) and δ(Ar/N2) values
Keeling et al. (Citation2004) and Blaine (Citation2005) reported that δ(Ar/N2) in sample air is not affected by variation in δ(O2/N2), or δ(O2/N2) by variation in δ(Ar/N2). To examine this in the context of our measurement system, we repeat the experimental procedure described above in Section 2.3, but use instead pure O2 or Ar. In a we see that, by adding small amounts of O2 only, Δδ(Ar/N2) increases with increasing Δδ(O2/N2). The rate of change of Δδ(Ar/N2) relative to Δδ(O2/N2) is calculated to be 0.014 per meg per meg−1, the slope of the linear regression line. Since the observed peak-to-peak amplitude of the δ(O2/N2) seasonal cycle in the northern hemisphere mid-latitude is about 140 per meg (e.g. Tohjima et al., Citation2003; Ishidoya et al., 2012b), we need to apply a seasonal correction of about 2.0 per meg to the measured δ(Ar/N2). This correction is non-negligible. Such significant dependence of δ(Ar/N2) on the δ(O2/N2) variation in this study differs from the results of Keeling et al. (Citation2004) and Blaine (Citation2005). Therefore, our measured δ(Ar/N2) is corrected for the variation in δ(O2/N2) by using the regression relationship shown in a.
Fig. 4 (a) Change of the measured δ(Ar/N2) of the sample air dependent on its δ(O2/N2). (b) Same as (a) but for change of the measured δ(O2/N2) of the sample air dependent on its δ(Ar/N2). Δδ(Ar/N2) [Δδ(O2/N2)] is the difference between the measured δ(Ar/N2) [δ(O2/N2)] of the air-based CO2 standard air after and before adding pure O2 or Ar (see text).
![Fig. 4 (a) Change of the measured δ(Ar/N2) of the sample air dependent on its δ(O2/N2). (b) Same as (a) but for change of the measured δ(O2/N2) of the sample air dependent on its δ(Ar/N2). Δδ(Ar/N2) [Δδ(O2/N2)] is the difference between the measured δ(Ar/N2) [δ(O2/N2)] of the air-based CO2 standard air after and before adding pure O2 or Ar (see text).](/cms/asset/a5150685-a46e-4c4e-9e9d-566a12c1639a/zelb_a_11817289_f0004_ob.jpg)
In the experiments where we add small amounts of Ar, we find that δ(O2/N2) increases slightly with increasing δ(Ar/N2), and the rate of change of δ(O2/N2) relative to δ(Ar/N2) is calculated to be 0.00003 per meg per meg−1 (b). This shows that the influence of atmospheric δ(Ar/N2) variation on δ(O2/N2) is negligibly small, consistent with the results of Keeling et al. (Citation2004) and Blaine (Citation2005). Although it is not clear as to the cause of the way δ(Ar/N2) and δ(O2/N2) relate to each other, it has been reported that the isotopic ratio of O2 is affected by δ(O2/N2) variations in atmospheric air samples (Sowers et al., Citation1989).
Based on the results described in Sections 2.2–2.4, we correct δ(O2/N2) and δ(Ar/N2) using the following equations:7
8
where the subscripts ‘cor.’ and ‘meas.’ are the corrected and measured values, respectively. The parameters α, β and γ are the coefficients of corrections for ΔP/P between the sample and reference air, and influences of CO2 concentration and δ(O2/N2) of sample air on measured values, respectively, determined by the experiments described in Sections 2.2 to 2.4. Δ[CO2] [Δδ(O2/N2)cor.] denotes the difference in the CO2 concentration [δ(O2/N2)cor.] between the sample and the primary standard.
2.5. Conversion of measured δ(CO2/N2) to CO2 concentration
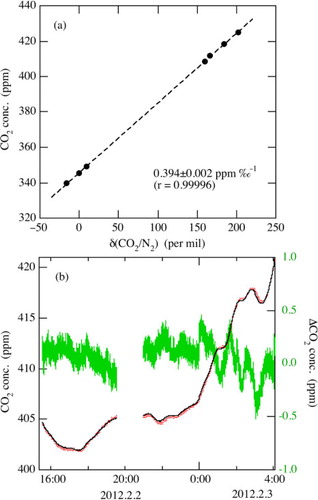
To measure CO2 concentration in sample air using our measurement system, conversion of the measured δ(CO2/N2) to CO2 concentration is needed. When we compare the ion beam currents of mass 44 for an air-based CO2 standard (350 ppm) with that for a CO2-free air, it is found that the measured ion beam currents consist of 70% CO2 (12C16O2) and 30% N2O (14N14N16O) generated from N2 and O2 in the ion source. Leuenberger et al. (Citation2000) also reported N2O being produced in the ion source and its significant superposition effect on CO2. This means that the measured δ(CO2/N2) does not represent directly the actual CO2 concentration in the sample air. Therefore, we proceed to find an experimental relationship between the measured δ(CO2/N2) and the CO2 concentration of an air-based CO2 standard. The CO2 concentrations of the standard air are determined using a NDIR (HORIBA, VIA-500) calibrated against our primary standard (Murayama et al., Citation2003). The measured δ(CO2/N2) values are found to change in proportion to the CO2 concentration over a range of 200–1000 ppm, with an average change rate of CO2 relative to δ(CO2/N2) of 0.40±0.02 ppm ‰−1 (±1σ). a shows an example of the relationship between δ(CO2/N2) and CO2 concentration. The δ(CO2/N2) data values are from the seven air-based CO2 standards measured on different days during the period from May 17 to June 11, 2012. The slope of the regression line is 0.394±0.002 ppm ‰−1 with a correlation coefficient of 0.99996, with an average difference of the NDIR-based CO2 concentrations from the regression lines of 0.28±0.19 ppm. Therefore, the linear relationship between δ(CO2/N2) and CO2 concentration is maintained for over 3 weeks. By using the obtained linear relationship, we can convert δ(CO2/N2) to CO2 concentration. b compares atmospheric CO2 concentration converted from δ(CO2/N2) with that actually measured using an NDIR (Licor, Li-6262) during February 2–3, 2012, at Tsukuba, Japan. Variation in the CO2 concentration converted from δ(CO2/N2) is quite similar to that measured by the NDIR, and the average difference between the two is −0.05±0.27 (±1σ) ppm over the 2-d period. The degree of agreement shows that our measurement system is able to observe atmospheric CO2 with a precision better than ±0.3 ppm, which is similar to the precision of CO2 concentration on a mass spectrometry reported by Leuenberger et al. (Citation2000). We have also noted that the CO2/δ(CO2/N2) ratio changes slowly with time at a rate of 0.36–0.44 ppm ‰−1, probably due to changes in the condition of the ion source for generating 14N14N16O. Therefore, we check the relationship between δ(CO2/N2) and CO2 every 2 weeks to maintain the measurement precision. The uncertainty of the CO2 concentration due to the 2-week interval in the calibration is typically within 0.2 ppm.
Fig. 5 (a) Relationship between δ(CO2/N2) of standard air measured using the mass spectrometer and CO2 concentration measured using a non-dispersive infrared analyser (NDIR). δ(CO2/N2) data were obtained on different days during May 17–June 11, 2012. (b) Atmospheric CO2 concentrations observed at Tsukuba, Japan using the mass spectrometer (black solid line) and a NDIR (red dots), and their differences (green line).
2.6. Standard air and measurement precision
Since the mass spectrometry approach we use in this study is a relative measurement method, a primary standard air with stable values of δ(O2/N2) and δ(Ar/N2) must be prepared. We have prepared two standards so far by filling natural air into 48-L aluminium high-pressure cylinders (cylinder No. CRC00045 and CRC00044) with a diaphragm valve (HAMAI, G-55) to a pressure of about 13 MPa after drying cryogenically by using a highly efficient water trap that can lower the dew point of air to lower than −80°C (Goto et al., Citation2013).
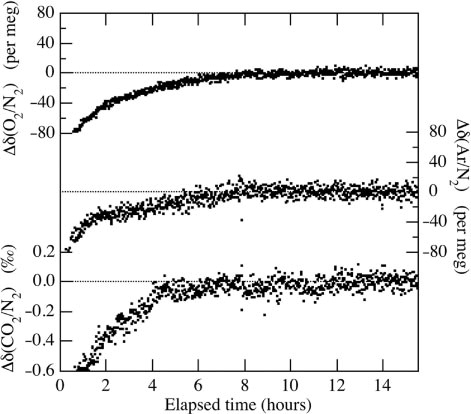
shows some typical analytical results of δ(O2/N2), δ(Ar/N2) and δ(CO2/N2) of the standard air against a reference air. The reference air is an air-based CO2 standard (350 ppm) stored in a cylinder with a key plate valve (HAMAI, G-12). During the analyses, the standard air cylinder is left lying on the floor, while the reference air cylinder is left standing due to the limited space in our laboratory. The high-pressure standard air cylinder needs to lie flat to reduce a thermally diffusive fractionation of O2, N2 and Ar due to temperature gradient between the top and the bottom of the cylinder (Keeling et al., Citation1998, Citation2004). The dots in represent the values obtained from 1 cycle measurement. As seen from the figure, about 8 hours of measurements are needed to achieve stable δ(O2/N2), δ(Ar/N2) and δ(CO2/N2) values after the opening of the high-pressure cylinder's valve. The initial drifts of the measured variables shown in occur repeatedly when the standard air is analysed against the reference air. We also find that about 5–8 hours are required to obtain stable values of δ(O2/N2), δ(Ar/N2) and δ(CO2/N2) for the high-pressure cylinders equipped with a diaphragm valve, while it takes longer than 24 hours to stabilise if the cylinders have a key plate valve. Therefore, the stabilisation time depends – at least based on our measurements – on the kind of high-pressure valves used. We have also found that the stabilisation time after the opening of the high-pressure cylinder's valve reduces to some extent if the pressure within the pressure regulator connected to the standard cylinder is kept high to equal the inner pressure of the cylinder itself. Therefore, the long stabilisation time is partly due to the fractionation of air molecules during the introduction of high-pressure air into the regulator. Standard deviations of the δ(O2/N2), δ(Ar/N2) and δ(CO2/N2) values shown in after 8 hours measurements are ±3.2 per meg, ±6.5 per meg and ±0.05 ‰ (~±0.02 ppm), respectively (±1σ).
Fig. 6 Typical analytical results of the δ(O2/N2), δ(Ar/N2) and δ(CO2/N2) of a standard air against a reference air. Data are shown as deviations from the average values for the period after 8 hours analyses.
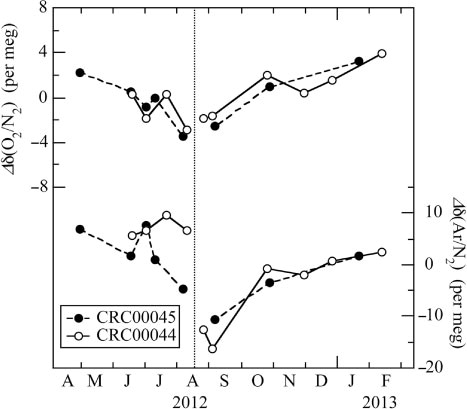
The δ(O2/N2) and δ(Ar/N2) values of the standard air must be stable for several years to make accurate observations of their seasonal cycles and secular trends in the atmosphere. Therefore, we have examined month-to-month variations of the measured δ(O2/N2) and δ(Ar/N2) values of our two standard air against the reference air (using average values of more than 50-cycle measurements of the stable values). In , deviations from the average values for the respective standard air over the period April 2012–February 2013 are plotted. The δ(O2/N2) and δ(Ar/N2) values of the two standard air cylinders show similar temporal variations, as well as some clear gaps related to the time of exchange of the cathode unit in the mass spectrometer. The standard deviations of the δ(O2/N2) [δ(Ar/N2)] values, from the average values for each period using the same cathode units, are calculated to be ±2.2 and ±1.9 per meg (±5.0 and ±5.9 per meg) (±1σ) for the CRC00045 and CRC00044 cylinders, respectively. Temporal changes in δ(O2/N2) are correlated closely with δ(Ar/N2) for the CRC00045 and CRC00044 cylinders, and the δ(Ar/N2)/δ(O2/N2) ratio is calculated to be 2.2±0.4 per meg per meg−1, which is consistent with 2.17 per meg per meg−1 reported by Keeling et al. (Citation2004) for the fractionation of molecules due to the thermal diffusion effect in a high-pressure (12 MPa) cylinder. Therefore, these facts would suggest that the measured values of the reference air from a vertically standing cylinder (as was the case in this study) are affected by the thermal diffusion due to the vertical temperature gradient in our laboratory.
Fig. 7 Temporal changes of the δ(O2/N2) and δ(Ar/N2) of the standard air (CRC00045 and CRC00044) against a reference air. Data are shown as deviations from the average values for the respective standard air over the period. Vertical dotted line denotes the time when the cathode unit of the ion source of the mass spectrometer was exchanged.
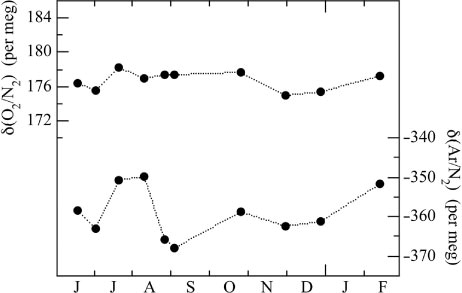
We regarded the cylinder CRC00045 as our primary standard air, and the cylinder CRC00044 as working standard air in the following discussion. shows the δ(O2/N2) and δ(Ar/N2) values of the working standard against the primary standard, calculated by subtracting the time-interpolated δ(O2/N2) and δ(Ar/N2) values of the primary standard against the reference air from those of the working standard. From the figure, the average δ(O2/N2) and δ(Ar/N2) values of the CRC00044 cylinder for the period from July 2012 to February 2013 are calculated to be 176.6±1.1 and −357.5±5.8 per meg (±1 σ), respectively. From the results, the long-term stabilities of δ(O2/N2) and δ(Ar/N2) are estimated to be ±1.1 per meg and ±5.8 per meg (±1σ), respectively. The required precisions to detect δ(O2/N2) secular trend and δ(Ar/N2) seasonal cycle need to be ±5 and ±10 per meg or better, and our measurement system has met the requirement and is able to measure atmospheric δ(O2/N2) and δ(Ar/N2) simultaneously. and 8 also indicate that measurements of the standard air about every 1.5 months are enough to calibrate the observed δ(O2/N2) and δ(Ar/N2), resulting in only a small consumption of the standard air (0.1 MPa yr−1).
Fig. 8 Temporal changes of δ(O2/N2) and δ(Ar/N2) of the working standard air against the primary standard air.
3. Preliminary observational results of the atmospheric δ(O2/N2), δ(Ar/N2) and CO2 concentration in Tsukuba, Japan
3.1. Atmospheric δ(O2/N2) and CO2 concentration
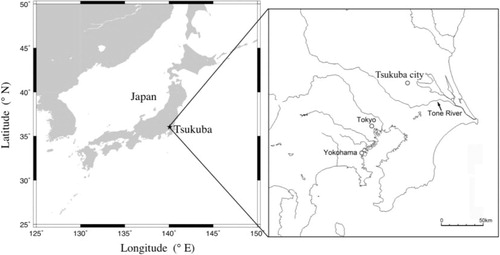
Using our measurement system, we have made, since February 2012, continuous measurements of atmospheric δ(O2/N2), δ(Ar/N2) and CO2 concentration in the city of Tsukuba, Japan, located northeast of Tokyo and about 50 km from the Pacific coastline (), with a population of about 218 000. Air intake is located on the roof of an 8-m-high laboratory building situated on the grounds of the National Institute of Advanced Industrial Science and Technology (AIST). Mean annual temperature and precipitation are 13.8°C and 1283 mm, respectively, based on the 1981–2010 Japan Meteorological Agency data. The plant cover around the AIST building complex, located on the southern part of the central city area, consists mainly of deciduous and coniferous trees.
Fig. 9 Location of the city of Tsukuba, Japan.
shows the observed atmospheric δ(O2/N2) and CO2 concentration at Tsukuba. Individual values of δ(O2/N2) and CO2 are obtained from the 1 cycle measurement of the mass spectrometer. Curves consisting of two-harmonics and a linear trend optimally fitted to the maximum (minimum) values of δ(O2/N2) (CO2) for the successive 24-hours periods are also shown in . Although it is expected that δ(Ar/N2) does not naturally change significantly on diurnal timescale, Sturm et al. (Citation2006) and Blaine et al. (2006) reported that δ(Ar/N2) shows much lower values during the daytime than during the night time by about 80–100 per meg due to the thermally diffusive fractionation of Ar and N2 at the air intake (hereafter referred to as the ‘inlet fractionation’) under significant radiative heating/cooling and with relatively small gas velocity of the sample air at the air intake (0.3–0.4 m s−1). If this is the case, then the diurnal δ(O2/N2) cycle is also affected by about 20–30 per meg due to the inlet fractionation, by assuming the thermal diffusion factors’ ratio of δ(Ar/N2)/δ(O2/N2) to be 3.77 at 1.013×10⁵ Pa (Keeling et al., Citation2004). The observed δ(Ar/N2) at Tsukuba shows lower values during the daytime than during the night time by about 3.3 per meg on average, which is significantly smaller than above-mentioned 80–100 per meg. This is probably due to the large gas velocity of 6.6 m s−1 at the air intake we use in our instrument. Therefore, the effect of the inlet fractionation on the average diurnal δ(O2/N2) cycle has been estimated to be within about 1 per meg. However, the diurnal δ(Ar/N2) cycle at Tsukuba is somewhat larger than that of 1 per meg observed at La Jolla (33°N, 117°W), USA using an aspirated air intake (Blaine et al., Citation2006).
Fig. 10 Observational results of the atmospheric δ(O2/N2) and CO2 concentration at Tsukuba, Japan. The best-fitted curves consisting of two-harmonics and a linear trend to the daily maximum (minimum) values of the δ(O2/N2) (CO2 concentration) are also shown.
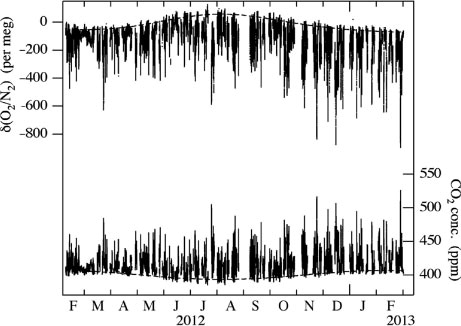
As seen in , δ(O2/N2) and CO2 vary in opposite phase, each characterised by a large number of spikes with low (high) δ(O2/N2) (CO2 concentration) values. We also note discernable seasonal cycles of δ(O2/N2) and CO2, as indicated by the best-fitted curves. Seasonal maximum and minimum (minimum and maximum) of δ(O2/N2) (CO2 concentration) appear in late July and early March, respectively, with peak-to-peak seasonal amplitudes of the δ(O2/N2) and CO2 cycles of about 130 per meg and 14 ppm, respectively, which are close to 128±22 per meg and 13.9±2.5 ppm, respectively, observed in the suburbs of Sendai (38°N, 140°E), Japan, located about 300 km north of Tsukuba (Ishidoya et al., Citation2012b).
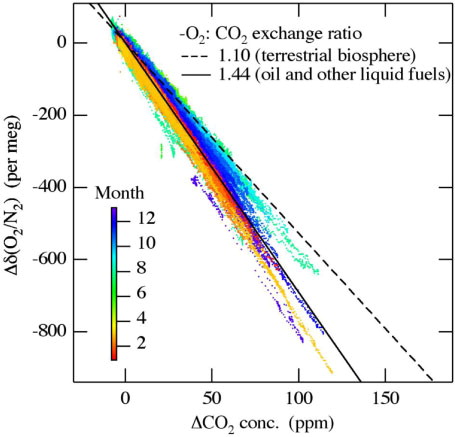
shows a relationship between Δδ(O2/N2) and ΔCO2 shown in and its temporal variation. Δδ(O2/N2) denotes the difference between the observed δ(O2/N2) values and their best-fitted curve shown in ;ΔCO2 denotes the same difference but for CO2. The -O2:CO2 exchange ratios for terrestrial biospheric activities and the combustion of liquid fuels have been estimated to be 1.1 and 1.44 ppm ppm−1, respectively (Severinghaus, Citation1995; Keeling, Citation1988). It is noted that 4.8 per meg of δ(O2/N2) is equivalent to 1 ppm since O2 constitutes 20.946% of air by volume. It is seen from that the relationships for periods November–March and May–September are close to those expected from liquid fuel combustion and terrestrial biospheric activities, respectively. The summertime (May–September) and wintertime (November–March) average -O2:CO2 exchange ratios are calculated to be 1.24 and 1.43, respectively, from the best-fitted lines. This is consistent with the summertime enhancement of terrestrial biospheric activities and the year-round oil-consumption due to human activities around Tsukuba. Similar seasonal differences in the relationship between δ(O2/N2) and CO2 have also been observed in the suburbs of Sendai (Goto et al., Citation2013).
Fig. 11 Relationship between the δ(O2/N2) and the CO2 concentration shown in . Δδ(O2/N2) (ΔCO2) is the difference between the observed δ(O2/N2) (CO2) values and their best-fitted curve shown in Fig. 10. Colour bar denotes observation months. Dashed and solid black lines denote -O2: CO2 exchange ratio expected from the terrestrial biospheric activities and the combustion of oil and other liquid fuels, respectively.
In , the observed values of δ(O2/N2), CO2 and APO during March 1–4 and August 2–5, 2012 are shown (red dots). The values corrected for the fractionation, estimated from the variation in the simultaneously measured Δδ(Ar/N2), and for the thermal diffusion factors’ ratio of δ(Ar/N2)/δ(O2/N2), are also given (black dots). Here, Δδ(Ar/N2) means the difference between the measured δ(Ar/N2) and the calculated 4-d averaged δ(Ar/N2) for each of the observational periods. APO in this study is defined by:9
Fig. 12 δ(O2/N2), CO2 concentration and APO observed at Tsukuba, Japan on March 1–4 (a) and August 2–5 (b), 2012, after (black dots) and before (red dots) correcting for the fractionation due to thermal diffusion using the simultaneously observed δ(Ar/N2) values (see text).
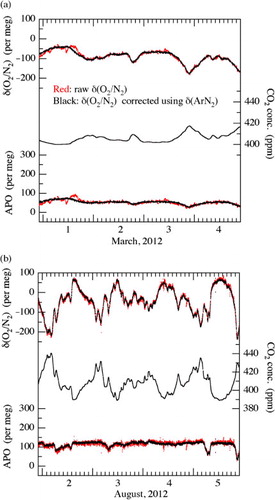
Here, [CO2] is the CO2 concentration in ppm, 1.1 is the -O2:CO2 exchange ratio for the terrestrial biospheric activities (Severinghaus, Citation1995), 0.20946 is the mole fraction of O2 in the atmosphere (Machta and Hughes, Citation1970) and 2000 is an arbitrary APO reference point. It should be noted that APO defined by eq. (9) is also influenced by fossil fuel combustion and cement production processes in particular for the urban areas, since their -O2:CO2 exchange ratios (1.17 for solid fuels, 1.44 for liquid fuels, 1.95 for gaseous fuels and 0 for cement production) (Keeling, Citation1988; Steinbach et al., Citation2011) are different from that for the terrestrial biospheric activities.
As seen in , both the observed and corrected δ(O2/N2) vary in opposite phase with that of the CO2 concentration. Moreover, short-term irregular fluctuations of the observed δ(O2/N2) and APO are much reduced in the corrected values. Such irregular fluctuations are occasionally seen in our continuous measurements of the atmosphere but never in the analyses of the standard air. We have also found, during these irregular fluctuations, that the relationship between δ(Ar/N2) and the simultaneously measured stable isotopic ratios of N2 (not shown) is consistent with that expected from the fractionations due to the thermal diffusion effect (Keeling et al., Citation2004; Ishidoya et al., Citation2013). The causes of the irregular fluctuations of the measured values have not been specified yet, but they might be related to the slight temperature fluctuations in the sample air accompanied by the pressure fluctuations in the ECU and/or cold trap due to the fluctuation of the drain flow of the ECU. The irregular fluctuations could also be due to the short-term variations in the inlet fractionation, although the effects of the inlet fractionation on the average diurnal cycle of δ(O2/N2) and δ(Ar/N2) have been determined to be small, as described above. Therefore, some kind of an artificial thermal fractionation in the inlet system is superimposed on the measured values of the sample air, and it is important to correct the δ(O2/N2) values by using Δδ(Ar/N2) for any detailed discussion about their real short-term variations.
3.2. Seasonal cycles of APO and δ(Ar/N2)
It has been reported that the seasonal APO cycle is generated by three different ocean processes: (1) thermal in- and out-gassing, (2) net community production (NCP) in the mixed layer, and (3) ventilation of deep water (e.g. Keeling et al., Citation1993; Nevison et al., Citation2012). Because the atmospheric δ(Ar/N2) variation is caused mainly by the thermally driven air–sea Ar and N2 fluxes, the thermal components of the seasonal APO cycle can be estimated from the simultaneously measured seasonal δ(Ar/N2) cycle (e.g. Battle et al., Citation2003; Blaine, Citation2005).
shows APO values at Tsukuba calculated from the δ(O2/N2) and CO2 concentration measurements shown in . A curve, consisting of two-harmonics and a linear trend, best fitted to the maximum values of APO for the successive 24-hours periods is also shown in the figure. We see many spike-like, short-term variations in APO, since we also see similar fluctuations in δ(O2/N2) and CO2. As described above, the summertime and wintertime average -O2:CO2 exchange ratios at Tsukuba are found to be 1.24 and 1.43, respectively. Therefore, these larger -O2:CO2 exchange ratios (larger than 1.1) for a terrestrial biospheric source are observed throughout the year, which means most of the short-term variations with low APO seen in would be mainly attributable to the liquid fuel combustion around Tsukuba.
Fig. 13 Observational results of APO at Tsukuba, Japan. The best-fitted curve consisting of two-harmonics and a linear trend to the daily maximum values is also shown.
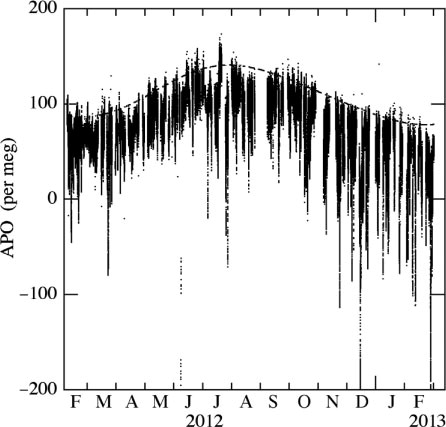
As delineated more clearly by the best-fitted curve in , the APO values observed at Tsukuba show a distinct seasonal cycle nearly in phase with the seasonal δ(O2/N2) cycle. A seasonal maximum (minimum) of APO appears in July (March), with a peak-to-peak seasonal amplitude of about 58 per meg. This is consistent with the seasonal APO cycle observed at Sendai (Ishidoya et al., Citation2012b). As described above, not only the air–sea O2 and N2 fluxes but also various industrial processes could influence APO as defined by eq. (9). In this connection, Sirignano et al. (Citation2010) reported a new tracer APO*, defined by replacing the value of 1.1 in eq. (9) by a value determined by [1.1–f*(φ*–1.1)], to include the influence of fossil fuel. Here, f* is the fraction of the atmospheric CO2 concentration originating from industrial processes and φ* is the -O2:CO2 exchange ratios for the fuel and cement production processes characteristic of a given region. The curve-fitting analysis used in would be useful to reduce the short-term (intra to inter diurnal) influence of the industrial processes on the seasonal APO cycle, however, cannot exclude the influence of the seasonal variability of f* and φ*. Therefore, it is noted that the seasonal APO cycle at Tsukuba reported in this study could be influenced by the seasonal variability of the industrial processes to some extent.
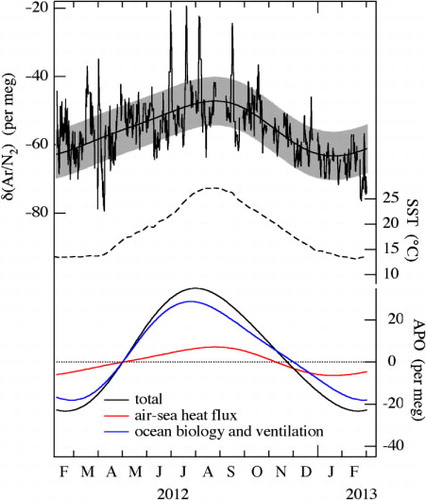
shows 24-hour running means of atmospheric δ(Ar/N2) observed at Tsukuba using our continuous measurement system. The best-fitted curve to the data consisting of two-harmonics and a linear trend is also shown. In order to examine the seasonal cycle of δ(Ar/N2), those data points with deviations greater than ±60 per meg from 2-week running mean values are regarded as short-term irregular fluctuations and are excluded from the analyses (about 3% of the total data points are excluded). The standard deviation of the observed 24-hour running mean values from the best-fitted curve is calculated to be ±7.1 per meg (±1σ) (grey shade in ). As seen from , a seasonal maximum (minimum) of δ(Ar/N2) appears in August/September (January), with a peak-to-peak seasonal amplitude of about 16 per meg. Atmospheric δ(Ar/N2) is expected to be higher in the summer than in the winter because of the greater seasonal solubility change of Ar than N2 in the seawater (Battle et al., Citation2003). Mean sea surface temperatures (SST) around Japan (31–41°N, 130–150°E) obtained from the NCEP NOMADS Meteorological Data Server (http://nomad2.ncep.noaa.gov/ncep_data/index.html) (Reynolds et al., Citation2007) are also plotted in . As expected, the seasonal variation in the SST is almost in phase with the observed seasonal δ(Ar/N2) cycle.
Fig. 14 24-hour running mean values of the δ(Ar/N2) observed at Tsukuba, Japan. The best-fitted curve consisting of two-harmonics and a linear trend to the data is also shown, and the shade around the fitted curve represents standard deviation of the observational data from the fitted curve (top). Sea surface temperature (SST) around Japan from NCEP NOMADS Meteorological Data Server (middle). Seasonal components of total APO, the APO driven by air–sea heat flux, and ocean biology and ventilation estimated from the observed APO and δ(Ar/N2) (see text; bottom).
Although our observation of the seasonal δ(Ar/N2) cycle is the first in Asia, it has also been observed at 13 stations in both hemispheres (Battle et al., Citation2003; Keeling et al., Citation2004; Blaine, Citation2005; Cassar et al., Citation2008). The peak-to-peak amplitudes of the seasonal δ(Ar/N2) cycle observed in this study and those in past studies are summarised in . The seasonal δ(Ar/N2) amplitude of 16 per meg observed at Tsukuba falls within the range of amplitudes reported in past studies, but is slightly larger than that at La Jolla located in the similar latitudinal zone. The difference between Tsukuba and La Jolla may be related to the larger seasonal amplitude of the air–sea heat flux around Japan than that off the west coast of the USA (.4 in Blaine, Citation2005).
Table 1. Amplitudes of the seasonal δ(Ar/N2) cycle reported in this study, Keeling et al. (Citation2004) and Cassar et al. (Citation2008)
As reported in past studies (Battle et al., Citation2003; Blaine, Citation2005), the seasonal APO cycle generated by the air–sea heat flux can be approximated by multiplying the δ(Ar/N2) cycle by 0.84 derived from the solubility ratio of O2 and Ar (Weiss, Citation1970) under the assumption of instantaneous air–sea exchanges of O2, N2 and Ar. The seasonal component of APO driven by the air–sea heat flux is also shown in . The seasonal component of the total APO obtained from the best-fitted curve shown in and the APO component driven by marine biology and circulation ventilation, simply obtained by subtracting the air–sea heat flux component from the total APO, are also shown in . In this analysis, the effect of industrial processes on the best-fitted curve for the total APO is ignored. Such simplification could cause a significant uncertainty in the estimated biological component of APO, if the f* and φ* values around Tsukuba were to change seasonally, as was the case with the φ* value in Netherlands reported by Sirignano et al. (Citation2010). Nevertheless, if we calculate using the fitted curve shown in , the seasonal APO cycle driven by the air–sea heat flux accounts for 23% of the total APO cycle at Tsukuba. This fraction falls within the range of 10–34% reported by past studies (e.g. Battle et al., Citation2003; Blaine, Citation2005). It is also seen from that the seasonal maximum of the APO cycle driven by marine biology and ventilation appears about 1 month earlier than that of the APO cycle driven by the air–sea heat flux. This can be attributed to the spring bloom in the sea around Japan (Yamagishi et al., Citation2008), which appears earlier than the seasonal SST maximum.
4. Summary
We have developed a precise continuous measurement system for observing atmospheric δ(O2/N2) and δ(Ar/N2) using a mass spectrometry method. Sample and reference air-flow through the inlet system, and only a minuscule amount of each is transferred to the ion source of the mass spectrometer through thermally insulated fused-silica capillaries. The biased measurements of δ(O2/N2), δ(Ar/N2) and δ(CO2/N2) due to the pressure difference between the sample and reference air during the introduction into the mass spectrometer, the dependence of the measured δ(O2/N2) and δ(Ar/N2) values on CO2 concentration, and the dependence of the measured δ(Ar/N2) values on δ(O2/N2) are corrected by using experimentally determined relationships.
δ(CO2/N2) measured by the mass spectrometer is converted to CO2 concentration determined by a NDIR using an experimentally determined relationship, and the measurement precision of the CO2 concentration is estimated to be better than ±0.3 ppm. The primary and the working standard gases for δ(O2/N2) and δ(Ar/N2) are prepared by drying natural air and then storing them in 48-L high-pressure cylinders. The standard deviations of δ(O2/N2), δ(Ar/N2) and CO2 are ±3.2 per meg, ±6.5 per meg and ±0.02 ppm (±1σ), respectively, for a time-resolution of 62 seconds (1 cycle measurement) for analyses. Through comparisons of the working standard air with the primary standard air, we have found the stability of our standard air to be ±1.1 and ±5.8 per meg for δ(O2/N2) and δ(Ar/N2), respectively, over a period of 11 months.
Using our new instrument, we have started continuous observations of atmospheric δ(O2/N2), δ(Ar/N2) and CO2 at Tsukuba, Japan in February 2012. The observed atmospheric δ(O2/N2) and CO2 vary with opposite phase. For short-term variations of several hours or days, the summertime and wintertime -O2:CO2 exchange ratios are found to be consistent with those expected from terrestrial biospheric activities and liquid fossil fuel combustion, respectively. The observed APO, calculated from δ(O2/N2) and CO2, shows a clear seasonal cycle with a peak-to-peak amplitude of 58 per meg, characterised by a maximum and a minimum in July and March, respectively. δ(Ar/N2) also shows a significant seasonal cycle with a maximum in August/September and a minimum in January, with a peak-to-peak amplitude of 16 per meg. If we ignore the fossil fuel influence on the observed seasonal APO cycle, then the contribution of the seasonal change in the air–sea heat flux to the seasonal APO cycle is estimated to be 23%, as determined from the observed seasonal δ(Ar/N2) cycle.
In order to contribute to a better understanding of the global carbon cycle and the air–sea heat flux, we will carry out long-term continuous measurements of atmospheric δ(O2/N2), δ(Ar/N2) and CO2. To estimate the biological component of APO more precisely from the seasonal cycles of APO and δ(Ar/N2), an evaluation of the fossil fuel influence on the APO measurement is also important.
5. Acknowledgements
This study was partly supported by the Grants-in-Aid for Scientific Research (2010/22710002 and 2012/24241008).
References
- Battle M , Bender M. L , Hendricks M. B , Ho D. T , Mika R , co-authors . Measurements and models of the atmospheric Ar/N2 ratio. Geophys. Res. Lett. 2003; 30: 1786.
- Battle M , Bender M. L , Tans P. P , White J. W. C , Ellis J. T , co-authors . Global carbon sinks and their variability inferred from atmospheric O2 and δ13C. Science. 2000; 287: 2467–2470.
- Battle M , Fletcher S. M , Bender M. L , Keeling R. F , Manning A. C , co-authors . Atmospheric potential oxygen: new observations ant their implications for some atmospheric and oceanic models. Global Biogeochem. Cycles. 2006; 20: GB1010.
- Bender M , Ellis J. T , Tans P , Francey R , Lowe D. C . Variability in the O2/N2 ratio of southern hemisphere air 1991–1994: implication for the carbon cycle. Global Biogeochem. Cycles. 1996; 10: 9–21.
- Bender M. L , Ho D. T , Hendricks M. B , Mika R , Battle M. O , co-authors . Atmospheric O2/N2 changes, 1993–2002: implications for the partitioning of fossil fuel CO2 sequestration. Global Biogeochem. Cycles. 2005; 19: GB4017.
- Bender M. L , Tans P. P , Ellis J. T , Orchard J , Habfast K . High precision isotope ratio mass spectrometry method for measuring the O2/N2 ratio of air. Geochim. Cosmochim. Acta. 1994; 58: 4751–4758.
- Blaine T. W . Continuous Measurements of Atmospheric Argon/Nitrogen as a Tracer of Air–Sea Heat Flux: Models, Methods, and Data. 2005; San Diego: University of California. PhD Thesis.
- Blaine T. W , Keeling R. F , Paplawsky W. J . An improved inlet for precisely measuring the atmospheric Ar/N2 ratio. Atmos. Chem. Phys. 2006; 6: 1181–1184.
- Bopp L , Le Quéré C , Heimann M , Manning A. C , Monfray P . Climate-induced oceanic oxygen fluxes: implications for the contemporary carbon budget. Global Biogeochem. Cycles. 2002; 16
- Cassar N , Mckinley G. A , Bender M. L , Mika R , Battle M . An improved comparison of atmospheric Ar/N2 time series and paired ocean–atmosphere model predictions. J. Geophys. Res. 2008; 113: D21122.
- Goto D , Morimoto S , Ishidoya S , Ogi A , Aoki S , co-authors . Development of a high precision continuous measurement system for the atmospheric O2/N2 ratio and its application at Aobayama, Sendai, Japan. J. Meteorol. Soc. Japan. 2013; 91: 179–192.
- Ishidoya S , Aoki S , Goto D , Nakazawa T , Taguchi S , co-authors . Time and space variations of the O2/N2 ratio in the troposphere over Japan and estimation of global CO2 budget. Tellus B. 2012b; 64: 18964.
- Ishidoya S , Aoki S , Nakazawa T . High precision measurements of the atmospheric O2/N2 ratio on a mass spectrometer. J. Meteorol. Soc. Japan. 2003; 81: 127–140.
- Ishidoya S , Morimoto S , Aoki S , Taguchi S , Goto D , co-authors . Oceanic and terrestrial biospheric CO2 uptake estimated from atmospheric potential oxygen observed at Ny-Alesund, Svalbard, and Syowa, Antarctica. Tellus B. 2012a; 64: 18924.
- Ishidoya S , Sugawara S , Hashida G , Morimoto S , Aoki S , co-authors . Vertical profiles of the O2/N2 ratio in the stratosphere over Japan and Antarctica. Geophys. Res. Lett. 2006; 33: L13701.
- Ishidoya S , Sugawara S , Morimoto S , Aoki S , Nakazawa T , co-authors . Gravitational separation in the stratosphere – a new indicator of atmospheric circulation. Atmos. Chem. Phys. 2013; 13: 8787–8796.
- Keeling R. F . Development of an Interferometric Oxygen Analyzer for Precise Measurement of the Atmospheric O2 Mole Fraction. 1988; Cambridge: Harvard University. PhD Thesis.
- Keeling R. F , Bender M. L , Tans P. P . What atmospheric oxygen measurements can tell us about the global carbon cycle. Global Biogeochem. Cycles. 1993; 7: 37–67.
- Keeling R. F , Blaine T , Paplawsky B , Katz L , Atwood C , co-authors . Measurement of changes in atmospheric Ar/N2 ratio using a rapid-switching, single-capillary mass spectrometer system. Tellus B. 2004; 56: 322–338.
- Keeling R. F , Manning A. C , McEvoy E. M , Shertz S. R . Methods for measuring changes in atmospheric O2 concentration and their application in southern hemisphere air. J. Geophys. Res. 1998; 103: 3381–3397.
- Keeling R. F , Piper S. C , Heimann M . Global and hemispheric CO2 sinks deduced from changes in atmospheric O2 concentration. Nature. 1996; 381: 218–221.
- Keeling R. F , Shertz S. R . Seasonal and interannual variations in atmospheric oxygen and implications for the global carbon cycle. Nature. 1992; 358: 723–727.
- Leuenberger M , Nyfeler P , Moret H. P , Sturm P , Indermühle A , co-authors . CO2 concentration measurements on air samples by mass spectrometry. Rapid Commun. Mass Spectrom. 2000; 14(16): 1552–1557.
- Levitus S , Antonov J. I , Boyer T. P , Locarnini R. A , Garcia H. E , co-authors . Global Ocean Heat Content 1955–2008 in light of recently revealed instrumentation problems. Geophys. Res. Lett. 2009; 36: L07608.
- Machta L , Hughes E . Atmospheric oxygen in 1967 to 1970. Science. 1970; 168: 1582–1584.
- Manning A. C , Keeling R. F . Global oceanic and land biotic carbon sinks from the Scripps atmospheric oxygen flask sampling network. Tellus B. 2006; 58: 95–116.
- Manning A. C , Keeling R. F , Severinghaus J. P . Precise atmospheric oxygen measurements with a paramagnetic oxygen analyzer. Global Biogeochem. Cycles. 1999; 13: 1107–1115.
- Murayama S , Saigusa N , Chan D , Yamamoto S , Kondo H , co-authors . Temporal variations of atmospheric CO2 concentration in a temperate deciduous forest in central Japan. Tellus B. 2003; 55: 232–243.
- Nakazawa T , Morimoto S , Aoki S , Tanaka M . Temporal and spatial variations of the carbon isotopic ratio of atmospheric carbon dioxide in the western Pacific region. J. Geophys. Res. 1997; 102: 1271–1285.
- Nevison C. D , Keeling R. F , Kahru M , Manizza M , Mitchell B. G , co-authors . Estimating net community production in the Southern Ocean based on atmospheric potential oxygen and satellite ocean color data. Global Biogeochem. Cycles. 2012; 26: GB1020.
- Nicolet M , Ratcliffe J. A . The properties and constitution of the upper atmosphere. Physics of the Upper Atmosphere. 1960; New York: Elsevier. 17–71.
- Reynolds R. W , Smith T. M , Liu C , Chelton D. B , Casey K. S , co-authors . Daily high-resolution blended analyses for sea surface temperature. J. Clim. 2007; 20: 5473–5496.
- Severinghaus J . Studies of the Terrestrial O2 and Carbon Cycles in Sand Dune Gases and in Biosphere 2. 1995; New York: Columbia University. PhD Thesis.
- Sirignano C , Neubert R. E. M , Rödenbeck C , Meijer H. A. J . Atmospheric oxygen and carbon dioxide observations from two European coastal stations 2000–2005: continental influence, trend changes and APO climatology. Atmos. Chem. Phys. 2010; 10: 1599–1615.
- Sowers T , Bender M , Raynaud D . Elemental and isotopic composition of occluded O2 and N2 in polar ice. J. Geophys. Res. 1989; 94: 5137–5150.
- Steinbach J , Gerbig C , Rödenbeck C , Karstens U , Minejima C , co-authors . The CO2 release and Oxygen uptake from Fossil Fuel Emission Estimate (COFFEE) dataset: effects from varying oxidative ratios. Atmos. Chem. Phys. 2011; 11: 6855–6870.
- Stephens B , Keeling R , Heimann M , Six K , Murnane R , co-authors . Testing global ocean carbon cycle models using measurements of atmospheric O2 and CO2 concentration. Global Biogeochem. Cycles. 1998; 12: 213–230.
- Stephens B. B , Bakwin P. S , Tans P. P , TecLaw R. M , Baumann D . Application of a differential fuel-cell analyzer for measuring atmospheric oxygen variations. J. Atmos. Ocean. Thechnol. 2007; 24: 82–94.
- Stephens B. B , Keeling R. F , Paplawsky W. J . Shipboard measurements of atmospheric oxygen using a vacuum-ultraviolet absorption technique. Tellus B. 2003; 55: 857–878.
- Sturm P , Leuenberger M , Valentino F. L , Lehmann B , Ihly B . Measurements of CO2, its isotopes, O2/N2, and 222Rn at Bern, Switzerland. Atmos. Chem. Phys. 2006; 6 1991–2004.
- Thompson R. L , Manning A. C , Lowe D. C , Wetherburn D. C . A ship-based methodology for high precision atmospheric oxygen measurements and its application in the Southern Ocean region. Tellus B. 2007; 59: 643–653.
- Tohjima Y . Method for measuring changes in the atmospheric O2/N2 ratio by a gas chromatograph equipped with a thermal conductivity. J. Geophys. Res. 2000; 105: 14575–14584.
- Tohjima Y , Minejima C , Mukai H , Machida T , Yamagishi H , co-authors . Analysis of seasonality and annual mean distribution of the atmospheric potential oxygen (APO) in the Pacific region. Global Biogeochem. Cycles. 2012; 26: GB4008.
- Tohjima Y , Mukai H , Machida T , Nojiri Y . Gas-chromatographic measurements of the atmospheric oxygen/nitrogen ratio at Hateruma Island and Cape Ochi-Ishi, Japan. Geophys. Res. Lett. 2003; 30: 1653.
- Tohjima Y , Mukai H , Machida T , Nojiri Y , Gloor M . First measurements of the latitudinal atmospheric O2 and CO2 distributions across the western Pacific. Geophys. Res. Lett. 2005; 32: L17805.
- Tohjima Y , Mukai H , Nojiri Y , Yamagishi H , Machida T . Atmospheric O2/N2 measurements at two Japanese sites: estimation of global oceanic and land biotic carbon sinks and analysis of the variations in atmospheric potential oxygen (APO). Tellus B. 2008; 60: 213–225.
- van der Laan-Luijkx I. T , Karstens U , Steinbach J , Gerbig C , Sirignano C , co-authors . CO2, δO2/N2 and APO: observations from the Lutjewad, Mace Head and F3 platform flask sampling network. Atmos. Chem. Phys. 2010; 10: 10691–10704.
- van der Laan-Luijkx I. T , van der Laan S , Uglietti C , Schibig M. F , Neubert R. E. M , co-authors . Atmospheric CO2, δ(O2/N2) and δ13CO2 measurements at Jungfraujoch, Switzerland: results from a flask sampling intercomparison program. Atmos. Meas. Tech. 2013; 6: 1805–1815.
- Weiss R. F . The solubility of nitrogen, oxygen and argon in water and seawater. Deep-Sea Res. 1970; 17: 721–735.
- Yamagishi H , Tohjima Y , Mukai H , Sasaoka K . Detection of regional scale sea-to-air oxygen emission related to spring bloom near Japan by using in-situ measurements of the atmospheric oxygen/nitrogen ratio. Atmos. Chem. Phys. 2008; 8: 3325–3335.