
Abstract
Anhydrosugars including levoglucosan and mannosan are the most effective organic tracers for biomass burning aerosol in the atmosphere. In this study, to investigate the contribution of biomass burning emissions to the aerosol burden in the Pearl River Delta (PRD) region, China, 24-hour integrated PM2.5 samples were collected simultaneously at four locations, (i) Guangzhou (GZ), (ii) Zhaoqing (ZQ) in Guangdong province, (iii) Hok Tsui (HT) and (iv) Hong Kong Polytechnic University (PU) in Hong Kong, in four seasons between 2006 and 2007. Levoglucosan and mannosan, together with water-soluble inorganic ions and water-soluble organic carbon (WSOC), were determined to elucidate the seasonal and spatial variations in biomass burning contributions. The concentrations of levoglucosan and mannosan were on average 82.4±123 and 5.8±8.6 ng m−3, respectively. The WSOC concentrations ranged from 0.2 to 9.4 µg m−3, with an average of 2.1±1.6 µg m−3. The relative contributions of biomass burning emissions to OC were 33% in QZ, 12% in GZ, 4% at PU and 5% at HT, respectively, estimated by the measured levoglucosan to organic carbon ratio (LG/OC) relative to literature-derived LG/OC values. The contributions from biomass burning emissions were in general 1.7–2.8 times higher in winter than those in other seasons. Further, it was inferred from diagnostic tracer ratios that a significant fraction of biomass burning emissions was derived from burning of hard wood and likely also from field burning of agricultural residues, such as rice straw, in the PRD region. Our results highlight the contributions from biomass/biofuel burning activities on the regional aerosol budget in South China.
1. Introduction
It is well documented that biomass burning emissions contribute a large fraction of carbonaceous aerosol on a global scale and exert significant impacts on air quality, human health and climate. In particular, the continent of Asia is a large source of biomass burning, including forest fires, prescribed burns, crop residue burning and domestic biofuel use for cooking and heating (Streets et al., Citation2003; Yevich and Logan, Citation2003; Gadde et al., Citation2009). Aerosols derived from biomass burning emissions consist of a complex mixture of inorganic and organic compounds, of which water-soluble organic compounds (WSOC) are one of the major fractions, which can alter the hygroscopicity of aerosols and influence the formation and lifetime of clouds (Saxena et al., Citation1995; IPCC, Citation2001; Temesi et al., Citation2003; Viana et al., Citation2007). The physicochemical and optical properties of biomass burning aerosol vary depending on fuel types and combustion conditions.
Source apportionment of specific types of pollutant emissions can be achieved by the quantification of molecular markers (aka tracers) in combination with the use of emission factors (i.e. source profiles). Water-soluble non-sea salt potassium (nss-K+) has been widely used to assess contributions of biomass/biofuel burning emissions to ambient aerosol, although cooking and vegetation emissions also produce nss-K+ (Lawson and Winchester, Citation1979; Morales et al., Citation1996; Schauer et al., Citation1999, Citation2002). On the contrary, organic molecular tracers can provide more accurate source information, although they may be subject to degradation during transport between the source regions and receptor sites. Many organic species have been proposed and utilised as tracers for biomass burning derived aerosols, including retene, methoxy phenols, resin acids and anhydrosugars (Ramdahl Citation1983; Simoneit et al., Citation1993; Simpson et al., Citation2005). The latter are the most commonly used tracers, including levoglucosan, mannosan, and galactosan, which are produced from thermal degradation of cellulose and hemicellulose (Shafizadeh et al., Citation1979; Simoneit et al., Citation1999). In the case of significant influence of biomass burning emissions on the ambient aerosol, these compounds are typically the most abundant organic aerosol constituents, allowing reliable detection even in samples with low particle loadings. In addition to being unique tracers for biomass burning and having high abundance, the anhydrosugars have been shown to be relatively stable under various atmospheric conditions such as strong solar radiation and low pH values (Fraser and Lakshmanan, Citation2000). However, recent laboratory investigations revealed the potential degradation of levoglucosan in aqueous solution in the presence of strong oxidants (e.g. OH radical), resulting in reduced life times of this tracer (Hennigan et al., Citation2010; Hoffmann et al., Citation2010). Nevertheless, the anhydrosugars can be used for semi-quantitative or conservative quantitative assessments of biomass burning influence. Moreover, the relative abundance of individual anhydrosugars has been suggested to be an indicator of specific types of burned biomass (e.g. Engling et al., Citation2009).
The Pearl River Delta (PRD) region in southern China covers nine prefectures of Guangdong province, namely Guangzhou (GZ), Shenzhen, Zhuhai, Dongguan, Zhongshan,Foshan, Huizhou, Jiangmen, and Zhaoqing (ZQ), as well as the Special Administrative Regions of Hong Kong and Macau. This region has a population of 40 million. Its climate is mainly dominated by the Asian monsoon, with a northerly wind prevailing in winter and a southerly wind prevailing in summer. Therefore, the PRD region is a perfect location to capture the signals of biomass burning emissions from the upwind source regions. Although levoglucosan and mannosan concentrations have been reported in the PRD region in previous studies (e.g. Zhang et al., Citation2010b, Citation2012; Sang et al., Citation2011), their seasonal and spatial variations have not yet been studied.
The reported concentrations of levoglucosan in atmospheric aerosols vary dramatically, ranging from a few ng m−3 at an oceanic background site (Simoneit et al., Citation2004) to over 40 µg m−3 under the influence of wildfire emissions (Pashynska et al., Citation2002). In this paper, we present the measurement results of levoglucosan and mannosan, together with water-soluble inorganic ions and WSOC, in PM2.5 samples collected simultaneously at four sampling locations in the PRD region on selected dates throughout a 1-yr period (2006–2007). The sampling was classified into four seasons: spring (March, April, and May), summer (June, July, August, and September), autumn (October and November), and winter (December, January, and February). Our findings highlight the importance of contributions from biomass burning activities on the regional aerosol budget in South China.
2. Experimental methods
2.1. Sample collection
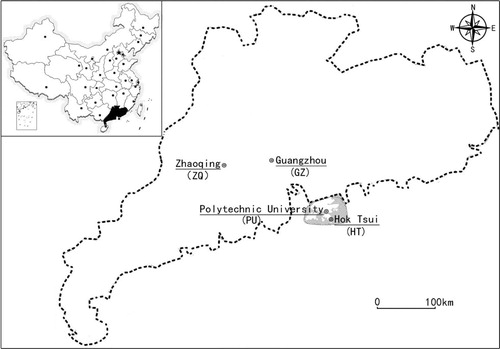
A total of four sampling sites were selected in the PRD region, namely (i) Sun Yat-Sen University in GZ, (ii) Zhaoqing University (ZQ) in ZQ, (iii) Hok Tsui (HT), and (iv) Hong Kong Polytechnic University (PU) in Hong Kong (). These four sites are representatives of different geographical characteristics (urban: GZ; semi-rural: ZQ; rural: HT; and roadside: PU). The descriptions of the sampling sites are shown below:
Fig. 1 Map showing locations of the four sampling sites in the PRD region (GZ: Guangzhou; ZQ: Zhaoqing University in Zhaoqing; HT: Hok Tsui; and PU: Hong Kong Polytechnic University in Hong Kong).
GZ: This site was on the roof (15 m) of a building on the main campus of Sun Yat-Sen University. It represents an urban monitoring site.
ZQ: The site was near the Star Lake scenic spot. It was located on a rooftop (10 m) at the campus of ZQ University, which is surrounded by an agricultural area (with occasional agricultural residue burning).
HT: The site was located at the southern tip of Hong Kong Island where the least anthropogenic pollution is expected. This is thus considered as a rural monitoring station.
PU: The site was located adjacent (1 m) to Hong Chong Road, which leads to the Cross Harbor Tunnel. It can represent street-level emissions from vehicular exhaust.
Twenty four-hour integrated PM2.5 samples were collected at the four sampling sites concurrently every sixth day from 14 August 2006 to 28 August 2007. A total of 208 valid samples were obtained for chemical analyses. The PM2.5 was collected on pre-fired (800°C, 3 h) quartz micro-fibre filters (Whatman, Clifton, NJ) with medium-volume samplers at a flow rate of 113 L min−1. The sampling flows were checked before and after sampling with a mass flowmeter (Model 4040, TSI, Shoreview, MN). The aerosol-loaded filters were stored in a refrigerator at 4°C until chemical analysis to prevent loss of volatile components. Approximately 5% field blanks were collected to correct for positive artefacts that may result from adsorption of gas-phase organic compounds onto the filters during and/or after the sampling, and to account for any other influence during sampling, transport, storage, and filter analysis.
2.2. Anhydrosugar quantification by HPAEC
A portion (2.2 cm2) of each quartz fibre filter was extracted with 3.0 mL of de-ionised water (>18.2 MΩ cm) under ultrasonic agitation for 60 min. The water-extracts were passed through syringe filters (0.45 µm, Pall Corporation, NY, USA) to remove insoluble materials. All extract solutions were stored at 4°C until sample analysis. Anhydrosugars (e.g. levoglucosan and mannosan) were separated, identified and quantified by high-performance anion exchange chromatography coupled with pulsed amperometric detection (HPAEC-PAD). The detailed description of the analytical method can be found elsewhere (Engling et al., Citation2006; Iinuma et al., Citation2009). Briefly, a Dionex ICS-3000 system was employed, consisting of a dual pump module, dual conductivity detector/chromatography compartment and autosampler. The separation of the carbohydrate species was carried out on a Dionex Carbopac MA1 analytical column (250×4 mm) equipped with a guard column. Aqueous solution of sodium hydroxide (NaOH, 480 mM) was used as eluent at a flow rate of 0.4 mL min−1. The method detection limits (MDL) for the individual analytes ranged from 0.04 to 0.7 ng m−3. Nearly quantitative (100%) extraction was achieved by analysis of filters spiked with known concentrations of analytes. None of the carbohydrate species were detectable in the blank samples.
2.3. Inorganic ion measurement by IC
The common inorganic ions (three anions: Cl−, and
; and five cations: Na+,
, K+, Mg2 + and Ca2 +) were determined in the same water-extracts as those prepared for HPAEC analysis, using a Dionex ICS-3000 ion chromatograph (IC) that was composed of the same components as the HPAEC system but equipped with a conductivity detector. Cations were separated on an Ionpac CS12 analytical column (250×4 mm) and CG12 guard column with 20 mM methanesulfonic acid (MSA) eluent at a flow rate of 1.0 mL min−1. Anions were separated by an Ionpac AS14 (250×4 mm) and AG14 guard column with an eluent consisting of 4.5 mM Na2CO3 and 1.4 mM NaHCO3 at a flow rate of 1.2 mL min−1. Field blanks were used to correct for residual amounts of the water-soluble inorganic ions in the quartz filters, and the data presented here are corrected by the field blanks.
2.4. WSOC analysis
For analysis of the WSOC fraction, five punches (with a total area of 2.63 cm2) were taken from each filter and placed into a 15 mL screw-capped vial to which 10 mL of de-ionised water was added. Samples were extracted in a sonication bath for 1 h. Filter debris and suspended insoluble particles were removed from the water-extracts using a syringe filter (0.2 µm PTFE membrane) (Decesari et al., Citation2006). Each filtered extract was then transferred into a clean auto-sampler fitted vial and analysed for total organic carbon (TOC) using a Shimadzu TOC-V CPH high-sensitivity Total Carbon Analyzer (Columbia, MD). The MDL for the method was 0.01 µg m−3, with a precision of ±5%.
2.5. OC/EC analysis
The OC and elemental carbon (EC) were measured on a 0.526 cm2 punch from each filter by thermal optical reflectance (TOR) following the IMPROVE protocol with a DRI Model 2001 Thermal/Optical Carbon Analyzer (Atmoslytic Inc., Calabasas, CA) (Cao et al., Citation2003; Chow et al., Citation2004, Citation2005). This produced four OC fractions in a pure helium (He) atmosphere, a pyrolysed carbon fraction [OP, determined when reflected laser light attained its original intensity after oxygen (O2) was added to the combustion atmosphere], and three EC fractions n a 2% O2/98% He atmosphere. The IMPROVE OC is operationally defined as OC1 + OC2 + OC3 + OC4 + OP, whereas the EC is defined as EC1 + EC2 + EC3-OP. The MDL for the carbon analysis were 0.8 and 0.4 µgC cm−2 for the OC and EC, respectively, with a precision better than 10% for total carbon.
2.6 Fire count and backward trajectory model
Fire counts detected by Moderate Resolution Imaging Spectroradiometer on NASA satellites (available at http://maps.geog.umd.edu/firms/maps.htm) were used to identify the geographical hot spots of biomass burning activities with a horizontal resolution of 1×1 km2.
In order to identify the source regions of long-range transported air masses reaching South China, 2-d backward air mass trajectories were calculated with the HYSPLIT model (available at http://ready.arl.noaa.gov/HYSPLIT.php) for each sampling period. The FNL (Final Operational Global Analysis) meteorological data were chosen as the input, with 100 m above ground level as the starting heights of the trajectories. The backward trajectories were computed at 20:00 UTC of each sampling day, corresponding to the time when filters were typically changed.
3. Results and discussion
3.1 Spatial distribution of anhydrosugars
Spatial variations of WSOC and anhydrosugar (levoglucosan and mannosan) concentrations in PM2.5 are shown in . The WSOC concentrations ranged from 0.2 to 9.4 µg m−3, with an average of 2.1±1.6 µg m−3 in the PRD region. Among the four sampling sites, the average concentration in ZQ was highest (3.1±2.1 µg m−3), which can be attributed to a mixed contribution from both nearby emission sources and secondary formation processes. These findings indicate that high level of WSOC also exists in the suburban and rural areas of GZ. The lowest average WSOC concentration was found at HT (1.3±1.1 µg m−3), which is due to the lack of significant primary emission sources and secondary organic aerosol (SOA) precursors near the sampling site. This observation is consistent with previous measurements of low levels of OC in PM2.5 at this location (Huang et al., 2012). The levoglucosan and mannosan concentrations exhibited large variations among the four sites. The concentrations of levoglucosan ranged from below MDL to 621 ng m−3, with an average of 82.4±12.3 ng m−3, while the concentrations of mannosan ranged from below MDL to 43.7 ng m−3, with an average of 5.8±8.6 ng m−3. The levoglucosan concentrations at the four measurement sites ranked in the ascending order HT≈PU<GZ<ZQ, while the mannosan concentrations ranked in the order HTPU < GZ < ZQ. The samples collected at the four PRD sites were found to be influenced by local biomass burning activities and biomass burning emissions transported from nearby regions (see Section 3.2 for further discussion). The lower values in Hong Kong might be explained by the lack of large scale of biomass burning and biofuel usage in the Hong Kong territory (Sang et al., Citation2011). The highest anhydrosugar concentrations were observed at the semi-rural site ZQ (levoglucosan: 208±163 ng m−3; mannosan: 13.5±11.5 ng m−3), indicating frequent biomass burning activities during the measurement period. The anhydrosugar concentrations at HT (levoglucosan: 26.1±59.5 ng m−3; mannosan: 2.9±5.4 ng m−3) were lower than those at all other sites. HT is situated away from the urban district of Hong Kong and is predominantly influenced by the East Asian monsoon, which is characterised by south–southeasterly or northeasterly winds from the South China Sea and northwestern Pacific during winter/spring and summer/autumn, respectively. The significant dilution and dispersion during the long-range transport of aerosols from the source regions to the Hong Kong measurements sites could be an explanation for the low levels of anhydrosugars.
Table 1. Concentrations (including one standard deviation and range) of anhydrosugars (in ng m−3) and WSOC in PM2.5 (in µg m−3) at the four sampling sites in the PRD region
The levoglucosan to OC ratio (LG/OC) has been used to estimate contributions from biomass burning to OC mass (e.g. Zdrahal et al., Citation2002; Puxbaum et al., Citation2007; Zhang et al., Citation2010a). In this study, LG/OC ratios were fairly high, ranging from 0.0001 to 0.120 with an average of 0.011±0.016 (). The average LG/OC ratios in Hong Kong (PU: 0.003±0.004; HT: 0.004±0.007) were lower than those found in Guangdong province (GZ: 0.009±0.014; ZQ: 0.026±0.021). The low LG/OC ratio may also be partly due to potential degradation of levoglucosan during long-range transport. Moreover, local biomass/biofuel combustion activities rarely occur in Hong Kong. Mannosan was detected in the cases of enhanced levoglucosan levels, whereas mannosan was below MDL in most of the other samples. Nevertheless, the ratios observed in this study were within the range of previous findings in Hong Kong and Hainan (Zhang et al., Citation2012).
Table 2. Average (and associated standard deviation) of ratios of analy s ed species at the four sampling sites in the PRD region
Zhang et al. (Citation2010b) utilised a simplified receptor-based approach to estimate biomass burning contributions to ambient aerosol at an urban PRD site. Such an approach requires the specific tracer molecules (e.g. levoglucosan) to be stable in the atmosphere during transport and to be removed at the same rate with their counterparts (i.e. OC or PM2.5). Although levoglucosan degradation was observed in recent laboratory experiments (Hennigan et al., Citation2010; Hoffmann et al., Citation2010), this is still a useful, yet simple, method to assess the impact of biomass burning due to the presence of considerable amounts of levoglucosan in biomass burning aerosol. It is important to note, however, that due to its highly polar character, differential washout of levoglucosan relative to bulk OC during long-range transport cannot be ruled out, which might cause a shift in the LG/OC ratio, thus affecting the estimated source contributions to some extent. Another critical step in the estimation of biomass burning contributions, using this receptor-based approach, is the selection of suitable, that is, representative, LG/OC ratios. While levoglucosan emission factors can be obtained from various chamber/lab combustion studies, as shown in , only few source profiles have been established for Asian and particularly Chinese biomass burning processes. Here, we used the average emission factor of 8.2% (LG/OC) reported by Zhang et al., Citation2007, for typical biomass species commonly burned in South China in combination with the LG/OC ratios measured in our samples, to estimate the contributions of biomass burning emissions to the ambient OC in the PRD region. The contributions of biomass burning emissions to OC at ZQ (32.6±21.1%) and GZ (11.6±17.1%) were significantly higher than those at PU (3.8±5.4%) and HT (4.9±8.5%) in Hong Kong (see ), consistent with the more common and intensive biomass burning activities in Guangdong province. Using the same LG/OC ratio (Zhang et al., Citation2007), the calculated biomass burning contribution at HT (5% of OC) was close to that from a previous study at the same site (Zhang et al., Citation2012). However, the contributions in ZQ (33% of OC) were more than twice that in Beijing (14%), likely due to the extensive burning activities in the rural areas of Guangdong province. It should be noted that the main energy source in the rural regions of China are still biofuels, including crop residues and fuel wood (Yan et al., Citation2006). A recent study using the isotope mass balance model based on Δ14C-black carbon (BC) values showed that the contribution of biomass burning to BC was ~20% across East Asia (Chen et al., Citation2013). This is in good agreement with our study using a tracer-based method. The total amount of dry matter subjected to combustion (open field burning of crop residues and domestic biofuel combustion) was estimated to be 17.5–34.4 Tg for the three southwestern provinces (Guangxi, Guizhou and western part of Guangdong) and 13–24 Tg for the three southeastern provinces (Jiangsu, Fujian and east Guangdong) in 2000 (Yan et al., Citation2006), which illustrates the potential large influence of biomass burning aerosol.
Table 3. Levoglucosan to OC (LG/OC) ratios, obtained from controlled (chamber/lab) biomass burning studies
presents the spatial variations of the anhydrosugar fractions in WSOC (on a carbon/carbon basis). Levoglucosan carbon constituted on average 1.5±1.9% of WSOC (range 0.01–12.8%). In contrast, the contribution of mannosan carbon to WSOC was 10 times lower, with an average of 0.12±0.15% (range 0.005–0.91%). Among the four sampling sites, levoglucosan and mannosan contributed the highest fractions to WSOC in ZQ (levoglucosan: 3.1±2.0%; mannosan: 0.22±0.17%), followed by GZ (levoglucosan: 1.7±2.1%; mannosan: 0.12±0.18%), PU (levoglucosan: 0.69±0.96%; mannosan: 0.06±0.08%), and HT (levoglucosan: 0.59±0.91%; mannosan: 0.09±0.10%). Such patterns further demonstrate that biomass burning activities at ZQ and GZ were much larger than those at PU and HT.
3.2. Seasonal distribution of levoglucosan
Seasonal variations of anhydrosugars (levoglucosan and mannosan), together with WSOC, are illustrated in . The WSOC concentrations were ~1.8–2.9 times higher in autumn/winter than those in spring/summer, which showed a similar seasonal trend to a previous year-round study in Asia (Kirillova et al., Citation2013). The lower WSOC concentrations in summer are possibly due to enhanced thermal convection, associated with the influence of the Asian monsoon. The southwesterly summer monsoon carries cleaner air from the oceans (the South China Sea and tropical Pacific Ocean), while the northeasterly winter monsoon brings polluted air masses from Mainland China. This indicates that land-based emissions dominated WSOC levels over the PRD region. The increases in aerosol emissions and the occurrence of stable atmospheric conditions in winter most likely caused the enhanced WSOC concentrations in this season. The concentrations of levoglucosan and mannosan were 61.4, 38.6, 84.8 and 166 ng m−3 and 4.86, 2.42, 4.25, 12.6 ng m−3 in spring, summer, autumn and winter, respectively. The elevated concentrations of anhydrosugars in winter indicate the impact of biomass burning emissions on the aerosol burden in the PRD region during winter.
Table 4. Seasonal average tracer concentrations (in ng m−3) and contribution of biomass to OC (%) in the PRD region
Seasonal variations of LG/OC ratios are shown in . Among all the sites, ZQ, PU and HT had the highest LG/OC ratios in winter (0.044, 0.006, 0.011, respectively) followed by spring (0.025, 0.005, 0.004, respectively). However, in GZ, the highest LG/OC ratio was observed in autumn (0.018), followed by winter (0.012). The calculated relative contributions from biomass burning emissions to OC in PM2.5 are listed in . The biomass burning contributions were 12.7±14.4%, 7.6±12.6% 13.0±21.8% and 21.6±23.1% in spring, summer, autumn and winter, respectively. LG (carbon) relative to WSOC values also showed the same seasonal pattern, with the highest value in winter (2.29) and lowest values in summer (0.93) at all measurement sites except GZ.
Table 5. Seasonal average LG/OC ratios in the PRD region
Extensive biomass burning activities were detected in South China (mainly in the western part of Guangdong and the southeast China coastal provinces) during winter, as reflected in the satellite-derived fire counts (). Such large-scale burning near the PRD region resulted in significant regional build-up of aerosol pollution. In contrast, during spring and summer time, biomass burning activities were apparent in Southeast Asia/Philippines and Indonesia, respectively (). The highest anhydrosugar levels were observed in winter due to agricultural burning activities near the PRD region.
Fig. 2 Fire counts during the sampling periods in four seasons (the fire spot data were retrieved from NOAA Satellite and Information Service website).
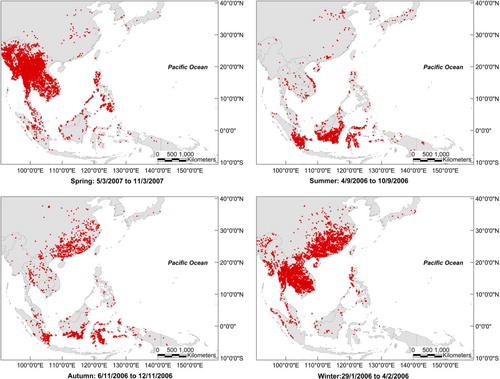
In order to investigate the transport and the source region of air pollutants, 3-d air mass back trajectory analyses were conducted using the NOAA HYSPLIT model (Hybrid Single-Particle Lagrangian Integrated Trajectory, NOAA/ARL) with a starting elevation of 500 m. In winter and autumn, prevailing northeasterly wind brings polluted air masses from southeast China coastal areas, across the PRD region before reaching Hong Kong (). The 3-d backward air mass trajectories show that, when the highest levoglucosan levels were recorded at the sampling sites, the polluted air masses originated from South China, that is, from the southeast China coastal provinces on 28 December 2006 and 10 January 2007, and the northern part of Guangdong on 28 January 2007. The observations of enhanced WSOC and anhydrosugar levels were associated with air masses passing over the fire spots, indicating that the pollutants in the PRD region were likely influenced by biomass burning emissions from the southern part of Guangdong and the southeast China coastal regions. In contrast, low anhydrosugar concentrations were found in summer, when prevailing southwesterly/easterly winds bring warm and damp air masses from the South China Sea through Hong Kong to the PRD region.
Fig. 3 Three-day backward air mass trajectories at Hok Tsui in four seasons [back trajectory analyses were conducted using the NOAA HYSPLIT model (Hybrid Single-Particle Lagrangian Integrated Trajectory, NOAA/ARL)].
![Fig. 3 Three-day backward air mass trajectories at Hok Tsui in four seasons [back trajectory analyses were conducted using the NOAA HYSPLIT model (Hybrid Single-Particle Lagrangian Integrated Trajectory, NOAA/ARL)].](/cms/asset/b8283e64-9df8-4dc8-a5d8-7aa2a973196c/zelb_a_11817270_f0003_ob.jpg)
In this study, ZQ, PU and HT had the second highest LG/OC ratio and biomass burning contributions in spring. Figure 3 shows the 3-d backward trajectories of air masses reaching the sampling sites (at 500 m above ground level) during the sampling period in spring. It can be clearly seen from the trajectories that the biomass burning-rich air masses originated from the southeast China coastal provinces where fire spots were detected by satellite (especially in March and April 2007). However, during March and April 2007, extensive fire activities were observed in the SE Asian subcontinent and the Philippines as well, as illustrated in the 7-d fire count maps. For example, the air masses arriving on 31 March 2007 originated from the South China Sea and passed over the northern part of the Philippines before reaching the ZQ site. Although the levoglucosan concentration was only 124 ng m−3, the biomass burning contribution was 37% at ZQ during this episode, which was up to 185 times higher than those at the other three sites, where the air masses originated from the South China Sea. This indicates that ZQ was impacted by biomass burning emissions derived from the Philippines, besides local emission sources.
3.3. Relationship between anhydrosugars and other components
shows the positive correlation of the WSOC with levoglucosan at ZQ (r=0.70), indicating that biomass burning was one of the major sources for WSOC in ZQ. Poor correlations between WSOC and levoglucosan were observed at the GZ urban site, indicating that WSOC did not have significant contributions from biomass burning at this location. shows the correlation coefficients between WSOC and levoglucosan concentrations in the four seasons. The correlations in autumn (r=0.74) and winter (r=0.73) were slightly higher than that in summer (r=0.64), further suggesting that the impacts of biomass burning emissions in autumn and winter were greater than those in summer.
Fig. 4 Correlation between WSOC and levoglucosan concentrations at ZQ.
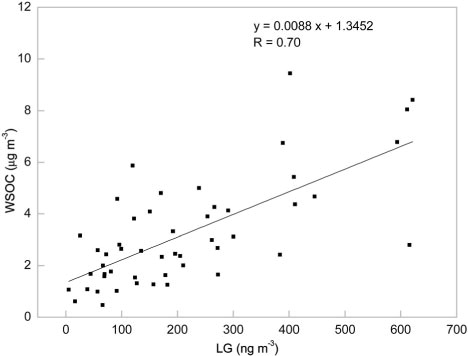
Table 6. Correlation coefficients between levoglucosan and WSOC or nss-K+ concentrations in the four seasons
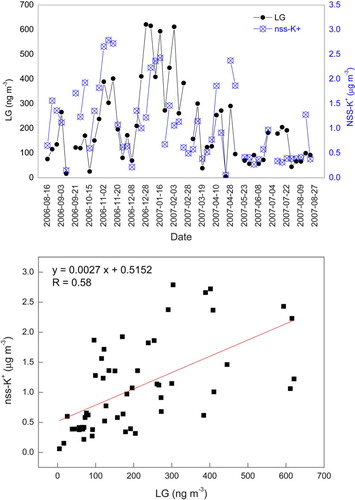
Potassium and levoglucosan are commonly used as source tracers for biomass burning activities (Andreae and Merlet, Citation2001). Non-sea-salt potassium (nss-K+, Cnss-K +=CK +−0.0355*CNa +) (Lai et al., Citation2007 and references therein) concentrations were used to exclude the influence of potassium derived from sea-salt. In a previous study, good correlation between nss-K+ and levoglucosan in PM10 was observed in GZ (daytime: r=0.89; nighttime: r=0.88) (Sang et al., Citation2011). Significant build-up of nss-K+ and levoglucosan concentrations was observed during the two biomass burning episodes in this study. The temporal variation and correlation plot of nss-K+ and levoglucosan in ZQ during the measurement period are shown in . The concentrations of nss-K+ varied between 0.06 and 2.79 µg m−3 (mean = 1.07 µg m−3). It is noteworthy that enhancements in both nss-K+ and levoglucosan concentrations at ZQ were observed during the episode days (2, 8 and 14 November 2006 as well as 4, 10 and 16 January 2007). Fair correlations between levoglucosan and nss-K+ were observed at ZQ (r=0.60) and PU (r=0.60), while the correlations at GZ and HT were rather poor, indicating there were other potassium sources at these sites. It should be noted that the correlations between nss-K+ and levoglucosan in spring (r=0.72), autumn (r=0.78) and winter (r=0.72) were higher than in summer (r=0.52) (). Strong correlations (r=0.95) were observed between levoglucosan and mannosan at the four sampling sites, suggesting that both species were derived from the same sources, mainly biomass burning emission.
Fig. 5 Temporal variation (a) and correlation plot (b) of two biomass burning tracers (nss-K+ and levoglucosan) in ZQ during the measurement period.
The ratio of levoglucosan to mannosan (LG/MN) has been proposed as an indicator for different biomass fuel types (Engling et al., Citation2009). For example, LG/MN ratios were found to be moderately high for hardwoods (ratio 14–15) and low (ratio 3–5) for softwoods in Austria (Schmidl et al., 2008b), while a higher LG/MN ratio of 27 was obtained from controlled field burning of rice straw (Engling et al., Citation2009). In this study, LG/MN ratios were relatively high, ranging from 0.43 to 56.9 with an average of 14.7±7.9, indicating that the biomass burning aerosol was likely affected by a mixture of biomass burning emissions including burning of hard wood and/or agricultural residues such as rice straw as well as some other plant materials (e.g. leaves, weeds).
3.4. Comparison of levoglucosan levels with other Asian cities
The levoglucosan concentrations measured in this study were compared with those reported for other Asian cities in recent studies (). The studies in China mainly focused on megacities, for example, Beijing, and Hong Kong (Zhang et al., Citation2008; Sang et al., Citation2011), and no seasonal and spatial distributions were reported so far. Yang et al. (Citation2012) related fungal tracers to biomass burning emissions and found that the concentration of levoglucosan in PM2.5 was on average 79.6 ng m−3 at Chengdu City in the Sichuan Basin. The value was close to the lowest level in PM10 measured in Beijing, ranging from 60 to 1960 ng m−3 (Zhang et al., Citation2008). In contrast, lower levoglucosan concentrations were often observed in northern Asian countries, which were as low as 16 ng m−3 in Sapporo, Japan (Aggarwal and Kawamura, Citation2009) or ranged from 1.42 to 66.13 ng m−3 in Incheon, Korea (Choi et al., Citation2012). Due to large numbers of forest fires and biomass burning events in southern and southeastern Asia, the concentrations of levoglucosan were often much higher and even reached some µg m−3. For example, Latif et al. (Citation2011) reported that the levoglucosan concentrations in an agricultural area ranged from 39.2 to 40.2 µg m−3 in Bangi, Malaysia. An average of 4.95 µg m−3 was also observed in the sub-urban area of Bangi (south of Kuala Lumpur) (Latif et al., Citation2011). The concentrations of levoglucosan at urban sites in other Southeast Asian countries (e.g. Thailand, Tsai et al., Citation2010) were also higher than those measured in the PRD region.
Table 7. Comparison of levoglucosan concentrations measured in various Asian countries
4. Summary and conclusions
This study reports for the first time the seasonal and spatial variations of anhydrosugars in the PRD region, China. The biomass burning aerosols in ZQ and GZ were mainly derived from local biomass burning activities, while at PU and HT they were mainly advected from South/Southeast Asia. Contributions of biomass burning emissions to TOC mass were as high as 33%, specifically during winter. Strong correlations were observed between levoglucosan and mannosan at the four sampling sites, indicating that both species originated from the same source, that is, biomass burning emission. In addition, the high LG/MN ratios suggest that the biomass burning aerosol was possibly affected by burning of hard wood and likely from field burning of agricultural residues, such as rice straw, as well. These findings are critical for more accurate source apportionment of aerosol pollution in the PRD region.
5. Acknowledgements
This study is partly supported by the Chinese Academy of Sciences (KZCX2-YW-BR-10), the Research Grants Council of Hong Kong (PolyU5197/05E), National Natural Science Foundation of China (41105083), Guangdong Natural Science Foundation (S2011040005259 and S2012010009824) and supported by the open fund of State Key Laboratory of Loess and Quaternary Geology, Institute of Earth Environment, CAS (SKLLQG0808 and SKLLQG0902).
Related Research Data
References
- Aggarwal S. G. , Kawamura K . Carbonaceous and inorganic composition in long-range transported aerosols over northern Japan: implication for aging of water-soluble organic fraction. Atmos. Environ. 2009; 43: 2532–2540.
- Aggarwal S. G. , Kawamura K. , Umarji G. S. , Tachibana E. , Patil R. S. , co-authors . Organic and inorganic markers and stable C-, N-isotopic compositions of tropical coastal aerosols from megacity Mumbai: sources of organic aerosols and atmospheric processing. Atmos. Chem. Phys. 2013; 13: 4667–4680.
- Andreae M. O. , Merlet P . Emission of trace gases and aerosols from biomass burning. Global Biogeochem. Cycles. 2001; 15: 955–966.
- Cao J. J. , Lee S. C. , Ho K. F. , Zhang X. Y. , Zou S. C. , co-authors . Characteristics of carbonaceous aerosol in Pearl River Delta Region, China during 2001 winter period. Atmos. Environ. 2003; 37: 1451–1460.
- Chen B. , Andersson A. , Lee M. , Kirillova E. N. , Xiao Q. , co-authors . Source forensics of black carbon aerosols from China. Environ. Sci. Technol. 2013; 47: 9102–9108. [PubMed Abstract].
- Choi J. K. , Heo J. B. , Ban S. J. , Yi S. M. , Zoh K. D . Chemical characteristics of PM2.5 aerosol in Incheon, Korea. Atmos. Environ. 2012; 60: 583–592.
- Chow J. C. , Watson J. G. , Chen L. W. A. , Arnott W. P. , Moosmuller H . Equivalence of elemental carbon by thermal/optical reflectance and transmittance with different temperature protocols. Environ. Sci. Technol. 2004; 38: 4414–4422.
- Chow J. C. , Watson J. G. , Chen L. W. A. , Paredes-Miranda G. , Chang M. C. O. , co-authors . Refining temperature measures in thermal/optical carbon analysis. Atmos. Chem. Phys. 2005; 5: 2961–2972.
- Decesari S. , Fuzzi S. , Facchini M. C. , Mircea M. , Emblico L. , co-authors . Characterization of the organic composition of aerosols from Rondônia, Brazil, during the LBA-SMOCC 2002 experiment and its representation through model compounds. Atmos. Chem. Phys. 2006; 6: 375–402.
- Dhammapala R. , Claiborn C. , Jimenez J. , Corkill J. , Gullett B. , co-authors . Emission factors of PAHs, methoxyphenols, levoglucosan, elemental carbon and organic carbon from simulated wheat and Kentucky bluegrass stubble burns. Atmos. Environ. 2007; 41: 2660–2669.
- Engling G. , Carrico C. M. , Kreldenweis S. M. , Collett J. L. , Day D. E. , co-authors . Determination of levoglucosan in biomass combustion aerosol by high-performance anion-exchange chromatography with pulsed amperometric detection. Atmos. Environ. 2006; 40: 299–S311.
- Engling G. , Lee J. J. , Tsai Y. W. , Lung S. C. C. , Chou C. C. K. , co-authors . Size-resolved anhydrosugar composition in smoke aerosol from controlled field burning of rice straw. Aerosol Sci. Technol. 2009; 43: 662–672.
- Fraser M. P. , Lakshmanan K . Using levoglucosan as a molecular marker for the long-range transport of biomass combustion aerosols. Environ. Sci. Technol. 2000; 34: 4560–4564.
- Gadde B. , Bonnet S. , Menke C. , Garivait S . Air pollutant emissions from rice straw open field burning in India, Thailand and the Philippines. Environ. Pollut. 2009; 157: 1554–1558.
- Hays M. D. , Fine P. M. , Geron C. D. , Kleeman M. J. , Gullett B. K . Open burning of agricultural biomass: physical and chemical properties of particle-phase emissions. Atmos. Environ. 2005; 39: 6747–6764.
- Hennigan C. J. , Sullivan A. P. , Collett J. L. , Robinson A. L . Levoglucosan stability in biomass burning particles exposed to hydroxyl radicals. Geophys. Res. Lett. 2010; 37: L09806.
- Hoffmann D. , Tilgner A. , Iinuma Y. , Herrmann H . Atmospheric stability of levoglucosan: a detailed laboratory and modeling study. Environ. Sci. Technol. 2010; 44: 694–699.
- Huang H. , Ho K. F. , Lee S. C. , Tsang P. K. , Ho S. S. H. , co-authors . Characteristics of carbonaceous aerosol in PM2.5: Pearl River Delta Region, China. Atmos. Res. 2012; 104–105: 227–236.
- Iinuma Y. , Engling G. , Puxbaum H. , Herrmann H . A highly resolved anion-exchange chromatographic method for determination of saccharidic tracers for biomass combustion and primary bio-particles in atmospheric aerosol. Atmos. Environ. 2009; 43: 1367–1371.
- IPCC. Climate Change 2001: The Scientific Basis, Contribution of Working Group I to the Third Assessment Report of the Intergovernmental Panel on Climate Change. 2001; New York: Cambridge University Press.
- Kim Oanh N. T. , Ly B. T. , Tipayarom D. , Manandhar B. R. , Prapat P. , co-authors . Characterization of particulate matter emission from open burning of rice straw. Atmos. Environ. 2011; 45: 493–502.
- Kirillova E. N. , Andersson A. , Sheesley R. J. , Krusa M. , Praveen P. S. , co-authors . 13C- and 14C-based study of sources and atmospheric processing of water-soluble organic carbon (WSOC) in South Asian aerosols. J. Geophys. Res. 2013; 118: 614–626.
- Kumagai K. , Iijima A. , Shimoda M. , Saitoh Y. , Kozawa K. , co-authors . Determination of dicarboxylic acids and levoglucosan in fine particles in the Kanto Plain, Japan, for source apportionment of organic aerosols. Aerosol Air. Qual. Res. 2010; 10: 282–291.
- Lai S. C. , Zou S. C. , Cao J. J. , Lee S. C. , Ho K. F . Characterizing ionic species in PM2.5 and PM10 in four Pearl River Delta cities, South China. J. Environ. Sci-China. 2007; 19: 939–947.
- Latif M. T. , Anuwar N. Y. , Srithawirat T. , Razak I. S. , Ramli N. A . Composition of levoglucosan and surfactants in atmospheric aerosols from biomass burning. Aerosol Air. Qual. Res. 2011; 11: 837–845.
- Lawson D. R. , Winchester J. W . Sulfur, potassium, and phosphorus associations in aerosols from South-American tropical rain forests. J. Geophys. Res. 1979; 84: 3723–3727.
- Mazzoleni L. R. , Zielinska B. , Moosmueller H . Emissions of levoglucosan, methoxy phenols, and organic acids from prescribed burns, laboratory combustion of wildland fuels, and residential wood combustion. Environ. Sci. Technol. 2007; 41: 2115–2122.
- Morales J. A. , Pirela D. , Durban J . Determination of the levels of Na, K, Ca, Mg, Fe, Zn and Cu in aerosols of the western Venezuelan savannah region. Sci. Total Environ. 1996; 180: 155–164.
- Pashynska V. , Vermeylen R. , Vas G. , Maenhaut W. , Claeys M . Development of a gas chromatographic/ion trap mass spectrometric method for the determination of levoglucosan and saccharidic compounds in atmospheric aerosols. Application to urban aerosols. J. Mass Spectrom. 2002; 37: 1249–1257.
- Puxbaum H. , Caseiro A. , Sanchez-Ochoa A. , Kasper-Giebl A. , Claeys M. , co-authors . Levoglucosan levels at background sites in Europe for assessing the impact of biomass combustion on the European aerosol background. J. Geophys. Res-Atmos. 2007; 112: 23S05.
- Ramdahl T . Retene e a molecular marker of wood combustion in ambient air. Nature. 1983; 306: 580–582.
- Sang X. F. , Chan C. Y. , Engling G. , Chan L. Y. , Wang X. M. , co-authors . Levoglucosan enhancement in ambient aerosol during springtime transport events of biomass burning smoke to Southeast China. Tellus B. 2011; 63: 129–139.
- Saxena P. , Hildemann L. M. , Mcmurry P. H. , Seinfeld J. H . Organics alter hygroscopic behavior of atmospheric particles. J. Geophys. Res-Atmos. 1995; 100: 18755–18770.
- Schauer J. J. , Kleeman M. J. , Cass G. R. , Simoneit B. R. T . Measurement of emissions from air pollution sources. 1. C-1 through C-29 organic compounds from meat charbroiling. Environ. Sci. Technol. 1999; 33: 1566–1577.
- Schauer J. J. , Kleeman M. J. , Cass G. R. , Simoneit B. R. T . Measurement of emissions from air pollution sources. 4. C-1-C-27 organic compounds from cooking with seed oils. Environ. Sci. Technol. 2002; 36: 567–575.
- Schmidl C. , Bauer H. , Dattler A. , Hitzenberger R. , Weissenboeck G. , co-authors . Chemical characterisation of particle emissions from burning leaves. Atmos. Environ. 2008a; 42: 9070–9079.
- Schmidl C. , Marr L. L. , Caseiro A. , Kotianova P. , Berner A. , co-authors . Chemical characterisation of fine particle emissions from wood stove combustion of common woods growing in mid-European Alpine regions. Atmos. Environ. 2008b; 42: 126–141.
- Shafizadeh F. , Furneaux R. H. , Cochran T. G. , Scholl J. P. , Sakai Y . Production of levoglucosan and glucose from pyrolysis of cellulosic materials. J. Appl. Polym. Sci. 1979; 23: 3525–3539.
- Sheesley R. J. , Schauer J. J. , Chowdhury Z. , Cass G. R. , Simoneit B. R . Characterization of organic aerosols emitted from the combustion of biomass indigenous to South Asia. Geophys. Res-Atmos. 2003; 108: 4285.
- Simoneit B. R. T. , Elias V. O. , Kobayashi M. , Kawamura K. , Rushdi A. I. , co-authors . Sugars – dominant water-soluble organic compounds in soils and characterization as tracers in atmospheric particulate matter. Environ. Sci. Technol. 2004; 38: 5939–5949. [PubMed Abstract].
- Simoneit B. R. T. , Rogge W. F. , Mazurek M. A. , Standley L. J. , Hildemann L. M. , co-authors . Lignin pyrolysis products, lignans, and resin acids as specific tracers of plant classes in emissions from biomass combustion. Environ. Sci. Technol. 1993; 27: 2533–2541.
- Simoneit B. R. T. , Schauer J. J. , Nolte C. G. , Oros D. R. , Elias V. O. , co-authors . Levoglucosan, a tracer for cellulose in biomass burning and atmospheric particles. Atmos. Environ. 1999; 33: 173–182.
- Simpson C. D. , Paulsen M. , Dills R. L. , Liu S. , Kalman D. A . Determination of methoxyphenols in ambient atmospheric particulate matter: tracers for wood combustion. Environ. Sci. Technol. 2005; 39: 631–637.
- Streets D. G. , Bond T. C. , Carmichael G. R. , Fernandes S. D. , Fu Q. , co-authors . An inventory of gaseous and primary aerosol emissions in Asia in the year 2000. J. Geophys. Res-Atmos. 2003; 108: 21, 8890.
- Sullivan A. P. , Holden A. S. , Patterson L. A. , McMeeking G. R. , Kreidenweis S. M. , co-authors . A method for smoke marker measurements and its potential application for determining the contribution of biomass burning from wildfires and prescribed fires to ambient PM2.5 organic carbon. J. Geophys. Res-Atmos. 2008; 113: 22302.
- Temesi D. , Molnar A. , Meszaros E. , Feczko T . Seasonal and diurnal variation in the size distribution of fine carbonaceous particles over rural Hungary. Atmos. Environ. 2003; 37: 139–146.
- Tsai Y. I. , Sopajaree K. , Chotruksa A. , Wu H.-C. , Kuo S.-C . Source indicators of biomass burning associated with inorganic salts and carboxylates in dry season ambient aerosol in Chiang Mai Basin, Thailand. Atmos. Environ. 2010; 78: 93–104.
- Viana M. , Maenhaut W. , ten Brink H. M. , Chi X. , Weijers E. , co-authors . Comparative analysis of organic and elemental carbon concentrations in carbonaceous aerosols in three European cities. Atmos. Environ. 2007; 41: 5972–5983.
- Yan X. Y. , Ohara T. , Akimoto H . Bottom-up estimate of biomass burning in mainland China. Atmos. Environ. 2006; 40: 5262–5273.
- Yang L. , Nguyen D. M. , Jia S. , Reid J. S. , Yu L. E . Impacts of biomass burning smoke on the distributions and concentrations of C2–C5 dicarboxylic acids and dicarboxylates in a tropical urban environment. Atmos. Environ. 2013; 78: 211–218.
- Yang Y. H. , Chan C. Y. , Tao J. , Lin M. , Engling G. , co-authors . Observation of elevated fungal tracers due to biomass burning in the Sichuan Basin at Chengdu City, China. Sci. Total Environ. 2012; 431: 68–77. [PubMed Abstract].
- Yevich R. , Logan J. A . An assessment of biofuel use and burning of agricultural waste in the developing world. Global Biogeochem. Cycles. 2003; 17: 1095.
- Zdrahal Z. , Oliveira J. , Vermeylen R. , Claeys M. , Maenhaut W . Improved method for quantifying levoglucosan and related monosaccharide anhydrides in atmospheric aerosols and application to samples from urban and tropical locations. Environ. Sci. Technol. 2002; 36: 747–753.
- Zhang T. , Claeys M. , Cachier H. , Dong S. P. , Wang W. , co-authors . Identification and estimation of the biomass burning contribution to Beijing aerosol using levoglucosan as a molecular marker. Atmos. Environ. 2008; 42: 7013–7021.
- Zhang X. , Hecobian A. , Zheng M. , Frank N. H. , Weber R. J . Biomass burning impact on PM2.5 over the southeastern US during 2007: integrating chemically speciated FRM filter measurements, MODIS fire counts and PMF analysis. Atmos. Chem. Phys. 2010a; 10: 6839–6853.
- Zhang Y. N. , Zhang Z. S. , Chan C. Y. , Engling G. , Sang X. F. , co-authors . Levoglucosan and carbonaceous species in the background aerosol of coastal southeast China: case study on transport of biomass burning smoke from the Philippines. Environ. Sci. Pollut. Res. Int. 2012; 19: 244–255. [PubMed Abstract].
- Zhang Y. X. , Shao M. , Zhang Y. H. , Zeng L. M. , He L. Y. , co-authors . Source profiles of particulate organic matters emitted from cereal straw burnings. J. Environ. Sci-China. 2007; 19: 167–175. [PubMed Abstract].
- Zhang Z. S. , Engling G. , Lin C. Y. , Chou C. C. K. , Lung S. C. C. , co-authors . Chemical speciation, transport and contribution of biomass burning smoke to ambient aerosol in Guangzhou, a mega city of China. Atmos. Environ. 2010b; 44: 3187–3195.