
Abstract
During summer, large amounts of mineral dust are emitted and transported from North Africa over the tropical North Atlantic towards the Caribbean with the exact quantity varying greatly from year to year. Much effort has been made to explain the variability of summer season mineral dust load, for example, by relating dust variability to teleconnection indices such as ENSO and the NAO. However, only weak relationships between such climate indices and the abundance of mineral dust have been found. In this work, we demonstrate the role of the near-surface convergence zone over West Africa in controlling dust load and transport of mineral dust. We apply the ‘Center of Action’ approach to obtain indices that quantify the movement and strength of the convergence zone using NCEP/NCAR Reanalysis data. The latitudinal position of the convergence zone is significantly correlated with the quantity of mineral dust at Barbados over the period 1965–2003 (r=−0.47). A southward displacement of the convergence zone is associated with both increased near-surface flow and decreased precipitation over the dust source regions of the southern Saharan desert, Sahel and Lake Chad. This in turn reduces soil moisture and vegetation, furthering the potential for dust emission. In contrast, the intensity of the convergence zone is not correlated with dust concentration at Barbados. We conclude that the coupling of changes in near-surface winds with changes in precipitation in source regions driven by a southward movement of the convergence zone most directly influence dust load at Barbados and over the tropical North Atlantic during summer.
1. Introduction
The importance of mineral dust for global climate (Andreae, Citation1996; Sokolik and Toon, Citation1996; Tegen et al., Citation1996; Miller et al., Citation2004) and biogeochemistry (Swap et al., Citation1992; Herwitz et al., Citation1996; Jickells, Citation1999; Baker et al., Citation2006; Koren et al., Citation2006; Muhs et al., Citation2007) has been increasingly realised, leading to an exponential growth in peer-reviewed articles on Saharan Mineral Dust (Kaufman et al., Citation2005). Mineral dust impacts climate by directly absorbing and reflecting radiation (Sokolik and Toon, Citation1996; Tegen et al., Citation1996). Indirect effects occur as dust changes the properties of clouds, including droplet concentration (Twomey, Citation1977), cloud lifetime (Albrecht, Citation1989), cloud colour, precipitation efficiency and the spatial distribution of clouds.
Analysis of observations, reanalysis and models suggest that mineral dust cools the surface and upper troposphere while warming the layers of atmosphere in which it resides (Carlson and Benjamin, Citation1980; Lau and Kim, Citation2007a; Dunion and Marron, Citation2008; Evan and Mukhopadhyay, Citation2010; Wang, Citation2010). Such changes in thermodynamic profiles can lead to changes in circulation, which may then impact mineral dust emission creating a dust–climate feedback loop (Evan et al., Citation2011).
Much attention has been paid in the literature to mineral dust originating from the Sahara, as the Sahara represents the dominant global dust source (Prospero et al., Citation2002; Washington et al., Citation2003). The proximity of the Sahara to the North Atlantic Ocean and the maximum development region for tropical cyclones leads to complex interactions (Dunion and Velden, Citation2004; Evan et al., Citation2006a; Lau and Kim, Citation2007a, Citation2007b; Braun, Citation2010; Wang et al., Citation2012). Mineral dust is thought to impact tropical cyclones by cooling the North Atlantic Ocean, directly change cyclone structure and composition through entrainment of dry air, and indirectly change the circulation and physical environment in which cyclones form and develop.
The mineral dust loading in the atmosphere in any given season varies greatly from year to year (Prospero and Lamb, Citation2003). Explaining such interannual variability has been the focus of prior work, with many studies focusing on the quantity of mineral dust traversing the Atlantic Ocean and reaching the Americas. For the winter season, observations of mineral dust over the Atlantic Ocean and at Barbados have been related to variability in the North Atlantic Oscillation (NAO) (Moulin et al., Citation1997; Chiapello and Moulin, Citation2002; Evan et al., Citation2006b; Nakamae and Shiotani, Citation2013). Similar relationships between the NAO and mineral dust have been diagnosed from global chemistry and transport model results (Ginoux et al., Citation2004). Riemer et al. (Citation2006) refined this result further by showing that variability in the position of the Azores High (a key component of the NAO) is important for winter export and transport of mineral dust.
Aforementioned relationships between climate indices and mineral dust found for winter do not hold in boreal summer, the season in which mineral dust load is maximised over the North Atlantic (Cakmur et al., Citation2001; Engelstaedter and Washington, Citation2007b; De Graaf et al., Citation2010). For example, Riemer et al. (Citation2006) demonstrated that the relationship between the NAO and mineral dust observed in winter does not exist in summer. Some evidence suggests that the variability of mineral dust in the Atlantic during boreal summer can be related to climate variability in the Pacific. Doherty et al. (Citation2008) demonstrated a relationship between the position of the Hawaiian High and mineral dust transport. Prospero and Lamb (Citation2003) related mineral dust in Barbados and an El Niño-Southern Oscillation (ENSO) index. Schwanghart and Schütt (Citation2008) found no connection between synoptic scale systems and dust emission in summer, instead suggesting that dust emission in West Africa is connected to regional convection. In general, during summer relationships between mineral dust load and global teleconnective indices are weaker than those found in winter and more localised, and regional climate processes may be of importance.
Doherty et al. (Citation2012) developed a new method to explain variability of mineral dust load in the Atlantic by attributing it to changes in the latitudinal position of the band of near-surface convergence over West Africa, related to the Intertropical Convergence Zone (ITCZ). The analysis in Doherty et al. (Citation2012) revealed that, for the winter season, southward shifts in the belt of convergence increase winds over key source regions, increasing emissions of mineral dust. Likewise, southward shifts in the belt of convergence appear to further augment dust loading at Barbados through enhanced westerly flow across the Atlantic Ocean. While it is expected that the mechanisms that introduce mineral dust load variability in summer will be different, we will show in this work that the same approach can be successfully applied to the boreal summer season.
Globally, the ITCZ is a belt of inclement weather that occurs where the trade winds converge and form the ascending branch of the Hadley Circulation. Annually, the ITCZ moves north and south following the progression of annual solar maximum (Folland et al., Citation1991). Over the ocean the ITCZ circulation is relatively simple whereas over land the structure of the ITCZ becomes more complicated, particularly over West Africa. The south-westerly winds that converge with north-easterly winds blowing off the Sahara to form the ITCZ are a key component of the West Africa Monsoon (WAM) system. As such, over West Africa the annual northward migration of the ITCZ, and in turn the WAM, brings critical seasonal rainfall to areas of the Sahel and southern Sahara (Nicholson, Citation2009a), the majority of which falls south of the region of maximum convergence. In recent decades the ITCZ over West Africa has been observed to shift northward (Fontaine et al., Citation2011), increasing rainfall over the Sahel. Over Western Africa the ITCZ is an important driver of regional climate, controlling the distribution of winds and precipitation, which can impact soil and vegetation. It is reasonable then to hypothesise that the position and intensity of the ITCZ will likely impact mineral dust emission and transport. Certain aspects of the relationship between the ITCZ and mineral dust in the atmosphere have been considered previously. Radiative forcing from mineral dust has been shown to shift the location and strength of the tropical rainband over the Atlantic Ocean (Huang et al., Citation2009) and may impact the ITCZ-monsoon circulation over Africa (Lau et al., Citation2009; Kim et al., Citation2010; Wilcox et al., Citation2010).
Atmospheric loading of dust in North Africa is paradoxically maximised in the summer season when the annual northward migration of the ITCZ results in the maximum annual rainfall in the semi-arid lands of the Sahel (Moulin et al., Citation1997; Evan et al., Citation2006b). Precipitation reduces dust load in multiple ways (Tegen and Fung, Citation1994; Zender et al., Citation2003) both directly and indirectly. Where precipitation occurs concurrently with mineral dust aerosols, the dust is removed by wet deposition (Engelstaedter et al., Citation2009). Precipitation leads to plant growth (Eklundh and Olsson, Citation2003; Herrmann et al., Citation2005; Olsson et al., Citation2005), which in turn increases root activity, reduces soil mobility, improves soil quality and ultimately decreases dust emission (Nicholson et al., Citation1998).
Recent observational (Fiedler et al., Citation2013), modelling (Marsham et al., Citation2011; Knippertz and Todd, Citation2012; Heinold et al., Citation2013) and field studies (Marsham et al., Citation2013; Todd et al., Citation2013) highlight the importance of mesoscale processes and small-scale localised variability in dust sources (Schepanski et al., Citation2009, Citation2012). For example, convectively induced cold pools, breakdowns of low level jets, and low-level jet like structures from aging cold pools, have all been linked to individual dust emission events (Fiedler et al., Citation2013; Heinold et al., Citation2013). Dust emission is indirectly assessed in this work as a necessary pre-condition for observed dust loading in source regions. On seasonal scales, wind, precipitation, vegetation and soil conditions reflect the aggregate of mesoscale and synoptic scale events and represent key controls on dust load in source regions.
The objective of this work is to (1) assess the relationship between variability in the position and strength of the convergence zone over West Africa and the quantity of mineral dust over the North Atlantic Ocean and (2) explain the physical mechanisms by which changes in the convergence zone over West Africa impacts emission and transport of mineral dust. The main contribution of this paper is to demonstrate that shifts in the position of the convergence zone over West Africa directly impact mineral dust load by altering both surface conditions and near-surface atmospheric conditions in a way that allows for increased mineral dust emission and transport. We consider processes in dust source regions and transport regions independently, and find that processes in the dust source regions are most important to mineral dust load over the North Atlantic and into the Caribbean.
2. Methods and data
2.1. Mineral dust
To quantify the amount of mineral dust in the atmosphere, we utilise two datasets; a long-term surface based record of dust concentrations in Barbados (1965–2003) and a satellite derived measure of optical thickness from the Advance Very High Resolution Radiometer (AVHRR) instrument over the tropical North Atlantic (1982–2010).
The surface record of mineral dust concentrations in Barbados is the longest continuous observation of aerosols, and its record has been extensively studied (Rydell and Prospero, Citation1972; Prospero and Nees, Citation1977; Glaccum and Prospero, Citation1980; Prospero and Carlson, Citation1980; Prospero and Nees, Citation1986; Savoie et al., Citation1987; Moulin et al., Citation1997; Chiapello et al., Citation1999, Citation2005; Prospero and Lamb, Citation2003; Ginoux et al., Citation2004; Prospero et al., Citation2008; Trapp et al., Citation2010; Ridley et al., Citation2012, Citation2014). Barbados is an ideal location to study mineral dust transport as the island is the eastern-most point of the Americas in the Caribbean, and thus the first land encountered by mineral dust that has traversed the North Atlantic Ocean. Barbados is situated approximately 4800 km west of the western-most point of Africa. Monthly values of mineral dust concentrations are available from August 1965 through September 2003. In this study, only the years in which all 4 months (JJAS) of the summer season have data are used in calculations.
To determine the spatial distribution of mineral dust we utilise an AVHRR-based dust aerosol optical thickness (AOT) (Evan et al., Citation2006a). The dataset provides monthly mean AOT with a resolution of 1°×1° over the tropical North Atlantic Ocean (0°N to 25°N and 65°W to 10°W). The algorithm used to create the dataset is described fully in Evan et al. (Citation2006a), and a general discussion and climatology of the dataset is presented in Evan et al. (Citation2006b). This dataset was chosen as it has been calibrated for the tropical North Atlantic Ocean to detect optically thick dust over ocean surfaces, was cross-platform calibrating using AERONET, Metosat and TOMS-AI, and is of a long record (1982–2010) coincident with much of the Barbados record. The major advantage of this product is that it is able to detect optically thick dust storms (AOT >2), which many algorithms incorrectly identify as clouds (Evan et al., Citation2006a). This feature is particularly important in summer (JJAS) when optically thick dust storms are most prevalent.
2.2. Gridded datasets
We use several gridded reanalysis products to characterise atmospheric and surface conditions. Wind data is taken from NCEP Reanalysis (Kalnay et al., Citation1996). NCEP Reanalysis data is available monthly from 1948 to the present, although we constrain our analysis to the period 1965–2010, and has a resolution of 2.5°×2.5°. Monthly averages of winds at 925 hPa from NCEP Reanalysis are used to calculate divergence, which is needed for the near-surface convergence zone Center of Action (COA) approach as described in Section 2.3. The level of 925 hPa is chosen as convergence is maximised below 850 hPa (Nicholson, Citation2009a).
To represent precipitation, we use the Global Precipitation Climatology Project (GPCP) Version 2.2 Combined Precipitation Data Set (Adler et al., Citation2003). GPCP precipitation data is available from 1979 to 2010, with a resolution of 2.5°×2.5°.
The Palmer Drought Severity Index (PDSI) dataset is used to represent soil conditions (Dai et al., Citation2004). PDSI data is available from 1870 to 2005, although we constrain our analysis to the period 1965–2003. PDSI has a resolution of 2.5°×2.5°. A PDSI value of 0 represents the mean state of soil moisture. Negative values represent drought, with values of −3 and −4 representing severe and extreme droughts respectively. Positive values of PDSI represent higher than average soil moisture conditions.
To represent vegetation at the surface, the GIMMS Normalized Difference Vegetation Index (NDVI) dataset is used (Tucker et al., Citation2005). The NDVI is calculated using irradiance data from the AVHRR instrument carried aboard NOAA satellites. NDVI data is available over the period July 1981–December 2002 at a resolution of 0.25°×0.25°. Values of NDVI near zero represent surface conditions of barren rock or sand, with increasing values of NDVI representing more lushly vegetated surfaces. For example brush and Savannah-like terrains may have an NDVI value of between 0.2 and 0.4, and a tropical rainforest a value between 0.8 and 1.0.
Data was acquired from Physical Sciences Division of the Earth System Research Laboratory of NOAA (http://www.esrl.noaa.gov/psd/) with the exception of the AVHRR AOT record which was acquired from the University of California San Diego (http://evan.ucsd.edu/Data.html) and GIMMS NDVI which was acquired from the Asia-Pacific Data-Research Center (http://apdrc.soest.hawaii.edu/) via OPeNDaP.
2.3. WACZ as a centre of action
We apply the Centres of Action approach to the area of near-surface convergence associated with the ITCZ over West Africa in order to quantify its variability. The COA approach is a statistical method for evaluating gridded geophysical fields to identify the geographic centre of a geophysical feature, which occurs in roughly the same region, at the same time of year over climatic timescales. Examples of centres on which this method could reasonably be applied include the Azores High in a field of sea level pressure or the Indian Monsoon in a field of precipitation. In the COA approach time series are generated for the latitude, longitude and intensity of the core of the centre of interest. In this study, we follow after Doherty et al. (Citation2012) and use convergence as our geophysical field of relevance for the convergence zone.
We name our indices ‘West Africa Convergence Zone’ (WACZ) to avoid confusion with ambiguous terminology regarding the ‘ITCZ’ (Nicholson, Citation2009a), which arise due to the complexity of the dynamics over West Africa. Two zones of convergence are found over West Africa in summer, one poleward of the African Easterly Jet and the second, an equatorward band of convergence beneath the Tropical Easterly Jet. To highlight the ambiguity of the use of the term ITCZ in the literature, we note that Sultan et al. (Citation2003) and Parker et al. (Citation2005) and references therein refer to the southern convergence as the ITCZ, while Nicholson (Citation2009a) refer to the northern zone of convergence as the ITCZ. Ambiguous terminology is also applied the boundary near the surface where the northeast and southwest winds converge is referred to as the Intertropical Front (ITF) (Issa Lélé and Lamb, Citation2010) or the Intertropical Discontinuity (ITD) (Bou Karam et al., Citation2008).
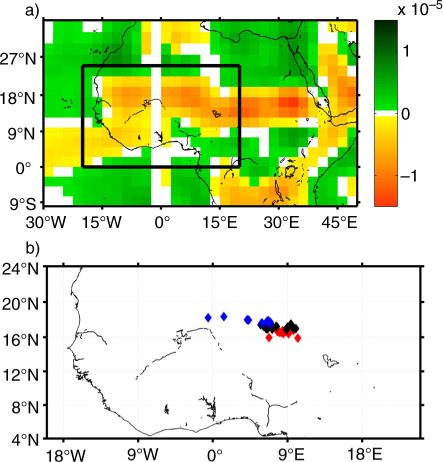
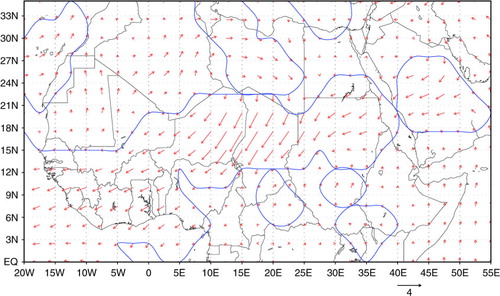
Here, convergence (negative values of divergence) is calculated at 925 hPa using winds from NCEP Reanalysis (Kalnay et al., Citation1996) over West Africa (0°N to25°N and 20°W to 20°E). This domain is outlined in black in a. a also shows the climatological mean of JJAS divergence from 1965 to 2003. The centre of the WACZ is just north of 18°N across much of West Africa before dipping southward near Lake Chad. The WACZ is the dominant feature over West Africa, with a well-known annual cycle, making it an ideal candidate for the COA approach.
Fig. 1 (a) Mean summer (JJAS) divergence (s−1) at 925 hPa as computed from NCEP Reanalysis winds. The box over which the WACZ COA is computed is outlined in black. (b) Location of seasonal summer (JJAS) mean of WACZ COA over the period 1965–2003. Blue diamonds represent the northern phase of WACZ COA, red diamonds represent southern phase of WACZ COA. The lowest quartile of seasonal data is identified as the ‘south phase’, which corresponds to the seasons when the WACZ was in a southerly position. The highest quartile of seasonal data is identified as the ‘north phase’, which corresponds to the seasons when the WACZ was in a northerly position. Black diamonds represent the middle 50% of seasons of WACZ COA.
The intensity index of the WACZ W
i is defined as an area-weighted divergence departure from a threshold value over the domain (I, J):1
where D
i,j
is the divergence value at 925 hPa at a grid point (i,j), D
t is the threshold divergence value (D
t=−5.0×10⁻⁵s−1). φ
i,j
is the latitude of grid point (i,j). δ=1 if (D
i,j
−D
t)>0 and δ=0 if (D
i,j
−D
t)<0. The latitudinal index W
φ
is defined as:2
The longitudinal index W λ is defined analogously. The location indices thus give divergence-weighted mean latitudinal and longitudinal positions of the WACZ. In summary, we obtain time series for three indices, one each representing the latitude, longitude and intensity of the WACZ. Combining the latitude and the longitude index provides the geographical location of the WACZ COA for mean JJAS seasons from 1965 to 2003 as shown in b.
2.4. Composite imaging analysis
We use composite images to show changes in environmental conditions associated with a change in phase of W φ, W λ or W i. For example, to see how changes in the latitudinal position index W φ impact regional wind circulation, the seasonal mean values of W φ of each year from 1963 to 2003 are ranked in ascending order. The lowest quartile (q25) of seasonal data is identified as the ‘south phase’, which corresponds to the seasons when the WACZ was in a southerly position. The highest quartile (q75) of seasonal data is identified as the ‘north phase’, which corresponds to the seasons when the WACZ was in a northerly position. All seasons of wind data that have been selected as southern (q25) or northern (q75) phases are then averaged to form a wind composite representing wind conditions for the south phase or the north phase, respectively. This approach can be repeated for other WACZ indices (W i, W λ) instead of W φ , and other environmental variables (e.g. AVHRR AOT, GPCP Precipitation, GIMMS NDVI, PDSI) instead of wind. Years used to generate the individual composite images are shown in Table and 2 . In this work, composite differences are generated by subtracting the north phase of a variable from the south phase of a variable. The direction of the composite differencing is chosen to show environmental conditions which are associated with maximum dust load over the Atlantic and Barbados.
Table 1. Years that were used to generate seasonal mean composite images of wind, AOT, precipitation and PDSI based on W φ
Table 2. Years that were used to generate seasonal mean composite images of wind, AOT and precipitation on based on W i
3. Results
3.1. Climatology of WACZ index during the boreal summer
a shows the latitudinal position of the WACZ (W φ ) during the summer season and adjacent months. The median value is indicated by a horizontal red bar. Skewness and spread are shown by the position of the 25th and 75th percentiles indicated by edges of the central box. Whiskers denote the spread of all non-outlying data with outliers indicated by red crosses. The WACZ moves steadily northward over West Africa in spring and summer, reaching its northernmost location on average in August. After September the WACZ shifts rapidly southward. Maximum year-to-year variability in the WACZ latitude index is observed in autumn.
Fig. 2 (a) Box-plot of monthly WACZ Latitude index (W φ ) and (b) precipitation over the Sahel (15°N to 25°N and 0° to 25°E) from GPCP for the summer season of June, July, August, September and adjacent months over the period of 1979–2010. Median value indicated by a horizontal red bar, edges of the central box represent the 25th and 75th percentiles. Whiskers denote the spread of all non-outlying data. Outliers are indicated with red crosses.
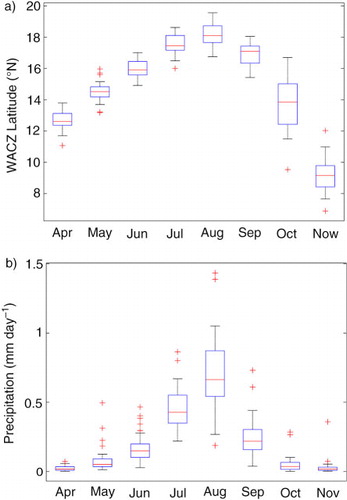
b represents mean Sahel precipitation averaged over the domain 15°N to 25°N and 0° to 25°E over the same time period. Precipitation begins as the WACZ moves northward in late spring and summer, and ends as the WACZ begins to move southward in fall. The WACZ latitude index appears to capture the seasonal precipitation cycle well, and our results are consistent with those presented in Nicholson (Citation2009a).
3.2. Relationship between mineral dust and climatic indices
3.2.1. Barbados mineral dust and the WACZ
Calculating the correlation coefficients of the time series of mineral dust concentration in Barbados and the three WACZ indices, we find that summer season mineral dust load is significantly correlated with both the latitudinal and longitudinal location index of the WACZ at α=0.01 as shown in . Since the WACZ index W φ increases with latitude, the observed negative correlation of W φ and mineral dust means that seasonal mineral dust load increases as the WACZ is displaced southward and seasonal mineral dust load decreases as the WACZ is displaced northward. We repeat this analysis using ERA-40 (r=−0.47, α<0.01) and ERAi (r=−0.41, α≈0.01) and find this result is not sensitive to the choice of reanalysis product used to calculate the WACZ. Likewise mineral dust increases as the WACZ moves eastward and decreases as the WACZ moves westward.
Table 3. Pearson product moment correlation coefficients between mean JJAS mineral dust concentrations at Barbados and climatic indices for JJAS season 1965–2003
The latitude and longitude indices of the WACZ are not independent of one another (r=−0.67). As seen in b, the WACZ is found to be further east when it is in its south phase and further west when it is in its north phase, suggesting that in the summer season the WACZ varies along a NW to SE axis. The NW location correlates to a reduction of mineral dust in Barbados and the SE location correlates to an increase in mineral dust at Barbados.
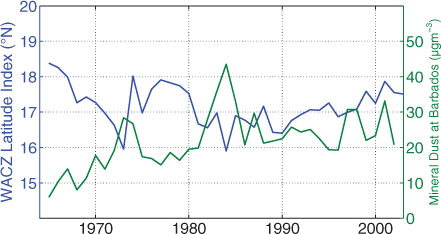
shows the temporal relationship between the latitude index of the WACZ and mineral dust load at Barbados. Mineral dust load at Barbados reaches its lowest value during the mid-1960s when the WACZ is found to be at its most northward location. Mineral dust reaches its peak in the mid-1980s when the WACZ reaches its most southward location.
Fig. 3 Time-series of JJAS seasonal WACZ Latitude index (W φ , blue) and mineral dust concentration at Barbados (green) over the period 1965-2003. Seasons in which a month or more of data is missing are excluded from the analysis.
also includes the correlation coefficients of summer season mineral dust concentration at Barbados and traditional climate indices such as the NAO or ENSO. The correlations with NAO and ENSO are not statistically significant.
3.2.2. Mineral dust in AVHRR AOT record and WACZ
The long-term record at Barbados (1965–2003) is of great value as its length allows us to examine interannual variability of dust transport to a location in the Caribbean region. Having established the relationship between an increase in dust concentration at Barbados and a southward displacement of the WACZ, next we seek to determine if this relationship exists over the rest of the North Atlantic Ocean. For greater spatial coverage we utilise the North Atlantic mineral dust AVHRR AOT product as described in Evan et al. (Citation2006a), which is available for the period 1982 to 2010.
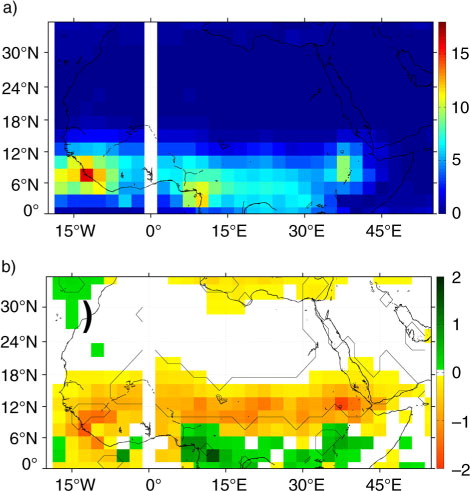
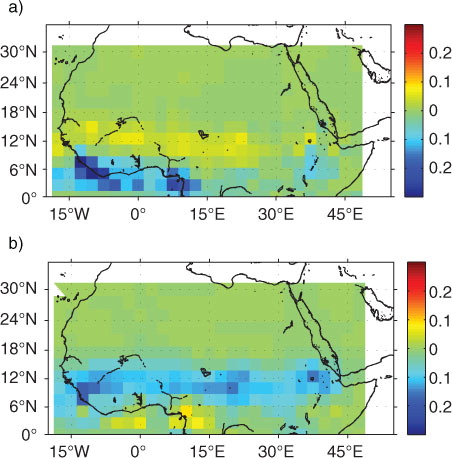
a shows the composite mean for AOT during summer in which the WACZ was in its south phase, as described in Section 2.4. A plume originating over Mauritania is evident, which extends west towards the Americas centred at or just slightly north of 16°N. b shows the corresponding composite mean of AOT in which the WACZ was in its north phase. Here we again note a plume forming west of Mauritania, extending westward towards the Americas centred near to 16°N; however, the AOT values are smaller. c is the difference in AOT, subtracting the north phase conditions shown in b from the south phase conditions shown in a representing conditions that lead to dust maximisation at Barbados. This indeed shows no shift in the location of the dust plume, but rather an increase in AOT over nearly all of the Tropical North Atlantic, with the AOT increasing by 0.2 to 0.3 in the centre of the plume as the WACZ shifts southward.
Fig. 4 (a) Composite mean of Evan AOT for the southern phase of summer (JJAS) seasons (q25) of the WACZ. (b) As in (a) but for the northern phase of WACZ latitude (q75). (c) The difference of (a) minus (b), that is, conditions of the WACZ latitude index for which dust load is maximised at Barbados. (d) First EOF mode of Evan AOT summer means, which explains 36% of total variance in the Evan AOT record. All composites and principle components are calculated over the period 1982 to 2010.

In order to assess the importance of this observed increase in AOT of the dust plume with southward migration of the WACZ, we apply the Empirical Orthogonal Function (EOF) method to the AOT data. Akin to Principle Component Analysis, EOF identifies both spatial patters and time series which correspond to the largest fraction of variability in the data. The first mode of the EOF (d) confirms that the southward movement of the WACZ is related to an increase of dust of the plume, rather than a movement of the plume. At all grid points the relative magnitude of the first EOF mode (which explains 36% of the total variance in the AOT record) is negative, suggesting that the AOT responds unidirectionally, either increasing or decreasing over the Tropical North Atlantic in a given summer. The principle component of this first EOF is statistically significantly correlated with the WACZ latitude at α≤0.01 (r=0.51), suggesting that southward movement of the WACZ is indeed coupled with the basin-wide increase in mineral dust.
The observed relationship of a southward movement of the WACZ and increases both in dust concentration at the surface at Barbados and in the widespread mineral dust load observed in the AVHRR record suggests a robust link between the position of the WACZ and mineral dust reaching the Caribbean.
In the remainder of this section, we will investigate the physical mechanisms by which the WACZ impacts mineral dust, first on dust load over source regions, and second through transport processes to the North Atlantic and Caribbean.
3.3. Processes in dust source regions
3.3.1. Precipitation in source regions
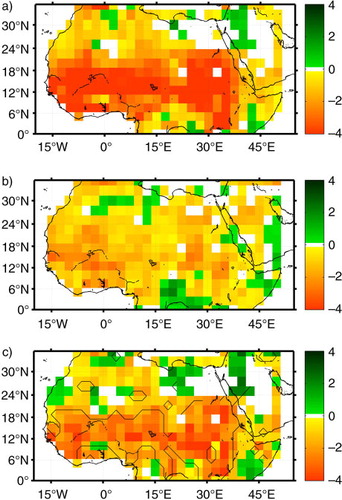
a shows the JJAS mean composite of precipitation for the northern phase of the WACZ. Maximum precipitation is observed in a band stretching from East Africa west toward the Atlantic. As the WACZ moves southward, so does the band of precipitation, as shown by the composite difference in b. Significant drying occurs over all of Africa between 10°N and 20°N (b), with the greatest reduction in precipitation occurring over the semi-arid Sahel region. Just north of the equator a slight increase in precipitation is noted, related to the southward shift of the WACZ. Thus, conditions in which mineral dust load is maximised in both Barbados and the North Atlantic coincide with a drying of the Sahel as the WACZ is in a south phase.
Fig. 5 (a) Composite mean JJAS precipitation during the southernmost latitude years of the WACZ (q25). (b) Difference in composite mean of GPCP precipitation. Differences are calculated by subtracting the seasonal summer mean (JJAS) of the northern most WACZ seasons (q75) from the seasonal summer mean (JJAS) of southern most WACZ seasons (q25). The difference represents the conditions of the WACZ latitude index for which dust load is maximised at Barbados. Units are mmday−1 from GPCP. All composites calculated over the period 1979–2003, black contour represent a significant difference at 10%.
EOF analysis confirms that the north-to-south movement of the precipitation belt represents the majority of variance in the GPCP precipitation product for the summer season. a shows the first mode, which represents 42% of the total variance, and b the second mode representing 12% of variance. The first mode and second mode shows a clear north–south dipole in precipitation, with sub-Saharan Africa and the Gulf of Guinea and equatorial Africa out of phase with each other. Both the first and second modes are significantly correlated with the WACZ latitude index at or below α=0.01. Regressing the first and second mode of precipitation together onto the WACZ latitude index results in a correlation of r=0.66 (not shown). The WACZ latitude index is indeed tightly related to the major modes of variability in precipitation over West Africa.
Fig. 6 (a) First EOF mode of GPCP seasonal JJAS precipitation over the period 1979–2010, mode one explains 42% of total GPCP variance. (b) As in (a) but for second mode of GPCP precipitation, which explains 12% of total GPCP variance.
While a widespread reduction in precipitation in the sensitive Sahel region is consistent with long-held theories of increased dust load during dry periods (Prospero and Nees, Citation1977; Prospero and Nees, Citation1986; Prospero and Lamb, Citation2003), it is not immediately clear how exactly this reduction in precipitation leads to changes in mineral dust load. Reduced precipitation can reduce removal by wet deposition of mineral dust, or it can lead to reductions in soil moisture and vegetation. The latter can allow for increased emission of mineral dust. To clarify which processes are most likely responsible for the increased dust load concurrent with reduced precipitation we next examine changes in vegetation and soil moisture tied to latitudinal shifts in the movement of the WACZ.
3.3.2. Soil moisture in the source region
PDSI is used to represent soil moisture conditions. a shows the composite of PDSI during JJAS seasons in which the WACZ is in its south mode, and b shows the composite of the north phase. Both north and south phases show drought-like conditions, reflecting the extreme drought that occurred from the 1970s through the early 1990s in sub-Saharan Africa. However, the south phase shows more extreme drying, with much of the Sahel experiencing values of −3 to −4 PDSI which represent severe to extreme drought. Subtracting the composite shown in b from the one in a we see over much of the Sahel and southern Sahara desert that drying of this region occurs concurrently with dust load maximisation, as the WACZ moves into its south phase. We are not able to present an EOF analysis of the PDSI due to many missing data points.
Fig. 7 (a) Composite mean of Palmer Drought Severity Index for south mode of WACZ (q25). (b) As in (a) but for north mode of WACZ (q75). (c) Composite difference of south mode minus the north mode. Differences are calculated by subtracting the seasonal summer mean (JJAS) of the northern most WACZ seasons (q75) from the seasonal summer mean (JJAS) of southern most WACZ seasons (q25). The Palmer Drought Severity Index is negative during drought conditions. The difference represents the conditions of the WACZ latitude index for which dust load is maximised at Barbados. All composites calculated over the period 1965–2003. Black contour represent a significant difference at 10%.
3.3.3. Vegetation in the source region
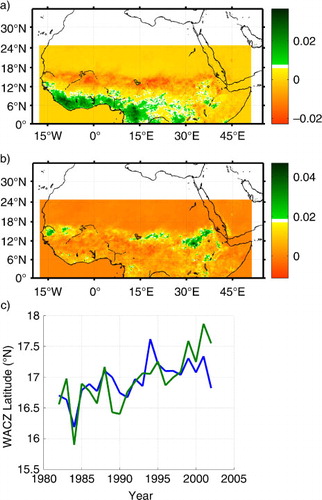
We use GIMMS NDVI as a high-resolution proxy for surface vegetation. In , reductions in vegetation are observed in the Sahel which shows the composite difference in NDVI for the south phase of the WACZ minus the north phase of the WACZ, highlighting changes that lead to dust load maximisation in Barbados. Vegetation is reduced in a band between 12°N and 18°N extending from the Atlantic Ocean to the Red Sea, suggesting a robust response in vegetation due to shifts in the latitudinal position of the WACZ. a and b show the first and second modes of the EOF analysis on NDVI for JJAS summer seasons. Mode 1 (39% of the variance) shows a clear north to south dipole, in which vegetation increases in the Sahel while decreasing to the south, or vice-versa. Mode 2 (12% of the variance) is related to variance in the vegetation of the very southern extent of the Sahara Desert. The principle components of both mode 1 and mode 2 are significantly correlated with the WACZ latitude index at α=0.01. Regressing the first and second modes of NDVI together onto the WACZ latitude index results in a correlation of r=0.68 (c), that is, changes in vegetation are directly related to the latitudinal position of the WACZ. A multi-decadal increasing trend in c is evident, reflecting a rebound from low-vegetation conditions during the drought in the 1980s.
Fig. 8 Difference in composite mean of GIMMS Normalized Difference Vegetation Index (NDVI). Differences are calculated by subtracting the seasonal JJAS mean of the northern most WACZ seasons (q75) from the seasonal JJAS mean southernmost WACZ seasons (q25). The difference represents the conditions of the WACZ latitude index for which dust load is maximised at Barbados. The NDVI is positive when more vegetation is present than the long-term mean and negative when there is less vegetation than the long-term mean. Composite difference calculated over the period 1982–2002. Black contour represent a significant difference at 10%.
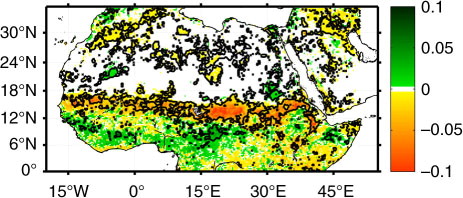
Fig. 9 (a) First EOF mode of NDVI seasonal JJAS mean over the period 1981–2002, mode one explains 39% of total NDVI variance. (b) As in (a) but for second mode of NDVI, which explains 12% of total NDVI variance. (c) Linear regression of the principle component of the first two modes (green line) onto the WACZ latitude index (W φ , blue line).
3.3.4. Near surface winds in the source region
shows the difference in 925 hPa winds between conditions when the WACZ is in the south mode and conditions when the WACZ is in the north mode. These differences represent conditions that occur coincidently with dust load maximisation at Barbados. An increase in the strength of the trade winds across the Sahel is evident, including a maximum strengthening near Lake Chad which is a major source for mineral dust aerosols (Washington et al., Citation2006). Comparison of , 7, 8 and 10 show that the area of increased winds is coincident with reductions in precipitation, soil moisture and vegetation, resulting in an ideal scenario favouring dust emission. Winds aloft (not shown) over West Africa show a similar increase in NE to SW flow, leading to an increase of export of emitted mineral dust particles.
Fig. 10 Difference in composite mean of NCEP Reanalysis winds (ms−1) at 925 hPa. Differences are calculated by subtracting the seasonal summer mean (JJAS) of the northern most WACZ seasons (q75) from the seasonal summer mean (JJAS) of southern most WACZ seasons (q25). The difference represents the conditions of the WACZ latitude index for which dust load is maximised at Barbados. All composites are calculated over the period 1965–2003; blue contour represent a significant difference at 10%.
In summary, we note that southward movement of the WACZ leads to significantly reduced precipitation in key mineral dust source regions during seasons in which the WACZ is in its south phase, reducing wet deposition removal of mineral dust in these regions. Reductions in soil moisture and ultimately vegetation follow the southern migration of the WACZ, enhancing the potential for dust emissions. Coincidently, increases in near-surface winds occur when the WACZ is shifted equatorward. We thus hypothesise that southern displacement of the WACZ is critical in increasing mineral dust emission by degradation of the surface soils and increased opportunities for emission via increases in near-surface wind.
3.4. Mechanisms impacting transport
Mineral dust emitted over Africa travels nearly 5000 km to reach Barbados and the Caribbean. Steering winds over the tropical North Atlantic control where the dust is transported once emitted, and stronger winds result in quicker transport to the Americas reducing gravitational settling and the chance of removal via wet deposition (Engelstaedter et al., Citation2009). Next we examine how changes in the latitudinal position of the WACZ impact steering currents aloft and precipitation over the tropical North Atlantic.
a (850 hPa), 11b (700 hPa) and 11c (500 hPa) show composite differences of the wind conditions aloft, which are calculated in the same manner as for to represent conditions in which dust load is maximised at Barbados and over the North Atlantic. While just south of the dust belt (around 16°N) there is significant strengthening of easterly winds between the equator and 10°N, in the centre of the dust belt we see no significant change in transport winds. The spatial mismatch of the wind augmentation and the location of maximum dust concentration suggest that the impacts of the movement of the WACZ on circulation are less important than its impacts in the source region. As shown in Section 3.3.1 and , increases in dust load can be linked to increased winds in the important source regions of the Sahel and southern Saharan desert.
Fig. 11 Difference in composite mean of NCEP Reanalysis winds at (a) 850 hPa, (b) 700 hPa and (c) 500 hPa. Differences are calculated by subtracting the seasonal summer mean (JJAS) of the northern most WACZ seasons (q75) from the seasonal summer mean (JJAS) of southern most WACZ seasons (q25). The difference represents the conditions of the WACZ latitude index for which dust load is maximised at Barbados. Wind composites are calculated over the period 1965–2003; blue contour represent a significant difference at 10%; units are ms−1. (d) Difference in composite mean of GPCP precipitation. Differences are calculated by subtracting the seasonal summer mean (JJAS) of the northern most WACZ seasons (q75) from the seasonal summer mean (JJAS) of southern most WACZ seasons (q25). Units are mmday−1from GPCP. Precipitation composites calculated over the period 1979–2003.
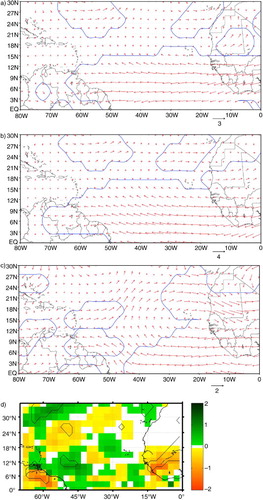
Precipitation changes that occur as the WACZ shifts from the south phase to the north phase are shown in d. Between 15°N and 25°N a drying of the region is noted with statistical significance over limited areas. Between the equator and 15°N we note an increase in precipitation, with statistical significance over limited areas. However, in contrast to the extreme drying of the Sahel region (b) as the WACZ shifts south, no clear statistically significant pattern emerges over the tropical North Atlantic. We conclude that precipitation processes in the transport region play a much smaller role in modulating dust transport to Barbados than does the extreme drying noted over source regions.
3.5. Role of WACZ intensity
shows a near-zero correlation between the intensity of the WACZ (W i) and mineral dust at Barbados, which means that there is no observed relationship between the WACZ intensity and dust load at Barbados from 1965 to 2003. This may come as a surprising result, and in comparing this null case to the WACZ latitude case discussed in Section 3.2, we look for differences between the two cases to further elucidate which processes are important for dust emission and transport.
For the W i case, we again build composite images of wind, precipitation and AVHRR aerosol load for changes in phase of the WACZ intensity to identify reasons which may explain why W i has apparently no role to play in governing the variability of mineral dust. As the correlation coefficient between W i and mineral dust is near zero, the choice in direction of difference in composites is trivial.
a and b show the composite difference of 925 and 850 hPa winds based on W i. At 925 hPa we see a west flow in the Sahel west and south of Lake Chad, which represents a decrease in the near-surface easterly winds. This suggests a reduction in surface dust emission when the WACZ is in a weaker phase. A strong, statistically significant drying occurs over the Sahel and south Sahara (c), suggesting that a weaker WACZ is associated with decreased precipitation in this region. A similar drying occurs for the W φ case (); however, as W i and W φ are not significantly correlated these drying patterns are physically independent of each other. In summary, over West Africa, we see reduced near-surface winds combined with decreased precipitation as the WACZ enters its weaker phase. These changes potentially have opposing effects on dust emission, as reduced winds likely reduce dust emission whereas reduced precipitation likely increases dust emission. This is consistent with the low correlation coefficient between dust and W i.
Fig. 12 Composite mean of difference of JJAS seasonal means from weak intensity (q25) WACZ seasons minus strong intensity (q75) WACZ seasons. Difference in wind (ms−1) (a) 925 hPa and (b) 850 hPa over the period 1965–2003. (c) Difference in precipitation (mmday−1) from 1979 to 2003. (d) Difference in AVHRR AOT over the period 1982–2003.
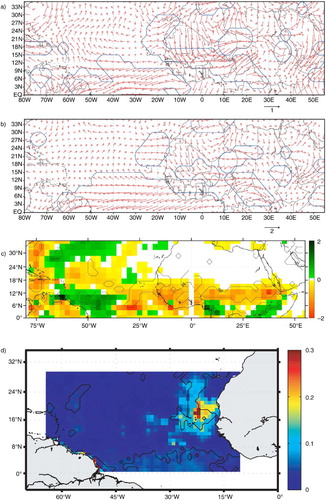
b shows the composite difference of 850 hPa winds based on W i. Wind vectors point west to east over the mineral dust source regions of the Sahel and Sahara, resulting in a decrease in easterly winds in these locations. Over the tropical North Atlantic an increase in east to west flow is observed between the equator and 12°N. Changes in precipitation over the North Atlantic Ocean are mixed (c), with decreases in precipitation near to Africa and increases in precipitation observed over Barbados southward into South America. This suggests a varied wet depositional change, with reductions near to Africa and increases near to the Caribbean. The implications for transport to the Americas are mixed. Reduced precipitation near Africa could increase the lifetime of mineral dust, and increases in cross-Atlantic flow near the equator could increase transport. However, increases in precipitation over the western tropical North Atlantic could remove mineral dust. The AVHRR AOT composite difference of the W i case is shown in d. An increase in mineral dust load is observed over the North Atlantic, however this increase is constrained only near to Africa. The response over the Caribbean is small compared to the response to changes in W φ ().
From this it becomes clear that changes in intensity of the WACZ do result in changes in wind and precipitation, but for a given phase of intensity one augments and the other decreases mineral dust emission and transport. This interplay explains the lack of a robust mineral dust response in the Caribbean to changes in WACZ intensity. summarises and contrasts the case of W φ in the south phase (left column) in which dust load is increased at Barbados and the null case of W i in the weak phase (right column). In both cases reduced precipitation over the source region and steering winds over the tropical North Atlantic act in a way that would increase dust load in Barbados. In both cases there is no clear signal from precipitation over the tropical North Atlantic. However, in the W φ case winds over the source regions respond in a way that would increase dust emission, whereas the opposite applies in the W i case. Our interpretation is that the reduction in surface winds over the Sahel and Sahara is a key reason that mineral dust load does not increase in the W i case, and conversely the increase in surface winds is a key reason that dust load increases in the W φ case.
Table 4. Summary of factors impacting emission and transport for changes in phase of W φ and W i
4. Discussion
The relationship between the annual migration of a zone of convergence in the lower troposphere and mineral dust originating in North Africa has been previously noted in in-situ observational (Carlson and Benjamin, Citation1980), reanalysis (Schwanghart and Schütt, Citation2008) and satellite studies (Moulin et al., Citation1997; Evan et al., Citation2006b; Engelstaedter and Washington, Citation2007b). Here we expand on this by investigating interannual variability during the boreal summer season, and find a strong relationship between the latitude of the WACZ and mineral dust load both over the tropical North Atlantic Ocean and at Barbados. This finding is consistent with prior results, but also yields the important finding that dusty summers occur when the WACZ is in a southern phase, and less dusty summers occur when the WACZ is in a northern phase.
Considering shorter timescales, Engelstaedter et al. (Citation2009) identified a set of conditions which occurred coincidentally with high dust days at Barbados, including reductions in rainfall over the near-surface convergence zone region and increases in atmospheric loadings in the source region. Our finding of reductions in precipitation when the WACZ is in a southern phase is in agreement with their precipitation finding. Additionally our finding of conditions becoming more favourable for dust emission likewise supports their finding that increased dust load in source regions is important for high dust load at Barbados. Further Engelstaedter et al. (Citation2009) find that increased trans-Atlantic flow is related to high dust days at Barbados, whereas this study suggests that trans-Atlantic flow may be of secondary importance to changes in dust source regions on a seasonal scale. The lack of a transport or advective response to the position of the WACZ is a surprising result of this work, given the strong correlation between dust load at Barbados and the position of the WACZ.
Cowie et al. (Citation2013) argue that reductions in vegetative cover lead to lower surface roughness, in turn stronger surface winds and thus increased dust emission. When the WACZ is in a south phase, reduced vegetation is found concurrently with increased near-surface winds, thus reductions in surface roughness as suggested by Cowie et al. (Citation2013) could represent an important mechanism for increasing dust emission. Further work is needed to determine the relative importance of surface conditions leading to favourable emission versus favourable transport processes on seasonal timescales.
When examining the annual cycle, Engelstaedter and Washington (Citation2007b) identified a correlation between convergence and satellite measurements of mineral dust and biomass over West Africa, noting that annually peak dust load occurred as the ITCZ moved northward into the summer, and suggested that disturbances passing along the boundary of the ITCZ during the summer could be responsible for dust emission. Schwanghart and Schütt (Citation2008) argue that migration of the ITCZ over West Africa can shift bands of strong winds to align with key dust source regions in summer. Bou Karam et al. (Citation2008) and Issa Lélé and Lamb (Citation2010) connect the boundary of south-western monsoon winds and dry north-eastern Harmattan winds to dust emission, suggesting that dry convergence along this boundary can loft dust into the free troposphere. In this study we systematically test how the position of the WACZ is related to mineral dust load during summer, and confirm that the position of the convergence is important, with years in which the WACZ is south having significantly higher dust load. This study does not address small scale or short term mechanisms that lead to individual dust storms or events, but suggests that future work is needed to link the mechanisms by which the position of the WACZ could lead to increased dustiness on sub-seasonal timescales.
Previous work identifying relationships between the position of the ITCZ and mineral dust, such as Engelstaedter and Washington (Citation2007b), do not make clear if this relationship is a result of the migration of the ITCZ (i.e. its position) or changes in strength of the ITCZ (i.e. the intensity of convergence). In this work we test the latitudinal and longitudinal position as well as the intensity and find that it is the latitudinal position of the WACZ that is important, with the intensity playing no significant role in dustiness over the Caribbean or at Barbados in summer. The longitude of the WACZ was shown to be both significantly correlated with dust load, however as the longitude of the WACZ is a function of its latitude, we find that the latitude of the WACZ alone is sufficient to explain the interannual variability of mineral dust load and transport.
This work assessed how the position and intensity of the WACZ could impact the environmental factors that are important for dust emission and transport. Research has been performed to investigate the opposite, that is, how atmospheric conditions change with increased dust load. Wilcox et al. (Citation2010) observe a northward shift of the ITCZ over Africa during dust events. Lau et al. (Citation2009) observe a northward shift in the ITCZ in response to increased dust load in a GCM. Similarly, Huang et al. (Citation2009) found a northward shift in precipitation over the Tropical North Atlantic in response to dusty conditions. There exists significant evidence that dusty conditions result in northward shifts in the position of the ITCZ on short timescales. The work presented here focuses on a seasonal scale and suggests mineral dust load is at its highest when the WACZ is at its southernmost point. Combined, these studies suggest the possibility of a negative feedback mechanism in which the WACZ over West Africa must be south to create conditions which are favourable for dust emission, but individual, short-lived dust storms then change the atmosphere in a way that causes the WACZ to move northward.
5. Conclusions
While drought conditions in the Sahel, favourable transport circulations, and increased near-surface winds have long been known to increase dust transport to the Americas, no unified mechanism has hitherto been identified which could explain changes in all key variables. Here we present the utility of the WACZ which proves capable of explaining the inter-annual variability of mineral dust transport to Barbados and to the Caribbean in summer and of separating out the relative importance of transport and emission. We found that the latitudinal shift of the WACZ controls much of the variability of mineral dust load over the Caribbean region, and that processes in the source regions over Africa are more important than processes over transport regions.
The WACZ latitude index is significantly correlated with the mineral dust concentration at Barbados, precipitation in the Sahel, soil moisture and vegetation. Through composite imaging we showed that the southward movement of the WACZ is associated with marked increases in near-surface winds over important dust source regions and also with decreases in precipitation over the Sahel, which in turn reduces soil moisture and vegetation. EOF analysis of precipitation and vegetation show that the dominant principle components are statistically significantly correlated to the WACZ latitude. EOF loading patterns resemble composite images, showing the robustness of the WACZ latitude index signal. As dust emission occurs on shorter timescales than considered in this work, here we show how southern displacement of the WACZ leads to conditions favourable to emission, however how the WACZ impacts individual dust emission events remains an open question.
In contrast to the WACZ latitude index, the intensity index is not significantly correlated with mineral dust load at Barbados. The corresponding composite analysis reveals that changes in the WACZ intensity do result in characteristic changes in precipitation patterns and wind patterns. However it turns out that increased winds over source regions coincide with increased precipitation and vice versa, hence the two processes counteract each other in their impact on mineral dust in the atmosphere.
In summary, the coupling of changes in near-surface winds with changes in precipitation in dust source regions driven by the latitudinal movement of the WACZ is key in explaining the variability of mineral dust load over the tropical North Atlantic, Barbados, and the Caribbean.
6. Acknowledgements
We thank the two anonymous reviewers for their constructive comments. We acknowledge and thank Dr. Joe Prospero and his staff for producing and sharing the record of mineral dust concentrations at Barbados. We thank Dr. Amato Evan for providing AOT data and for comments that greatly improved the manuscript.
NCEP Reanalysis and GPCP Precipitation data provided by the NOAA/OAR/ESRL PSD, Boulder, CO, USA, from their Web site at http://www.esrl.noaa.gov/psd.
GIMMS NDVI produced by the Global Land Cover Facility (www.landcover.org) and the Department of Geography, University of Maryland.
Related Research Data
References
- Adler R. F. , Huffman G. J. , Chang A. , Ferraro R. , Xie P.-P. , co-authors . The version-2 Global Precipitation Climatology Project (GPCP) monthly precipitation analysis (1979 present). J. Hydrometeorol. 2003; 4: 1147.
- Albrecht B. A . Aerosols, cloud microphysics, and fractional cloudiness. Science. 1989; 245(4923): 1227–1230.
- Andreae M . Raising dust in the greenhouse. Nature. 1996; 380: 389–390.
- Baker A. , Jickells T. , Witt M. , Linge K . Trends in the solubility of iron, aluminium, manganese and phosphorus in aerosol collected over the Atlantic Ocean. Mar. Chem. 2006; 98(1): 43–58.
- Bou Karam D. , Flamant C. , Knippertz P. , Reitebuch O. , Pelon J. , co-authors . Dust emissions over the Sahel associated with the West African monsoon Intertropical discontinuity region: a representative case-study. Q. J. Roy. Meteorol. Soc. 2008; 134(632): 621–634.
- Braun S. A . Reevaluating the role of the Saharan air layer in Atlantic tropical cyclogenesis and evolution. Mon. Weather Rev. 2010; 138: 2007–2037.
- Cakmur R. , Miller R. , Tegen I . A comparison of seasonal and interannual variability of soil dust aerosols over the Atlantic Ocean as inferred by the TOMS AI and AVHRR AOT retrievals. J. Geophys. Res. 2001; 106: 18287–18303.
- Carlson T. N. , Benjamin S. G . Radiative heating rates for Saharan dust. J. Atmos. Sci. 1980; 37(1): 193–213.
- Chiapello I. , Moulin C . TOMS and METEOSAT satellite records of the variability of Saharan dust transport over the Atlantic during the last two decades. Geophys. Res. Lett. 2002; 29(8): 1176.
- Chiapello I. , Moulin C. , Prospero J. M . Understanding the long-term variability of African dust transport across the Atlantic as recorded in both Barbados surface concentrations and large-scale Total Ozone Mapping Spectrometer (TOMS) optical thickness. J. Geophys. Res. Atmos. 2005; 110(D9): D18S10.
- Chiapello I. , Prospero J. , Herman J. , Hsu N . Detection of mineral dust over the North Atlantic Ocean and Africa; with the Nimbus 7 TOMS. J. Geophys. Res. 1999; 104: 9277–9291.
- Cowie S. M. , Knippertz P. , Marsham J. H . Are vegetation-related roughness changes the cause of the recent decrease in dust emission from the Sahel?. Geophys. Res. Lett. 2013; 40(9): 1868–1872.
- Dai A. , Trenberth K. E. , Qian T . A Global dataset of palmer drought severity index for 1870 2002: relationship with soil moisture and effects of surface warming. J. Hydrometeorol. 2004; 5: 1117.
- De Graaf M. , Tilstra L. , Aben I. , Stammes P . Satellite observations of the seasonal cycles of absorbing aerosols in Africa related to the monsoon rainfall, 1995–2008. Atmos. Environ. 2010; 44(10): 1274–1283.
- Doherty O. , Riemer N. , Hameed S . Saharan mineral dust transport into the Caribbean: observed atmospheric controls and trends. J. Geophys. Res. Atmos. 2008; 113(D12): D07211.
- Doherty O. , Riemer N. , Hameed S . Control of Saharan mineral dust transport to Barbados in winter by the Intertropical convergence zone over West Africa. J. Geophys. Res. Atmos (1984–2012). 2012; 117(D19): D19117.
- Dunion J. , Velden C . The impact of the Saharan air layer on Atlantic tropical cyclone activity. Bull. Am. Meteorol. Soc. 2004; 85: 353–365.
- Dunion J. P. , Marron C. S . A reexamination of the Jordan mean tropical sounding based on awareness of the Saharan air layer: results from 2002. J. Clim. 2008; 21(20): 5242–5253.
- Eklundh L. , Olsson L . Vegetation index trends for the African Sahel 1982–1999. Geophys. Res. Lett. 2003; 30(8): 080000–1.
- Engelstaedter S. , Washington R . Atmospheric controls on the annual cycle of North African dust. J. Geophys. Res. Atmos. 2007b; 112: 3103.
- Engelstaedter S. , Washington R. , Mahowald N . Impact of changes in atmospheric conditions in modulating summer dust concentration at Barbados: a back-trajectory analysis. J. Geophy. Res. Atmos (1984–2012). 2009; 114(D17): D17111.
- Evan A. T. , Dunion J. , Foley J. A. , Heidinger A. K. , Velden C. S . New evidence for a relationship between Atlantic tropical cyclone activity and African dust outbreaks. Geophys. Res. Lett. 2006a; 33(19): 19813.
- Evan A. T. , Foltz G. R. , Zhang D. , Vimont D. J . Influence of African dust on ocean-atmosphere variability in the tropical Atlantic. Nat. Geosci. 2011; 4(11): 762–765.
- Evan A. T. , Heidinger A. K. , Knippertz P . Analysis of winter dust activity off the coast of West Africa using a new 24-year over-water advanced very high resolution radiometer satellite dust climatology. J. Geophys. Res. Atmos. 2006b; 111: 12210.
- Evan A. T. , Mukhopadhyay S . African dust over the northern tropical Atlantic: 1955–2008. J. Appl. Meteorol. Climatol. 2010; 49(11): 2213–2229.
- Fiedler S. , Schepanski K. , Heinold B. , Knippertz P. , Tegen I . Climatology of nocturnal low-level jets over North Africa and implications for modelling mineral dust emission. J. Geophys. Res. Atmos. 2013; 118(12): 6100–6121.
- Folland C. , Owen J. , Ward M. , Coleman A . Prediction of seasonal rainfall in the Sahel region using empirical and dynamical methods. J. Forecasting. 1991; 10(1–2): 21–56.
- Fontaine B. , Roucou P. , Gaetani M. , Marteau R . Recent changes in precipitation, ITCZ convection and northern tropical circulation over North Africa (1979–2007). Int. J. Climatol. 2011; 31(5): 633–648.
- Ginoux P. , Prospero J. M. , Torres O. , Chin M . Long-term simulation of global dust distribution with the GOCART model: correlation with North Atlantic Oscillation. Environ. Model. Software. 2004; 19: 113–128.
- Glaccum R. A. , Prospero J. M . Saharan aerosols over the tropical North Atlantic Mineralogy. Mar. Geol. 1980; 37(3–4): 295–321.
- Heinold B. , Knippertz P. , Marsham J. , Fiedler S. , Dixon N. , co-authors . The role of deep convection and nocturnal low-level jets for dust emission in summertime West Africa: estimates from convection-permitting simulations. J. Geophys. Res. Atmos. 2013; 118(10): 4385–4400.
- Herrmann S. M. , Anyamba A. , Tucker C. J . Recent trends in vegetation dynamics in the African Sahel and their relationship to climate. Global Environ. Change. 2005; 15(4): 394–404.
- Herwitz S. , Muhs D. , Prospero J. , Mahan S. , Vaughn B . Origin of Bermuda's clay-rich Quaternary paleosols and their paleoclimatic significance. J. Geophys. Res. 1996; 101: 23389–23400.
- Huang J. , Zhang C. , Prospero J. M . Aerosol-induced large-scale variability in precipitation over the tropical Atlantic. J. Clim. 2009; 22: 4970–4988.
- Issa Lélé M. , Lamb P. J . Variability of the Intertropical front (ITF) and rainfall over the West African Sudan-Sahel zone. J. Clim. 2010; 23(14): 3984–4004.
- Jickells T . The inputs of dust derived elements to the Sargasso Sea; a synthesis. Mar. Chem. 1999; 68: 5–14.
- Kalnay E. , Kanamitsu M. , Kistler R. , Collins W. , Deaven D. , co-authors . The NCEP/NCAR 40-year reanalysis project. Bull. Am. Meteorol. Soc. 1996; 77: 437–471.
- Kaufman Y. , Koren I. , Remer L. , Tanré D. , Ginoux P. , Fan S . Dust transport and deposition observed from the Terra-Moderate Resolution Imaging Spectroradiomenter (MODIS) spacecraft over the Atlantic Ocean. J. Geophys. Res. 2005; 110: 10S12.
- Kim K.-M. , Lau W. K.-M. , Sud Y. C. , Walker G. K . Influence of aerosol-radiative forcings on the diurnal and seasonal cycles of rainfall over West Africa and Eastern Atlantic Ocean using GCM simulations. Clim. Dynam. 2010; 35(1): 115–126.
- Knippertz P. , Todd M. C . Mineral dust aerosols over the Sahara: meteorological controls on emission and transport and implications for modelling. Rev. Geophys. 2012; 50(1): G1007.
- Koren I. , Kaufman Y. J. , Washington R. , Todd M. C. , Rudich Y. , co-authors . The Bodélé depression: a single spot in the Sahara that provides most of the mineral dust to the Amazon forest. Environ. Res. Lett. 2006; 1(1): 014005.
- Lau K. M. , Kim K. M . Cooling of the Atlantic by Saharan dust. Geophys. Res. Lett. 2007a; 34: L23811.
- Lau K. M. , Kim K. M. , Sud Y. C. , Walker G. K . A GCM study of the response of the atmospheric water cycle of West Africa and the Atlantic to Saharan dust radiative forcing. Ann. Geophys. 2009; 27 4023–4037, DOI: 10.5194/angeo-27-4023-2009..
- Lau W. K. M. , Kim K.-M . How nature foiled the 2006 hurricane forecasts. EOS Trans. 2007b; 88: 105–106.
- Marsham J. H. , Hobby M. , Allen C. , Banks J. , Bart M. , co-authors . Meteorology and dust in the central Sahara: observations from fennec supersite-1 during the June 2011 intensive observation period. J. Geophys. Res. Atmos. 2013; 118(10): 4069–4089.
- Marsham J. H. , Knippertz P. , Dixon N. S. , Parker D. J. , Lister G . The importance of the representation of deep convection for modeled dust-generating winds over West Africa during summer. Geophys. Res. Lett. 2011; 38(16): L16803.
- Miller R. , Perlwitz J. , Tegen I . Feedback upon dust emission by dust radiative forcing through the planetary boundary layer. J. Geophys. Res. 2004; 109: 24209.
- Moulin C. , Lambert C. , Dulac F. , Dayan U . Control of atmospheric export of dust from North Africa by the North Atlantic Oscillation. Nature. 1997; 387: 691–694.
- Muhs D. R. , Budahn J. R. , Prospero J. M. , Carey S. N . Geochemical evidence for African dust inputs to soils of western Atlantic islands: Barbados, the Bahamas, and Florida. J. Geophys. Res-Earth. 2007; 112: 2009.
- Nakamae K. , Shiotani M . Interannual variability in Saharan dust over the North Atlantic ocean and its relation to meteorological fields during northern winter. Atmos. Res. 2013; 122: 336–346.
- Nicholson S. E . A revised picture of the structure of the “monsoon” and land ITCZ over West Africa. Clim. Dynam. 2009a; 32: 1155–1171.
- Nicholson S. E. , Tucker C. J. , Ba M. B . Desertification, drought, and surface vegetation: an example from the West African Sahel. Bull. Am. Meteorol. Soc. 1998; 79: 815–829.
- Olsson L. , Eklundh L. , Ard J . A recent greening of the Sahel trends, patterns and potential causes. J. Arid Environ. 2005; 63(3): 556–566.
- Parker D. J. , Burton R. R. , Diongue-Niang A. , Ellis R. J. , Felton M. , co-authors . The diurnal cycle of the West African monsoon circulation. Q. J. Roy. Meteorol. Soc. 2005; 131: 2839–2860.
- Prospero J. , Ginoux P. , Torres O. , Nicholson S. , Gill T . Environmental characterization of global sources of atmospheric soil dust identified with the Nimbus 7 Total Ozone Mapping Spectrometer (TOMS) absorbing aerosol product. Rev. Geophys. 2002; 40: 1002.
- Prospero J. , Lamb P . African droughts and dust transport to the Caribbean: climate change implications. Science. 2003; 302: 1024–1027.
- Prospero J. , Nees R . Impact of the North African drought and El Nino on mineral dust in the Barbados trade winds. Nature. 1986; 320: 735–738.
- Prospero J. M. , Blades E. , Naidu R. , Mathison G. , Thani H. , Lavoie M. C . Relationship between African dust carried in the Atlantic trade winds and surges in pediatric asthma attendances in the Caribbean. Int. J. Biometeorol. 2008; 52: 823–832.
- Prospero J. M. , Carlson T. N . Saharan air outbreaks over the tropical North Atlantic. Pure Appl. Geophys. 1980; 119: 677–691.
- Prospero J. M. , Nees R. T . Dust concentration in the atmosphere of the equatorial North Atlantic: possible relationship to the Sahelian drought. Science. 1977; 196: 1196–1198.
- Ridley D. , Heald C. , Ford B . North African dust export and deposition: a satellite and model perspective. J. Geophys. Res. Atmos (1984–2012). 2012; 117(D2): D02202.
- Ridley D. , Heald C. , Prospero J . What controls the recent changes in African mineral dust aerosol across the Atlantic?. Atmos. Chem. Phys. Discus. 2014; 14(3): 3583–3627.
- Riemer N. , Doherty O. , Hameed S . On the variability of African dust transport across the Atlantic. Geophys. Res. Lett. 2006; 33(13): L13814.
- Rydell H. S. , Prospero J. M . Uranium and thorium concentrations in wind-borne Saharan dust over the Western Equatorial North Atlantic Ocean. Earth Planet. Sci. Lett. 1972; 14: 397.
- Savoie D. L. , Prospero J. M. , Nees R. T . Frequency distribution of dust concentration in Barbados as a function of averaging time. Atmos. Environ. 1987; 21(7): 1659–1663.
- Schepanski K. , Tegen I. , Macke A . Comparison of satellite based observations of Saharan dust source areas. Rem. Sens. Environ. 2012; 123: 90–97.
- Schepanski K. , Tegen I. , Todd M. , Heinold B. , Bönisch G. , co-authors . Meteorological processes forcing Saharan dust emission inferred from MSG-SEVIRI observations of subdaily dust source activation and numerical models. J. Geophys. Res. Atmos (1984–2012). 2009; 114(D10): D10201.
- Schwanghart W. , Schütt B . Meteorological causes of Harmattan dust in West Africa. Geomorphology. 2008; 95: 412–428.
- Sokolik I. , Toon O . Direct radiative forcing by anthropogenic airborne mineral aerosols. Nature. 1996; 381: 681–683.
- Sultan B. , Janicot S. , Diedhiou A . The West African monsoon dynamics. Part I: documentation of intraseasonal variability. J. Clim. 2003; 16: 3389–3406.
- Swap R. , Garstang M. , Greco S. , Talbot R. , Kallberg P . Saharan dust in the Amazon basin. Tellus B. 1992; 44: 133–149.
- Tegen I. , Fung I . Modeling of mineral dust in the atmosphere: sources, transport, and optical thickness. Geophys. Res. Lett. 1994; 99: 22897.
- Tegen I. , Lacis A. , Fung I . The influence of climate forcing of mineral aerosols from disturbed soils. Nature. 1996; 380: 419–422.
- Todd M. , Allen C. T. , Bart M. , Bechir M. , Bentefouet J. , co-authors . Meteorological and dust aerosol conditions over the western Saharan region observed at fennec supersite-2 during the intensive observation period in June 2011. J. Geophys. Res. Atmos. 2013; 118(15): 8426–8447.
- Trapp J. M. , Millero F. J. , Prospero J. M . Temporal variability of the elemental composition of African dust measured in trade wind aerosols at Barbados and Miami. Mar. Chem. 2010; 120(1–4): 71–82.
- Tucker C. , Pinzon J. , Brown M. , Slayback D. , Pak E. , co-authors . An extended AVHRR 8-km NDVI dataset compatible with MODIS and SPOT vegetation NDVI data. Int. J. Rem. Sens. 2005; 26: 4485–4498.
- Twomey S . The influence of pollution on the shortwave Albedo of clouds. J. Atmos. Sci. 1977; 34: 1149–1154.
- Wang C. , Dong S. , Evan A. T. , Foltz G. R. , Lee S.-K . Multidecadal covariability of North Atlantic sea surface temperature, African dust, Sahel rainfall, and Atlantic hurricanes. J. Clim. 2012; 25(15): 5404–5415..
- Wang K.-Y . Profiles of the atmospheric temperature response to the Saharan dust outbreaks derived from formosat-3/cosmic and {OMI} {AI}. Atmos. Res. 2010; 96(1): 110–121.
- Washington R. , Todd M. , Middleton N. , Goudie A.G . Dust-storm source areas determined by the Total Ozone Monitoring Spectrometer and surface observations. Ann. Assoc. Am. Geogr. 2003; 93: 17701.
- Washington R. , Todd M. C. , Engelstaedter S. , Mbainayel S. , Mitchell F . Dust and the low-level circulation over the Bodélé Depression, Chad: observations from BoDEx 2005. J. Geophys. Res. Atmos. 2006; 111: 3201.
- Wilcox E. M. , Lau K. M. , Kim K.-M . A northward shift of the North Atlantic Ocean Intertropical Convergence Zone in response to summertime Saharan dust outbreaks. Geophys. Res. Lett. 2010; 37: L0480.
- Zender C. S. , Bian H. , Newman D . Mineral dust entrainment and deposition (DEAD) model: description and 1990s dust climatology. J. Geophys. Res. Atmos. 2003; 108: 4416.