
Abstract
Concerns have been raised about the possible connections between the local and regional photochemical problem and global warming. The current study assesses the trend of ozone in Hong Kong and the Pearl River Delta (PRD) in South China and investigates the interannual changes of sensitivity of ozone to air temperature, as well as the trends in regional precursors. Results reveal, at the three monitoring sites from the mid-1990s to 2010, an increase in the mean ozone concentrations from 1.0 to 1.6 µg m−3 per year. The increase occurred in all seasons, with the highest rate in autumn. This is consistent with trends and temperature anomalies in the region. The increase in the sensitivity of ozone to temperature is clearly evident from the correlation between ozone (OMI [Ozone Monitoring Instrument] column amount) and surface air temperature (from the Atmospheric Infrared Sounder) displayed in the correlation maps for the PRD during the prominently high ozone period of July–September. It is observed to have increased from 2005 to 2010, the latter being the hottest year on record globally. To verify this temporal change in sensitivity, the ground-level trends of correlation coefficients/regression slopes are analysed. As expected, results reveal a statistically significant upward trend over a 14-year period (1997–2010). While the correlation revealed in the correlation maps is in agreement with the corresponding OMI ozone maps when juxtaposed, temperature sensitivity of surface ozone also shows an association with ozone concentration, with R=0.5. These characteristics of ozone sensitivity are believed to have adverse implications for the region. As shown by ground measurements and/or satellite analyses, the decrease in nitrogen oxides (NO2) and NOx in Hong Kong is not statistically significant while NO2 of the PRD has only very slightly changed. However, carbon dioxide has remarkably declined in the whole region. While these observations concerning precursors do not seem to adequately support an increasing ozone trend, measured surface levels of formaldehyde, a proxy for volatile organic compound (VOC) emissions, have risen significantly in the PRD (2004–2010). Hence, the reactive VOCs in the PRD are likely to be the main culprit for the increase of ozone, as far as precursors are concerned. Despite the prevailing problem, model simulations suggest prospects for improvement in the future.
1. Introduction
Ozone (O3), as a greenhouse gas with the third largest global warming effect after carbon dioxide (CO2) and methane (CH4), has an important role in the earth's climate. In fact, the short-lived species of O3, black carbon (BC) and organic carbon, as distinct from CO2 and nitrous oxide which have a lifetime of 50–200 and 120 years respectively, have been suggested to contribute significantly to the future warming of surface air (Levy et al., Citation2008). Indeed, non-CO2 greenhouse gases were considered by Hansen et al. (Citation2000) to be the primary drive for climate change in the past century. A more recent report by CitationUNEP/WMO (2011) infers that reductions in near-term warming depend on the control of tropospheric BC, ozone (and the precursors methane and carbon monoxide, CO) and sulphate while CO2 emission reductions are required immediately to limit long-term climate change.
Ozone, a secondary pollutant, is the most prevalent photochemical oxidant, among such other oxidants as peroxyacyl nitrates (PAN) and organic peroxides. Stratospheric input of ozone takes place mainly in the middle and high latitudes, especially in early spring (Collins et al., Citation2003). In lower latitudes photochemical generation is the dominant source of tropospheric ozone. This ozone is formed from the primary precursors nitrogen oxides (NOx), non-methane volatile organic compounds (NMVOCs) and, to a lesser extent, CO and methane in the presence of sunlight (UV radiation) through complex reactions. Elevated ozone level is associated with temperatures in excess of 20°C and often with temperatures above 30°C (Lollar, Citation2005). Diverse factors affecting ozone formation include, among others, the meteorological factors of atmospheric stagnation and synoptic circulations. The observed surface ozone is the result of a balance between production and removal processes. Often, the production more than compensates for the losses that are due to NO scavenging or deposition.
Annual mean temperatures recorded at the Hong Kong Observatory headquarters (HKO) () show an average rise of 0.12°C per decade from 1885 to 2010, which includes an increase of 0.15°C per decade from 1952 to 2002, and 0.21°C during 1971–2010 (Chan et al., Citation2012). This local trend has been attributed to global warming and, to a smaller degree, urbanisation. Specifically the average rate of temperature rise in relation to urbanisation between 1885 and 2006 was computed by Leung et al. (Citation2007) to be 0.08°C per decade. Climatic warming has been reported in the Pearl River Delta (PRD) (Tracy et al., Citation2006) as a widespread problem. Shanghai's average temperature rose 1.43°C from 1873 to 2007, nearly double the world's average of 0.74° (Hou et al., Citation2013). A warmer climate will increase not only the reaction rates but also natural emissions of volatile organic compounds (VOCs) (Confalonieri et al., Citation2007) and even NO (USEPA, Citation2000). Greater stability favouring ozone formation may also arise from decreased global circulation (Jacob and Winner, Citation2009). A positive temperature–concentration relationship has been well established (Bloomer et al., Citation2009; Jacob and Winner, Citation2009) for ozone and isoprene. However, under temperatures in excess of 39°C (312 K), ozone was found to decrease in the ozone–temperature slope (Steiner et al., Citation2010).
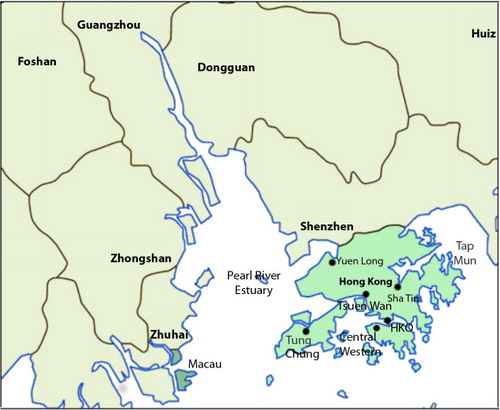
Fig. 1 Map of Hong Kong and the Pearl River Delta region of South China (HKO: Hong Kong Observatory), based on Croquant, 2007 (http://commons.wikimedia.org./wiki/File:Pearl_River_Delta_Area.png).
Instantaneous rates of formation of ozone are dependent on the precursors NOx and VOC concentrations. VOC consists of a large group of organic chemicals that participate in atmospheric photochemical reactions, excluding compounds of negligible photochemical reactivity such as methane, ethane (U.S. Government Printing Office, Citation2003). Reactive species with high relative incremental reactivity (RIR) clearly play a more central role. VOCs originate from a variety of anthropogenic and biogenic sources. Isoprene, a reactive VOC from plants, contributes significantly to the formation of ozone (Solomon et al., Citation2007) through complex reactions. In Hong Kong, isoprene has been estimated to contribute as much as 30% of the annual biogenic VOC emissions (Tsui et al., Citation2009) and has been predicted to increase as a consequence of temperature rise. Notably, in areas of high VOC and lower NOx levels, ozone formation is known to be suppressed by the formation of isoprene nitrates (Horowitz et al., Citation2007).
In the last decade or so, Hong Kong has been experiencing more ozone pollution than before. Together with other photochemical species and sulphate aerosols, haze results in the region. While originally a summer problem, it has encroached into autumn since around 2000 (Lee et al., Citation2009). Maximum ozone concentrations are observed to be increasing in rural, new town or urban environments in Hong Kong. This development stands in stark contrast to the eminent decline in average ozone levels in the US after 2002, following a decrease in the 1980s and a levelling off in the 1990s (USEPA, Citation2000). The US decrease comes as a result of the control of precursor emissions. The average NO2 concentrations in the US have concurrently declined. The US situation seems to attest to the important role of precursors. In Europe, apparent contradictions exist. The average ozone levels increased from 1996 to 2005 despite a near uniform decrease in NOx and VOC emissions (European Commission, Citation2011). EEA's report (EEA, 2011) analysed data up to 2009, and conceded a discrepancy between the substantial cuts in ozone precursor emissions and the stagnation in observed ozone concentrations. Reasons suggested include inter-continental transport of ozone and precursors, climate change/variability, biogenic non-methane VOC emissions, biomass burning and increased concentrations of methane in 2007. The European instance seems to suggest factor(s) other than precursors.
While there is growing concern over short-lived species including ozone regarding their near-term warming impact, temperature increases have been suggested to worsen the photochemical problem even if precursor emissions remain constant (Bloomer et al., Citation2009). To follow up on this, the current study assesses the ozone trend in Hong Kong and the PRD region against a background of positive temperature anomalies. The year to year changes of sensitivity (in terms of correlation coefficients) of ozone with temperature rise is then investigated over the period of mid-1990s to 2010. Since any positive change in sensitivity is believed to further aggravate the photochemical problem, a possible association between this temperature sensitivity and ozone concentration is examined. On account of the usually dominant role of the precursors, observed trends of NOx NO2, CO, isoprene and formaldehyde (the latter typically used as indicator of VOCs) are analysed for the Hong Kong/PRD region, based on available ground and satellite data. Goddard Institute for Space Studies (GISS)'s ModelE2 and National Center for Atmospheric Research (NCAR)'s Community Earth System Model (CESM)-Community Atmosphere Model are used to investigate future ozone.
2. Data and methods
The data used in this study derive from a number of sources. Hourly and monthly data for ozone, PM10 chemical species data and isoprene/formaldehyde/acetaldehyde data from the ‘toxic air pollution’ program have been acquired from the Environmental Protection Department (EPD) of the Hong Kong Special Administrative Region (HKSAR). Ozone analysis encompasses three monitoring sites: Central Western on the Hong Kong island, Sha Tin and Tsuen Wan in the New Territories (see ). For comparison, representative data from three of the 16 monitoring stations of the PRD Regional Air Quality Monitoring Network (jointly established by the Guangdong Provincial Environmental Protection Monitoring Centre and the EPD of Hong Kong) were retrieved from the EPD website. Temperature data for Sha Tin (an automatic station) from 2000 were downloaded from the HKO website (www.hko.gov.hk), while data prior to 2000 were requested. Temperature data for the HKO headquarters (32 m above msl) and Ching Pak house in Tsing Yi, 122 m above msl, south of Tsuen Wan, were provided by the Observatory. The first set of temperature data, which is usually released by the HKO to represent the Hong Kong territory, was used for sites other than Sha Tin.
Satellite remote sensing which has been recognised as a powerful tool for exploring spatial variability of air pollution, is used in this study. Surface NO2 concentrations and NO2 measurements by Ozone Monitoring Instrument (OMI) compiled for comparison by CitationBechle et al. (2013) yields strong correlation between the measurements, with R=0.93 for annual average data. Similar results of surface NO2 and Global Ozone Monitoring Experiment (GOME) measurements were reported earlier by Petritoli et al. (Citation2004) while Morris et al. (Citation2009) found OMI tropospheric ozone amounts highly correlated with surface ozone concentrations, with monthly averages approaching values of 0.9.
The Total Ozone Mapping Spectrometer (TOMS) and the OMI column amount ozone images were generated by NASA Goddard Earth Sciences Data and Information Services Center (GES DISC)'s Geospatial Interactive Online Visualization ANd aNalysis Infrastructure (Giovanni) facility (Acker and Leptoukh, Citation2007). OMI data was available only from 1 October 2004. The NO2 tropospheric column amount and formaldehyde column amount were similarly generated on Giovanni for 2004–2010. Area-averaged time series column amount ozone was also computed for the cities of Guangzhou, Xiamen, Hong Kong, Shanghai and Beijing for 2004–2010 for reference. Also derived from Giovanni was the total column CO as the number of CO molecules in an atmospheric column from the Earth's surface to the top of the stratosphere above a square centimetre of the surface. It is based on global 1.0°×1.0° daily Level-3 Products from the Atmospheric Infrared Sounder (AIRS) on board the Aqua satellite (Acker and Leptoukh, Citation2007). Correlations between column amount ozone (OMI) and surface air temperature (AIRS) were computed on the Northern Eurasia Earth Science Partnership Initiative (NEESPI) portal on Giovanni. Temperature anomalies in South China were generated for particular months/seasons (at 925 hPa) for the period 1996–2010, based on monthly composites (mean) of National Centres for Environmental Prediction (NCEP)/NCAR's reanalysis data. The Interactive Plotting and Analysis tool of the Earth System Research Laboratory (Physical Sciences Division) of National Oceanic and Atmospheric Administration (NOAA) was used. Climate normals were updated from 1958–1996 to 1981–2010 by NOAA.
Long or medium term trends of pollutants were examined to provide clues to how changes in climate or other factors affect them. These trends were illustrated by time series displaying the time variation of the daily mean concentrations of pollutants, for example, ozone, during the study periods. Curves created were smoothed by the moving average method to reduce short-term fluctuations, especially in weather. Rates of ozone increases in µg m−3 per year or per season, are derived from the least-squares best-fitting model equations, drawing from trends comparison in local studies (Lee et al., Citation2009; Wang et al., Citation2009). R 2 value indicated how well the line fitted the data. To evaluate the linear trends of the time series, significance testing was performed to determine if the observed trend was statistically significant at an appropriate level of confidence, for example, 0.05 significance level. This means that the probability value (p-value) of the slope of the trend line is <0.05. The 95% confidence level is the minimum adopted in this work.
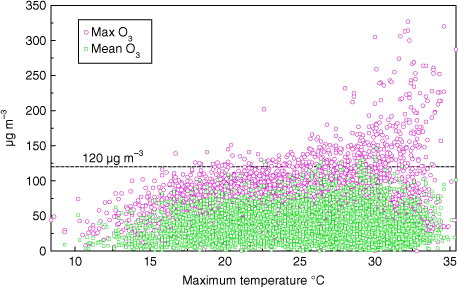
Sensitivity of surface ozone and isoprene to changes in temperature was statistically tested by analysing the multi-year trends for the entire year or specific seasons, with respect to their (1) correlation coefficients and (2) regression slopes (also known as regression coefficients) (95% confidence) (Bloomer et al., Citation2009; Yoshitomi et al., Citation2009). The data were filtered to exclude ozone concentrations <120 µg m−3 () (Jacob and Winner, Citation2009) prior to statistical analyses owing to the critical linear relationship of higher ozone concentrations with temperatures. It is clear from that the entire relationship is nonlinear. There is, however, little documentation in literature on the shapes of the full ozone and temperature distributions (Bloomer et al., Citation2009). Three afore-mentioned monitoring sites were included in the study (). As the stations commenced operation in different years in the mid/late 1990s, the period covered by the study varied slightly for each station.
Fig. 2 Daily maximum and mean ozone concentrations versus daily maximum temperature in Hong Kong (Central Western) 1994–2008.
GISS's Atmospheric General Circulation Model (GCM) ModelE2 (Schmidt et al., Citation2006; Shindell et al., Citation2006; Unger et al., Citation2006) was employed to project future concentrations of Ox (2025–2035). The model has a Cartesian gridpoint formulation for all quantities with a vertical resolution of 20 layers and a model top at 0.1 hPa, running from the surface up through the lower mesosphere. The horizontal resolution is 2°×2.5° latitude by longitude. The model simulates different configurations of Earth System Models, including interactive atmospheric chemistry, aerosols, the carbon cycle and other tracers, as well as the standard atmosphere, ocean and land surface components. The chemistry simulation includes both tropospheric and stratospheric ozone and oxidant photochemistry. Aerosols include sulphate, sea salt, black and organic carbon, mineral dust, nitrate, and heterogeneous interaction of nitrate and sulphate with dust. Chemistry and aerosols are coupled together, so that oxidant changes affect sulphate oxidation and the aerosols affect photochemistry. Future trace gas emissions follow the Intergovernmental Panel on Climate Change (IPCC) emissions scenario ‘Representative Concentration Pathway 6.0 (RCP6.0)’. This is a mid to high projection of man-made precursor emissions among the four scenarios being used in simulations for the IPCC 5th Assessment Report, with a balance across all energy sources.
We also adopted NCAR's CESM CAM (4.0), at http://www.cesm.ucar.edu/models/atm-cam/ to provide a zoomed in examination of the pollutant situation, covering 2002–2004 for current years, 2029–2031 and 2049–2051 for future periods. With a horizontal resolution of 0.9° latitude, 1.25° longitude, it has 26 levels from surface to 3.5 hPa. CAM shares many parameterisations with GISS ModelE2 with the added benefit of a special chemical preprocessor, which allows easy modification and update of chemical mechanisms. It differs from previous version in that the mixing ratios of tracers change as water vapour changes (Lamarque et al., 2012). Projected trace gas emissions in this model are based on IPCC emission scenario RCP4.5.
3. Results and discussions
3.1. Increase of ozone
Ozone concentrations have been increasing in Hong Kong since 1990 (EPD, 2010) though ambient NOx, NO2, CO and VOCs have not significantly increased in recent years. The ozone problem in Hong Kong has long been seen as a result of the longstanding influence of transported precursor species, and thus as a regional rather than a local issue. The highest hourly ozone concentrations observed up to 2010 are 357 at Sha Tin and 407 µg m−3 at Tap Mun for urban and suburban areas, both measured in 2008. The maximum concentration in 2011/2012 is a comparable 406 µg m−3 measured at highly urbanised Yuen Long in the northwestern part of Hong Kong, which borders the metropolis Shenzhen (). An upward trend is clearly seen in the smoothed mean daily ozone concentrations for all three monitoring sites (). The increase is most conspicuous in autumn () and at the Sha Tin site with data from 1997 to 2010 in particular. In significance testing, the p-values of the slopes of all three trend lines for autumn are <0.01 (), denoting statistical significance.
Fig. 3 Mean ozone concentrations in Hong Kong (Central Western, Tsuen Wan and Sha Tin) in autumn 1994/1997–2010.
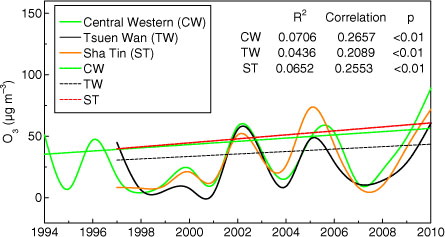
Overall, the rate of increase in autumn concentrations ranges from 1.0 µg m−3 at Tsuen Wan to a high of 1.62 µg m−3per year at Sha Tin. While atmospheric stability in the Sha Tin valley is conducive to ozone formation, the blocking of airflow in the valley is believed to have favoured air temperature rise. On the other hand, the lowest ozone increase is found in summer, ranging from 0.54 µg m−3 at Tsuen Wan to 0.76 µg m−3 per year at the Hong Kong Island site of Central Western, as summarised in and . R 2 for the trend equations are low even for Sha Tin. This may partly be attributed to the fact that ozone's linear relationship with temperature is true only for concentrations above 120 µg m−3. Other factors such as meteorological and emission changes may also bring about interannual variations. The average ozone increase at Central Western reported here is comparable to that measured at the same station in another local study (Wang et al., Citation2009) and the observations of 1.16–2.4 µg m−3 increase per year at surface sites in Beijing, Taipei and Japan (Cooper et al., Citation2010).
Fig. 4 Seasonal increase of ozone (mid/late 1990s to 2010) and air temperature trend (1971–2010) in Hong Kong (10% error bars).
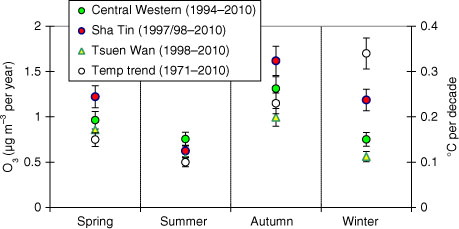
Table 1. Observed ozone trend in Hong Kong 1994/97/98–2010 (µg m−3 change per year)
The trend of surface ozone in Hong Kong is in general agreement with that in the South China region, where limited data are available from 2006. shows the trend for different seasons in Guangzhou, the provincial capital of Guangdong, from 2006 to 2010. An average upward trend is evident from the linear curve fit, with highest concentrations observed in autumn. An ozone maximum of 425 µg m−3 was recorded in November 2009 compared with 408 µg m−3 in 2010 (Guangdong PEMC/EPD, Citation2010). Over a longer period, the TOMS/OMI column amount of ozone reveals a formidable increase in tropospheric ozone from 1996 to 2010, part of which is apparent from illustrations in section 3.2. A similar trend is reflected in the area-averaged time series column amount ozone for the South China region (105.5°E–122.5°E, 18.5°–31°N), and separately for Hong Kong, Guangzhou and Xiamen for 2004–2010 (not shown). Even stronger warming and more elevated ozone are found in mid-latitude Shanghai and Beijing (Dufour et al., Citation2010). A photochemical problem is clearly widespread in China.
Fig. 5 Seasonal ozone concentrations in Guangzhou in the Pearl River Delta, 2006–2010 showing linear curve fit and upward trends.
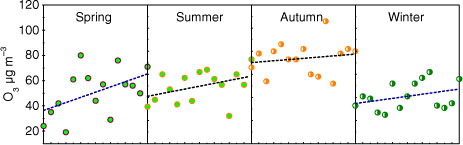
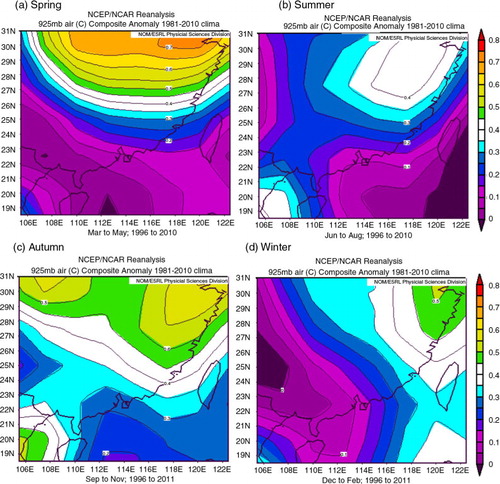
The variations in seasonal ozone increases described above are consistent with temperature anomalies observed in Hong Kong and South China at 925 hPa from 1996 to 2010, when compared with 1981–2010 climatology (), for autumn and winter. A similar temperature pattern for these two seasons was reported for Hong Kong by CitationChan et al. (2012) over a longer period of 1971–2010, as is shown in . Notably both Hong Kong and South China experience the lowest temperature anomaly in spring which, unexpectedly, records a considerable ozone increase. This is believed to result from the transport of significant amounts of ozone and precursors to Hong Kong from biomass burning areas in China/Indochina or even more distant upwind sources (Lee et al., Citation2013). Ozone-rich air masses from biomass burning have been shown by Chan et al. (Citation2000) to pass through the Indo-Burma region into Hong Kong in spring, enhancing ozone levels in the lower troposphere.
Fig. 6 Temperature anomaly (at 925 hPa) in (a) spring (b) summer (c) autumn and (d) winter in South China 1996–2010.
3.2. Temperature sensitivity of ozone
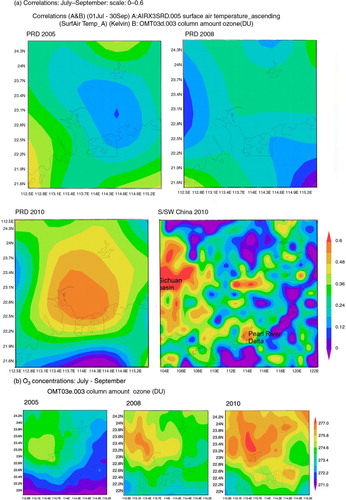
Air pollutants analysed in this study are based on their prevalence in Hong Kong and South China and their impact as inferred from scientific literature. Of these pollutants, only ozone and isoprene are shown by correlational analysis (maximum concentration versus maximum temperature) to be significantly influenced by maximum temperature, not other short-lived species like BC, sulphate or organic carbon. Lack of correlation with the latter species is not presented. Part of this sensitivity may well pertain to other causal factors which are temperature-dependent. a presents correlation maps for ozone as represented by OMI column amount ozone and temperature indicated by the AIRS surface air temperature for South/Southwest China (2005–2010). In a, the correlation noticeably stands out in the PRD and the Sichuan basin in Southwest China, both of which are known for their poor air quality. The correlation maps have been enlarged in a for the PRD where the correlation is observed to have risen in 2010 to the range of 0.42–0.6 during the ozone season of July–September. This represents an astounding increase in the short space of only 5 years, from a correlation of merely 0.12–0.24 in 2005, despite interannual fluctuations. It is, however, not known if this high correlation is in any way related to 2010 being the warmest year on record globally since records began in 1850, according to the World Meteorological Organization (WMO). 2010 is marginally warmer than 1998 and 2005. In Hong Kong, 2010 was characterised by irregular variations in temperature (http://www.hko.gov.hk/wxinfo/pastwx/ywx.htm) and July was hotter than usual. The high correlation coefficients in 2010 point to a significant adverse effect of the temperature driving factor for ozone. The cooling influence of the La Niña conditions (the Eastern Pacific is cooler than average, while the western Pacific Ocean is warmer) in early and late 2011 may have, however, decreased the correlations.
Fig. 7 (a) Correlation between OMI column amount ozone (DU) and AIRS surface air temperature (Kelvin), NEESPI, for the period of 1 July–30 September of 2005, 2008 and 2010 for the Pearl River Delta and 2010 for South/SW China. (b) Column amount ozone for the same period and years: PRD.
Since OMI data began in October 2004, correlation maps between ozone and temperature for the ozone season can only be generated from 2005. Surface data over a longer period is, therefore, needed to provide a more complete picture. Results of analysis reveal a fairly smooth rising trend in the correlation coefficients and regression slopes of ozone at Sha Tin (see ) over a 14 year period from 1997 to 2010 (a), underlining the increase in temperature sensitivity of ozone. The p-value of <0.05 at 95% confidence level is significant enough to confirm this trend already manifested in the OMI/AIRS plots (a). Sha Tin has noticeably seen ozone episodes emerging in autumn since 2000. Because the correlation coefficient method yields a comparatively better R 2 value than the regression slopes, it is considered a more desirable method. The trends at the other two sites show more fluctuations but remain positive. When the same analysis is applied to the yearly data excluding winter for Sha Tin, a similar upward trend is obtained (not shown).
Fig. 8 (a) Trend of ozone sensitivity (correlation coefficients/slopes of regression) to temperature in Hong Kong (Sha Tin) 1997–2010 (b) Relationship between temperature sensitivity and maximum ozone in Hong Kong (spring, summer and autumn) (Sha Tin and Central Western) 1996/1998–2010.
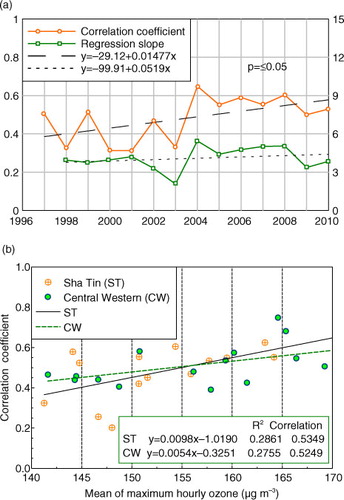
The amount and rate of sensitivity change, as estimated from the trend of correlation coefficients, is approximately 0.015/year for Sha Tin (). No attempt is made to verify peak sensitivity which seems to be the highest in 2004 in a. A limit, however, is believed to exist for this positive trend because ozone formation was reported to be suppressed at temperatures in excess of 312 K (39°C) (Steiner et al., Citation2010) when the PAN (coincident with ozone formation) lifetime decreases leading to a decrease in the net PAN sink for NOx. This, in turn, results in a levelling off in maximum ozone. Reduction in ozone has also been found to be a function of decreased isoprene emissions (Steiner et al., Citation2010). Clearly regions with very high temperatures in summer/autumn albeit below 39°C, are most susceptible to this temperature sensitivity factor of ozone. Areas likely to be affected include many parts of mainland China with serious ozone problem unfolding. The maximum temperature reached in Hong Kong (in August) is about 35°C, that is, below the threshold for ozone formation suppression. Yet to be assessed is the extent this sensitivity factor negatively affects the region in relation to the temperature trend.
Table 2. Trends of ozone precursors and temperature sensitivity, Hong Kong/Pearl River Delta (PRD)
Regarding isoprene, the positive trends of correlation coefficients and regression slopes at the Central Western site signify the change of its sensitivity to temperature changes every summer when isoprene emission is at its highest level. Since sampling was less frequent from 2004, the data are considered limited to draw firm conclusions. A p-value of 0.26 for the isoprene trend () is not statistically significant at the 95% confidence level. The result is, therefore, used for reference only. Regarding other organics such as formaldehyde and acetaldehyde, which are commonly found and measured in Hong Kong (Cheng et al., Citation2010), no discernible trends are detected in the same statistical tests as described in section 2. Indeed, significant variations are found in the year to year trends of their correlation coefficients and regression slopes, sometimes even with intermittent negative values.
Considerable overlapping is found when juxtaposing the correlation maps in a with the (OMI) ozone concentration contour maps depicted in b. Both series of plots cover the dominant ozone season (July–September) of the years 2005, 2008 and 2010. Though the contours representing different levels of pollution do not coincide exactly, it is beyond doubt that the correlations coefficients are positively related to ozone concentrations. A causal (cause–effect) relationship appears to exist, implying that this increasing temperature sensitivity may have contributed to the increased ozone concentrations in the region. This relationship is tested on surface data by plotting the correlation coefficients against average maximum ozone for spring, summer, autumn for the Sha Tin and Central Western sites, from 1996/1998 to 2010. A moderate correlation emerges, with R=0.53 and 0.52 for the respective sites (b). This is believed to follow from the dependence of the rate of a chemical reaction on the concentrations of the reactants, except for zero order reactions. This relationship between sensitivity and ozone concentrations, therefore, comes as no surprise. R 2 values are significant as shown. Typically, ozone formation involves complex reactions of hundreds of precursors. On the other hand, correlation coefficients plotted against maximum temperatures for the same two sites and period do not indicate any positive links.
3.3. Assessing regional trends of ozone precursors
The strength of precursors, especially NOx and VOCs, is often an overriding factor in ozone formation. The annual average of NOx in urban areas of Hong Kong has remained quite constant over the past decade while the NO2 levels have levelled off in recent years (EPD, 2010). However, when the trends of ambient NOx and NO2 in Central Western station over a longer period of 1997–2010 are statistically tested (), p-values of 0.236 and 0.259 returned are not significant at the 95% confidence level (). It is, therefore, a little early to predicate a downward trend. The kerbside NO2 concentrations, on the other hand, tend to increase over the years (EPD, 2011). While surface-level NO2 measured in Guangzhou in the PRD fell from 2006 to 2010 (Guangdong PEMC/EPD, Citation2010) (not shown), the time series of OMI NO2 depicted as tropospheric column amount over Guangzhou reflects a slight decrease over the period October 2004–December 2010 (), the latter returning a significant p-value of 0.002 (). By and large, the OMI NO2 tropospheric column amount over Hong Kong and the PRD region, shown in a, has only slightly changed in autumn in parts of the region from 2004 to 2010. However, NO2 changes remarkably in summer when the monsoon reverses. The resultant inflow of southerly marine air (a) keeps Hong Kong fairly clean in summer.
Fig. 9 NOx, NO2 and VOC (total) (Central Western) and CO concentrations (Tsuen Wan) in Hong Kong 1997–2010. Notes: (a) VOC measurement commenced in 2000. (b) No CO data are available from Central Western.
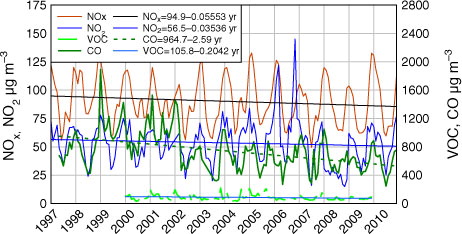
Fig. 10 NO2 OMI tropospheric column amount (clear, 0–30% cloud) and HCHO column amount, Guangzhou (PRD), Oct 2004–Dec 2010 (1015 molecules/cm2).
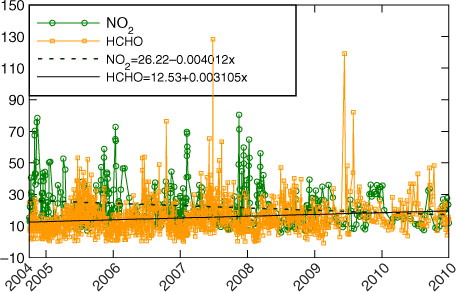
Fig. 11 (a) OMI NO2 tropospheric column amount in the Pearl River Delta/South China Region, autumn 2005 and 2010 and summer 2010 (b) AIRS total column concentration of carbon monoxide (CO) (1018 molecules/cm2) in 2002 and 2010 autumn.
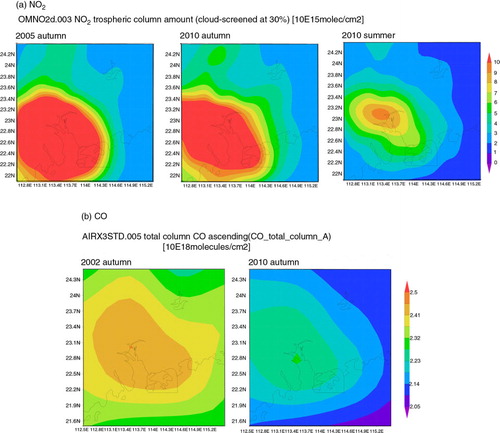
Levels of CO, a precursor of much less importance, remain low. The declining trend of surface CO in Central Western from 1997 to 2010 () has a very significant p-value of <0.001. This reduction in CO is also evident in the AIRS total column CO concentration for autumn for the entire PRD region (b). A similar situation is found in the total surface VOC concentration at Central Western () with p=0.003, which is consistent with the 1998–2007 VOC emission inventory released online by the EPD of Hong Kong. However, this total VOC measurement commenced in 2000 only and has not taken into account the reactivities of individual species.
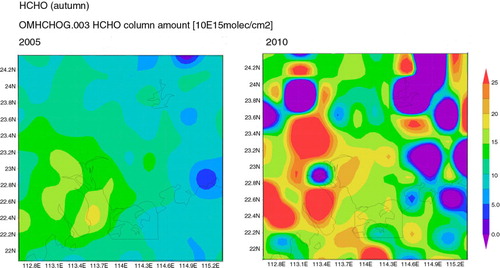
Formaldehyde, a reactive VOC with high RIR, was an effective proxy for hydrocarbon emissions and photochemical activity in the troposphere (Chance et al., Citation2000). The ground-level formaldehyde, acetaldehyde concentrations and the limited isoprene data for summer are presented in for the Central Western station. Formaldehyde displays a slight downward trend with a p-value significant at the 95% confidence level () for both summer and autumn. Isoprene also seems to have declined in summer () but it is not known if this is related to a decrease in terpenoids to which isoprene belongs, or a reduction of green cover that comes with increased urbanisation. For the PRD, the time series of formaldehyde as OMI column amount is shown for Guangzhou in for the October 2004–December 2010 period. The slight positive trend has a very significant p value of less than 0.001 (). A substantial increase in formaldehyde was found in the west/northwestern part of the PRD in the autumn of 2010, as compared to 2004 (). It is likely that similar increases exist for other reactive VOCs. The OMI formaldehyde trend, however, notably declined in the PRD in 2011 (not shown). The top 12 VOC species with the highest RIR have been identified by CitationCheng et al. (2010) for Tung Chung (Hong Kong) (), accounting for 85% of the total RIR. While the top three species with the highest RIR are formaldehyde, isoprene and acetaldehyde in Hong Kong, they are formaldehyde, m, p-xylene and toluene in Guangzhou.
Fig. 12 Reactive VOCs: formaldehyde, acetaldehyde and isoprene in Hong Kong (Central Western), to 2010 in summer.
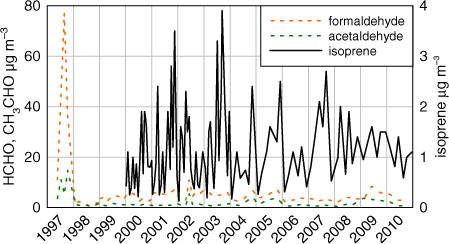
Fig. 13 OMI Formaldehyde column amount in autumn of 2004–2010 in the Pearl River Delta/South China region.
It has not been possible to estimate the contribution of isoprene to local ozone levels since the oxidation products needed for computation are not measured. Attempts to use other organic species reveal interferences. The relationship between isoprene and ozone also involves a dependence of isoprene on the level of ozone concentrations. Correlation is almost absent between isoprene and maximum ozone, but after ozone has been filtered at 120 µg m−3 for a linear relationship, a fairly strong correlation appears with R=0.72, implying a significant role of isoprene in high ozone concentrations in Hong Kong. As for methane, a VOC known to contribute to ozone formation on a global scale, it has been reported to rise sharply in 2007 (Rigby et al., Citation2008) after nearly a decade with little or no increase. While an increase in background ozone concentrations has been reported in Hong Kong (Wang et al., Citation2009), it is not known to what extent methane contributes in this region. Its possible role, however, has been suggested in the ozone increase in Europe (EEA, Citation2011).
3.4. Other factors
Precursors and a possible role of ozone's temperature sensitivity change discussed earlier are among the myriad factors dominating or contributing to the formation of ozone and its concentrations. Also significant are the transport of ozone and its precursors, climate driven changes, biogenic VOC emissions and biomass burning. Ozone's photochemical lifetime of the order of 1–2 months in the troposphere (Liu et al., Citation1987) is long enough for transport to take place over long distances. Ozone precursors or ozone itself can easily be carried to Hong Kong from upwind mainland China in the northeast monsoon season or when tropical storms are in the vicinity causing wind reversal (Lee et al., Citation2009). On the other hand, biomass burning in Indochina, Southwest and South China and even India and Africa (Lee et al., Citation2013) has also been revealed to be a source of precursors in spring and winter which can be easily transported by the upper westerlies in the jetstream seasons. Liu et al. (2002) has estimated a contribution of about 10–20 ppbv by sources as remote as the African Savanna to the upper/mid tropospheric ozone in Hong Kong.
Apart from the temperature sensitivity factor, meteorological effects may arise from the increased specific humidity which characterises a warmer climate. The hydroxyl radical (OH) which originates mainly from oxidation of water in the atmosphere, tends to react with VOCs or CO to initiate ozone formation. It is anticipated that OH will become more abundant. As a matter of fact, specific humidity has increased from 1997 to 2010 in South China as observed from satellite images (not shown). On the other hand, changes in some meteorological factors as observed in Hong Kong do not seem to favour ozone formation. The annual mean daily global solar radiation in Hong Kong (measured at King's Park, Hong Kong), for example, has been reported by HKO to decrease significantly from 1958 to 2011 at a rate of 0.72 MJ/m2/decade while the annual mean cloud amount which reduces sunlight, increased at 1.1% per decade from 1961 to 2011. The overall interaction between ozone and various climate factors has yet to be adequately defined.
4. Future ozone trend
With the enormous impact of ozone on air quality and global warming, and its widespread growth, especially in East Asia, a knowledge of the future concentrations of ozone is crucial to human welfare. In our first attempt to investigate future ozone, we take into account that ozone is often depleted by titration in high NOx emission regions such as the PRD region, thereby making the oxidant Ox (O3 and NO2) a more stable and better conserved entity to study (Clapp and Jenkin, Citation2001; Kondo et al., Citation2008; Song et al., Citation2011). For this reason the GISS ModelE2 predicts ozone as Ox. Historical emissions from CitationLamarque et al. (2010) and future emissions from RCP6.0 (Masui et al., Citation2011) were used. The RCP6.0 pathway represents a medium-high scenario with stabilisation from 2150 onwards (2005–2500). Historical reconstructions, as well as projections of ozone by ModelE2 based on periods of 11 years’ data, indicate that Ox levels in Asia will continue to rise in the years through to 2025 as they did in the 1995–2005 period.
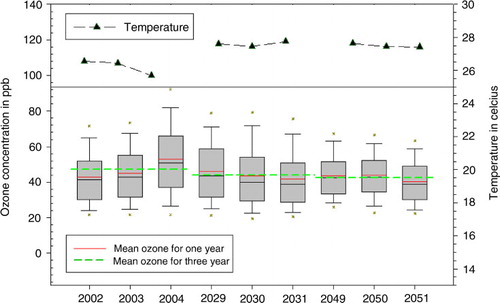
While CitationKatragkou et al. (2011) has predicted that the concentration of ground-level ozone is likely to increase towards the end of the century, estimations by CitationWild et al. (2012), based on results from 14 global chemistry transport models, suggest that ozone in Asia will increase until 2020 but will decrease afterwards. In an attempt to explore further the direction of regional ozone imposed by climate change, we performed additional simulations using NCAR's CESM (CAM) model which has a higher horizontal resolution, initially for the present (2002–2004) period, then projected into the future (2029–2031, 2049–2051). Taking into consideration China's pledge to reduce pollution, the slightly more optimistic medium-low emissions scenario RCP4.5 was tried out. This pathway exhibits shifts in land use over the 21st century and represents a future with net reforestation (Smith and Rothwell, Citation2013), thus taking into account the impact of future land cover on climate. Like RCP6.0, RCP4.5 has total radiative forcing stabilised shortly from 2150 onwards (2005–2500). The two scenarios differ only slightly in radiative forcing. Analysis was performed for the ozone season of July to November. Results depict an early upward trend for the ground-level ozone, then a slight downward course after 2029 as shown in . This estimated decrease over the Hong Kong/PRD region may perhaps be related to a decrease in NOx emissions in the region. The overall levels of anthropogenic NOx emission in the future climate from the scenario is projected to plateau out at 2020, with 37 Tg NO2/year for the Asian region (Clarke et al., Citation2007), where the level of NOx in 2003 is comparable with the level in 2028. It may be difficult to examine the effect of temperature on ozone in the RCP scenario since the change of emissions has been embedded in the model simulation. In 2030, the temperature effect on ozone is believed to have been compensated for by a reduction in NOx emissions, resulting in a reduction of overall ozone. Drawing from the combined simulation results derived from the ModelE2 and CESM models, photochemical pollution looks set to be a common occurrence in the region, despite prospects for improvement in the future. The quality of the model simulations and predictions was evaluated by comparing simulation results against observed measurements. Biases identified fall within the acceptable interquartile range of projection.
Fig. 14 Ozone trend (July–November) 2002–2051 by CESM (under RCP 4.5).
5. Conclusions
Concerns have been raised about the possible connections between the local and regional photochemical problem and global warming. This paper has focused on ozone, the trend of which is determined for Hong Kong and the South China region from surface data, against a background of significant positive temperature anomalies in the region. The sensitivity of ozone to air temperature rise was investigated for the period 1990s to 2010, with an examination of the possible temporal changes of this sensitivity in the wake of climatic warming. Trends in regional precursors which are the usual dominant driving factors, were studied. Future scenarios of ozone were also simulated.
An upward trend was observed in the mean ozone concentrations at all three measurement sites in Hong Kong in all seasons. The increase is most significant in autumn and particularly at the Sha Tin site (located in a valley) from 1997/8 to 2010. Overall, the increase in concentrations in autumn ranges from 1.0 to 1.62 µg m−3 per year. The smallest increase is found in summer. This tallies well with that of the PRD region with a similar trend (2006–2010) in Guangzhou. The column amount ozone (OMI) for the ozone season (July–September) reflects the same. The seasonal ozone increases in autumn and winter are consistent with temperature anomalies (at 925 hPa) observed in the region.
The increase in the sensitivity of ozone to temperature is clearly evident from the correlation between ozone (OMI column amount) and surface air temperature (AIRS) displayed in the correlation maps for the PRD during the prominently high ozone period of July–September. This sensitivity is observed to have increased from 2005 to 2010, the latter being the hottest year on record globally. To verify this temporal change in sensitivity, the ground-level trends of correlation coefficients/regression slopes are analysed for the same three monitoring sites from the mid/late1990s to 2010. As expected, results reveal a fairly smooth upward trend over a 14 year period for Sha Tin (1997–2010) with similar findings for the other two sites. P-values of <0.05 for the slopes of the trends are significant at the 95% confidence level. While the correlation revealed in the limited correlation maps compares fairly well with the corresponding (OMI) ozone maps when juxtaposed, temperature sensitivity of surface ozone also shows an association with ozone, with R=0.53 and 0.52 for the Sha Tin and Central Western sites, respectively. This temporal change of temperature sensitivity and its relationship with ozone concentration is believed to have adverse implications for the region.
As shown by ground measurements and/or satellite analyses, the surface precursors NO2 and NOx in Hong Kong have not changed persistently. The decrease over the years is not statistically significant while NO2 of the PRD has only very slightly changed as observed from satellite images. However, CO, whether it is surface or from satellite images, has declined remarkably (p<0.001) in the whole region. All these observations concerning precursors do not seem to adequately support an increasing ozone trend. As for VOCs, measured surface levels of formaldehyde, a proxy for VOC emissions, seem to have slightly decreased in Hong Kong from 1997 to 2010 (summer and autumn). By contrast, formaldehyde column amount (OMI) has risen significantly in the PRD (2004–2010), though only slightly in Guangzhou. Hence the reactive VOCs in the PRD are likely to be the main culprit for the increase of ozone, as far as precursors are concerned. As regards biogenic VOC, isoprene closely associates with ozone with R=0.72 after the daily maximum ozone has been filtered, suggesting its important role.
Based on the simulation results by the ModelE2 and CESM models on the ozone trend, photochemical pollution looks set to continue in the Hong Kong and South China region, despite prospects for improvement in the future.
6. Acknowledgements
The work described in this paper was supported by a grant from City University of Hong Kong (Project No. 9041479). Thanks are due to the Guy Carpenter Asia-Pacific Climate Impact Centre of the City University of Hong Kong for research grant support. The authors also gratefully acknowledge the Environmental Protection Department and the Hong Kong Observatory of the Hong Kong Special Administrative Region for the provision of air quality and meteorological data for the research. We also owe our special thanks to the NOAA-ESRL Physical Sciences Division (PSD) and the NASA GES DISC (Giovanni system) for analyses and visualisations generated on their online data systems.
Related Research Data
References
- Acker J. G. , Leptoukh G . Online analysis enhances use of NASA Earth science data. Eos. 2007; 88(2): 14–17.
- Bechle M. J. , Millet D. B. , Marshall J. D . Remote sensing of exposure to NO2: satellite versus ground based measurement in a large urban area. Atmos. Environ. 2013; 69: 345–353. 10.1016/j.atmosenv.2012.11.04.
- Bloomer B. J. , Stehr J. W. , Piety C. A. , Salawitch R. J. , Dickerson R. R . Observed relationships of ozone air pollution with temperature and emissions. Geophys. Res. Lett. 2009; 36: 09803.
- Chan H. S. , Kok M. H. , Lee T. C . Temperature trends in Hong Kong from a seasonal perspective. Clim. Res. 2012; 55: 53–63.
- Chan L. Y. , Chan C. Y. , Liu H. Y. , Christopher S. , Oltmans S. J. , co-authors . A case study on the biomass burning in southeast Asia and enhancement of tropospheric ozone over Hong Kong. Geophys. Res. Lett. 2000; 27(10): 1479–1482.
- Chance K. , Palmer P. I. , Spurr R. J. D. , Martin R. V. , Kurosu T. P. , co-authors . Satellite observations of formaldehyde over North America from GOME. Geophys. Res. Lett. 2000; 27(21): 3461–3464.
- Cheng H. , Guo H. , Wang X. , Saunders S. M. , Lam S. H. M. , co-authors . On the relationship between ozone and its precursors in the Pearl River Delta: application of an observation-based model (OBM). Environ. Sci. Pollut. Res. Int. 2010; 17: 547–560. [PubMed Abstract].
- Clapp L. J. , Jenkin M. E . Analysis of the relationship between ambient levels of O3, NO2 and NO as a function of NOX in the UK. Atmos. Environ. 2001; 35: 6391–6405.
- Clarke L. , Edmonds J. , Jacoby H. , Pitcher H. , Reilly J. , co-authors . Sub-report 2.1A of synthesis and assessment product 2.1 by the U.S. Climate Change Science Program and the Subcommittee on Global Change Research. Scenarios of Greenhouse Gas Emissions and Atmospheric Concentrations. 2007; Office of Biological & Environmental Research, Washington, DC: Department of Energy.
- Collins W. J. , Derwent R. G. , Garnier B. , Johnson C. E. , Sanderson M. G. , co-authors . Effect of stratosphere-troposphere exchange on the future tropospheric ozone trend. J. Geophys. Res. 2003; 108: 8528.
- Confalonieri U. , Menne B. , Akhtar R. , Ebi K. L. , Hauengue M. , co-authors . Parry M. L. , Canziani O. F. , Palutikof J. P. , van der Linden P. J. , Hanson C. E . Human health. Climate change 2007: Impacts, adaptation and vulnerability. Contribution of Working Group II to the Fourth Assessment Report of the Intergovernmental Panel on Climate Change. 2007; Cambridge, UK: Cambridge University Press. 391–431.
- Cooper O. R. , Parrish D. D. , Stohl A. , Trainer M. , Nédélec P. , co-authors . Increasing springtime ozone mixing ratios in the free troposphere over western North America. Nature. 2010; 463(7279): 344–348. [PubMed Abstract].
- Dufour G. , Eremenko M. , Orphal J. , Flaud J.-M . IASI observations of seasonal and day-to-day variations of tropospheric ozone over three highly populated areas of China: Beijing, Shanghai, and Hong Kong. Atmos. Chem. Phys. 2010; 10: 3787–3801.
- Environmental Protection Department (EPD), Hong Kong SAR. Air quality in Hong Kong. 2011 (reporting on monitoring results. 2010. Online at: http://www.aqhi.gov.hk/en/download/air-quality-reportse469.html?showall =&start=1 .
- European Commission, Science for Environment Policy, DG Environment News Alert Service. Analysing Trends in Tropospheric Levels of Ozone. 2011; The University of the West of England, Bristol.. Edited by SCU.
- European Environment Agency (EEA). Air Quality in Europe – 2011 Report. EEA,Copenhagen, Denmark. Technical Report 12/2011. ISSN 1725–2237.
- Guangdong Provincial Environmental Monitoring Centre (PEMC), Environmental Protection Department (EPD), Hong Kng SAR. Pearl River Delta regional air quality monitoring report. Report PRDAIR-2010–2. 2010. Online at: http://www.epd.gov.hk/epd/english/resources_pub/publications/m_report.html .
- Hansen J. , Sato M. , Ruedy R. , Lacis A. , Oinas V . Global warming in the twenty-first century: an alternative scenario. Proc. Natl. Acad. Sci. U. S. A. 2000; 97: 9875–9880. [PubMed Abstract] [PubMed CentralFull Text].
- Horowitz L. W. , Fiore A. M. , Milly G. P. , Cohen R. C. , Perring A. , co-authors . Observational constraints on the chemistry of isoprene nitrates over the eastern United States. J. Geophys. Res. 2007; 112: 12S08.
- Hou Y. L. , Chen B. D. , Yang X. C. , Liang P . Observed climate change in East China during 1961–2007. Adv. Clim. Change Res. 2013; 4(2): 84–91.
- Jacob D. J. , Winner D. A . Effect of climate change on air quality. Atmos. Environ. 2009; 43(1): 51–63.
- Katragkou E. , Zanis P. , Kioutsioukis I. , Tegoulias I. , Melas D. , co-authors . Future climate change impacts on summer surface ozone from regional climate-air quality simulations over Europe. J. Geophys. Res. 2011; 116: 22307.
- Kondo Y. , Morino Y. , Fukuda M. , Kanaya Y. , Miyazaki Y. , co-authors . Formation and transport of oxidized reactive nitrogen, ozone, and secondary organic aerosol in Tokyo. J. Geophys. Res. 2008; 113: 21310.
- Lamarque J.-F. , Bond T. C. , Eyring V. , Granier C. , Heil A. , co-authors . Historical (1850–2000) gridded anthropogenic and biomass burning emissions of reactive gases and aerosols: methodology and application, 2010. Atmos. Chem. Phys. 2010; 10: 7017–7039.
- Lamarque J.-F. , Emmons L. K. , Hess P. G. , Kinnison D. E. , Tilmes S. , co-authors . CAM-chem: description and evaluation of interactive atmospheric chemistry in the Community Earth System Model. Geosci. Model Dev. 2012; 5: 369–411.
- Lee Y. C. , Lam Y. F. , Kuhlmann G. , Wenig M. O. , Chan K. L. , co-authors . An integrated approach to identify the biomass burning sources contributing to black carbon episodes in Hong Kong. Atmos. Environ. 2013; 80: 478–487.
- Lee Y. C. , Wenig M. , Yang X . The emergence of urban ozone episodes in autumn and air temperature rise in Hong Kong. Air Qual. Atmos. Health. 2009; 2: 111–121.
- Leung Y. K. , Wu M. C. , Yeung K. K. , Leung W. M . Temperature projections in Hong Kong based on IPCC fourth assessment report. Hong Kong Meteorol. Soc. Bull. 2007; 17: 13–22. Hong Kong Observatory Reprint 764.
- Levy H., II , Schwarzkopf M. D. , Horowitz L. , Ramaswamy V. , Findell K. L . Strong sensitivity of late 21st century climate to projected changes in short-lived air pollutants. J. Geophys. Res. 2008; 113: 06102.
- Liu H. Y. , Jacob D. J. , Chan L. Y. , Oltmans S. J. , Bey I. , co-authors . Sources of tropospheric ozone along the Asian Pacific Rim: An analysis of ozonesonde observations. J Geophys Res-Atmos. 2002; 4573. 107(D21).
- Liu S. C. , Trainer M. , Fehsenfeld F. C. , Parrish D. D. , Williams E. J. , co-authors . Ozone production in the rural troposphere and the implications for regional and global ozone distributions. J. Geophys. Res. 1987; 92(D4): 4191–4207.
- Lollar B. S . Environmental Geochemistry, Treatise on Geochemistry. 2005; Elsevier, Amsterdam. Vol. 9. 2nd ed 630 p. .
- Masui T. , Matsumoto K. , Hijioka Y. , Kinoshita T. , Nozawa T. , co-authors . An emission pathway for stabilization at 6 Wm−2 radiative forcing. Clim. Change. 2011; 109: 59–76.
- Morris G. A. , Fishman J. , Creilson J. K. , Xu X. , Gallegos C. Y. , co-authors . An examination of the relationship between surface ozone observations from air quality monitoring networks and satellite-derived tropospheric ozone amounts from UV-backscattered measurements. 2009; Am. Geophys. Union . AGU Fall Meeting Abstracts, A233..
- Petritoli A. , Bonasoni B. , Giovanelli G. , Ravegnani F. , Kostadinov I. , co-authors . First comparison between ground-based and satellite-borne measurements of tropospheric nitrogen dioxide in the Po basin. J. Geophys. Res. 2004; 109: D15307.
- Rigby M. , Prinn R. G. , Fraser P. J. , Simmonds P. G. , Langenfelds R. L. , co-authors . Renewed growth of atmospheric methane. Geophys. Res. Lett. 2008; 35: L22805.
- Schmidt G. A. , Ruedy R. , Hansen J. E. , Aleinov I. , Bell N. , co-authors . Present day atmospheric simulations using GISS ModelE: comparison to in-situ, satellite and reanalysis data. J. Clim. 2006; 19(2): 153–192.
- Shindell D. T. , Faluvegi G. , Unger N. , Aguilar E. , Shmidt G. A. , co-authors . Simulations of preindustrial, present-day, and 2100 conditions in the NASA GISS composition and climate model G-PUCCINI. Atmos. Chem. Phys. 2006; 6: 4427–4459.
- Smith S. J. , Rothwell A . Carbon density and anthropogenic land-use influences on net land-use change emissions. Biogeosciences. 2013; 10: 6323–6337.
- Solomon S. , Qin D. , Manning M. , Chen Z. , Marquis M. , co-authors . Contribution of Working Group I to the Fourth Assessment Report of the Intergovernmental Panel on Climate Change, 2007. 2007; Cambridge, United Kingdom: Cambridge University Press.
- Song F. , Shin J. Y. , Jusino-Atresino R. , Gao Y . Relationships among the springtime ground–level NOx, O3 and NO3 in the vicinity of highways in the US East Coast. Atmos. Pollut. Res. 2011; 2: 374–383.
- Steiner A. L. , Davis A. J. , Sillman S. , Owen R. C. , Michalak A. M. , co-authors . Observed suppression of ozone formation at extremely high temperatures due to chemical and biophysical feedbacks. Proc. Natl. Acad. Sci. U. S. A. 2010; 107(46): 19685–19690. [PubMed Abstract] [PubMed CentralFull Text].
- Tracy A. , Trumbull K. , Loh C . The Impacts of Climate Change in Hong Kong and the Pearl River Delta. 2006. Civic Exchange, Hong Kong..
- Tsui K. Y. , Guenther A. , Yip W. K. , Chen F . A biogenic volatile organic compound emission inventory for Hong Kong. Atmos. Environ. 2009; 43(40): 6442–6448.
- UNEP/WMO. Integrated Assessment of Black Carbon and Tropospheric Ozone: Summary for Decision Makers. 2011; Nairobi: UNON/Publishing Services. ISO 14001:2004.
- Unger N. , Shindell D. T. , Koch D. M. , Streets D. G . Cross influences of ozone and sulfate precursor emissions changes on air quality and climate. Proc. Natl. Acad. Sci. 2006; 103(12): 4377–4380. [PubMed Abstract] [PubMed CentralFull Text].
- USEPA. National Air Pollutant Emission Trends: 1900–1998. 2000; Office of Air Quality Planning and Standards, Research Triangle Park, NC: USEPA. EPA 454/R-00–002.
- U.S. Government Printing Office. Code of Federal Regulations 40 CFR 51.100(s). 2003
- Wang T. , Wei X. L. , Ding A. J. , Poon C. N. , Lam K. S. , co-authors . Increasing surface ozone concentrations in the background atmosphere of Southern China, 1994–2007. Atmos. Chem. Phys. 2009; 9: 6217–6227.
- Wild O. , Fiore A. M. , Shindell D. T. , Doherty R. M. , Collins W. J. , co-authors . Modelling future changes in surface ozone: a parameterized approach. Atmos. Chem. Phys. 2012; 12: 2037–2054.
- Yoshitomi M. , Jacob D. J. , Mickley L. J. , Sygiel J . Observed ozone-temperature relationships as an indicator of the sensitivity of air quality to climate change. Presented at 4th GEOS-Chem Scientific and User's Meeting 2009. 2009; MA, USA: Harvard University.