
Abstract
Two diel field campaigns under different weather patterns were carried out in the summer and autumn of 2013 to measure CO2 and CH4 fluxes and to probe the rates of gas exchange across the air–water interface in a subtropical eutrophic pond in China. Bubble emissions of CH4 accounted for 99.7 and 91.67% of the total CH4 emission measured at two sites in the summer; however, no bubble was observed in the autumn. The pond was supersaturated with CO2 and CH4 during the monitoring period, and the saturation ratios (i.e. observed concentration/equilibrium concentration) of CH4 were much higher than that of CO2. Although the concentration of dissolved CO2 in the surface water collected in the autumn was 1.24 times of that in the summer, the mean diffusive CO2 flux across the water–air interface measured in the summer is almost twice compared with that in the autumn. The mean concentration of dissolved CH4 in the surface water in the autumn was around half of that in the summer, but the mean diffusive CH4 flux in the summer is 4–5 times of that in the autumn. Our data showed that the variation in gas exchange rate was dominated by differences in weather patterns and primary production. Averaged k 600-CO2 and k 600-CH4 (the gas transfer velocity normalised to a Schmidt number of 600) were 0.65 and 0.55 cm/h in the autumn, and 2.83 and 1.64 cm/h in the summer, respectively. No statistically significant correlation was found between k 600 and U 10 (wind speed at 10 m height) in the summer at low wind speeds in clear weather. Diffusive gas fluxes increased during the nights, which resulted from the nighttime cooling effect of water surface and stronger turbulent mixing in the water column. The chemical enhancements for CO2 were estimated up to 1.94-fold in the hot and clear summer with low wind speeds, which might have been resulted from the increasing hydration reactions in water due to the high water temperature and active metabolism in planktonic algae. However, both the air and surface water temperatures decreased continually, and relatively lower temperature and overcast weather with occasionally light rain dominated the second campaign in the autumn. The concentration of dissolved oxygen in the surface water and U 10 controlled gas transfer velocities of CO2 and CH4, respectively, in the cool autumn. When the surface water temperature was higher than the air temperature, higher CO2 flux was observed because the water body was unstable and overturned quickly, inducing quick CO2 emitted from plankton algae in surface water to the atmosphere.
A Corrigendum has been published for this paper. Please see http://www.tellusb.net/index.php/tellusb/article/view/27480
1. Introduction
Freshwaters can be substantial sources of CO2 and CH4 (Bastviken et al., Citation2008; Battin et al., Citation2009; Barros et al., Citation2011). Greenhouse gases emitted from lakes and reservoirs have recently received respective attention (Grossart et al., Citation2011; Whitfield et al., Citation2011; Jacinthe et al., Citation2012; Xiao et al., Citation2013a, Citation2013b; Yang et al., Citation2013). However, less attention has been paid to ponds, which are small in area and relatively shallow in depth but have various physical geographical characteristics and are usually with a eutrophic situation. The importance of small lakes and ponds in the global lake area/number and their roles in the global carbon cycle might have been underestimated (Downing et al., Citation2006; Kortelainen et al., Citation2006; Bastviken et al., Citation2008). Small wetland lakes and ponds that are often abundant in peatland areas can have high CO2 and CH4 emissions (Riera et al., Citation1999; Repo et al., Citation2007). So, it is important to obtain more detailed observational data of CO2 and CH4 fluxes across the water–air interfaces of these water bodies in various climate zones.
The diffusive gas fluxes can either be measured directly or calculated from the surface water and air concentrations if the gas transfer velocity (k) is known (Guérin et al., Citation2007). Direct measurements at many sites may be laborious; thus, the latter method is preferred. The diffusive gas flux (F) across the air–water interface can be expressed as:1 where C
w is the concentration of gas in the surface water, and C
sat is the concentration of gas in the surface water at equilibrium with the overlying atmosphere (Raymond and Cole, Citation2001). Both C
w and C
sat can be measured directly or indirectly.
Considerable efforts have been made in different systems in order to quantify k, which is the parameter in eq. (1) most prone to errors (Raymond and Cole, Citation2001) and primarily controlled by turbulent mixing on the water side of the air–water interface (Wanninkhof et al., Citation2009). Wind dominates turbulence at the air–water interface in lakes, reservoirs and oceans (Upstill-Goddard et al., Citation1990; Guérin et al., Citation2007; Wanninkhof et al., Citation2009). Both sheer stresses at the riverbed and wind at the water surface result in turbulence at the air–water interface in large rivers (Beaulieu et al., Citation2012). However, the large heterogeneity of aquatic systems raises questions about the appropriateness of using a single wind-based model to predict k in all aquatic systems (Vachon and Prairie, Citation2013). The existence of a unique and universal wind–k relationship for all aquatic systems is highly questionable given that for any wind speed, its effect on gas exchange is unlikely to be the same in the ocean and, for example, in a small kettle lake. This problem is particularly severe in small, partly wind-sheltered aquatic environments, which occur very common globally (Downing et al., Citation2006; Cole et al., Citation2010; Vachon et al., Citation2010).
In this study, we investigate the dependence of k on various environmental parameters [air pressure, water pH, sun light intensity, Chl-a and dissolved oxygen (DO) concentrations in water, wind speed, air and water temperatures] in a subtropical eutrophic shallow pond. We place our emphasis on gas transfer processes influenced by different weather patterns and algal metabolism for a small shallow freshwater system located in a subtropical zone in China. As chemical enhancement is observed as independent of physical forcing at low gas transfer velocities (Wanninkhof and Knox, Citation1996), we also discussed the chemical enhancement of CO2 transfer owing to low gas transfer velocities observed in this study.
2. Materials and methods
2.1. Study area and monitoring sites
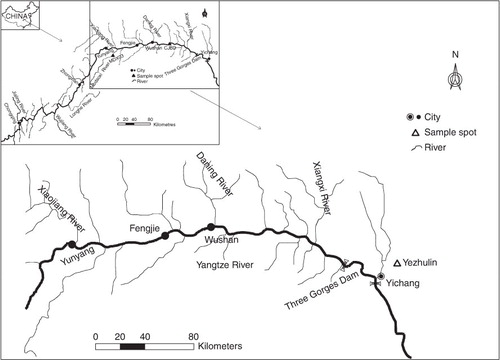
The pond (111°20′50.16″E, 30°44′30.978″N) () is located at a suburban district of Yichang city, Hubei province, Central China. The region is under a subtropical continental monsoon climate regime with a large temperature variation in the spring, heavy rain and drought in the summer, wet in the autumn and humid and snowy in the winter. The mean annual temperature is 16.9°C, and the average rainfall is 1215.6 mm. The pond is about 2500 m2 with a maximum and mean water depth of 2.5 and 1.5 m, respectively. It is surrounded by a small restaurant and is a popular fishing area. The total nitrogen and phosphorus concentrations in waters are about 0.067 and 0.020 mg/L, respectively. The pond bottom is covered with soft and very thin organic sediments with the total organic carbon content of 27.92 mg/g. The waters appeared green in colour owing to a great deal of the growing algae.
Fig. 1 Location of the sampled pond in China.
Two diel field campaigns, which were carried out on July 22–24, 2013, and October 15–16, 2013, respectively, were undertaken at three sites within the pond. During the first monitoring period which lasted 48 hours, we carried out flux measurements at two sites, which were located at 2 and 5 m, respectively, away from its bank, with depths of 1.2 and 1.5 m (here marked as Site N and Site F). During the second monitoring period, we carried out flux measurements at Site M, which was located in the middle between Site N and Site F. The sky was clear during the first monitoring period, and was overcast during the second period.
2.2. In situ sampling measurements and analysis
Surface and bottom water temperatures (Ts and Tb), pH, air temperature (Ta), air pressure (Pa), sun light intensity (Sli) and wind speed (Swi) were measured at these sites. Water temperature, pH and DO concentration in water were measured using the multi-parameter instrument Orion Star A329 (Thermo Fisher Scientific Inc., Waltham, MA USA). Water samples were taken from depths of 0.1 m below the water surface and 0.1 m above the bond bottom for analysis of chlorophyll-a (Chl-a) concentration and dissolved CH4 and CO2. Water samples (350 mL) were collected and transported to the laboratory for Chl-a analysis using the national standard method (Wang et al., Citation2002). A headspace equilibration technique was used to quantify dissolved gas concentrations in water (C
w, mol/L). A 300-ml water sample was collected and injected into a 1500 ml pre-cleaned and evacuated gas sampling bag, and 1 ml saturated HgCl2 solution was added immediately to kill microbes in the bag. The bag was then transferred to the lab, and a 600-ml sample of highly purified nitrogen was injected into it. The bag was then ultrasonicated for 3 minutes at 40 KHz and left standing for 24 hours. The gas concentration in its headspace gas-phase (C
gas, mol/L) was then analysed with a Los Gatos Research's Greenhouse Gas Analyzer (DLT-100) (Los Gatos Research, Mountain View, California, USA). Dissolved gas concentration in water was calculated according to the equation given by Johnson et al. (Citation1990):2 where C
gas (mol/L) is the gas concentration in the gas-phase after equilibration; β is the Bunsen coefficient (L/L/atm); R is the universal gas constant (0.082, L.atm/mol/K); T (K) is the temperature; 22.356 (L/mol) is the molar volume of a gas; and V
liq and V
gas are volumes of liquid and gas in a headspace vessel.
Wind speed was measured with a portable aero vane at 2 m height for all stations. Wind speed at 10 m height (U
10) was calculated using the following formula (Amorocho and DeVries, Citation1980):3 where C
10 equals the surface drag coefficient for wind at 10 m (1.3×10⁻³) (Stauffer, Citation1980); k
c equals the von Karman constant (0.41); and z is the height of wind speed measurement (meter) above the water surface.
2.3. Water-to-air fluxes
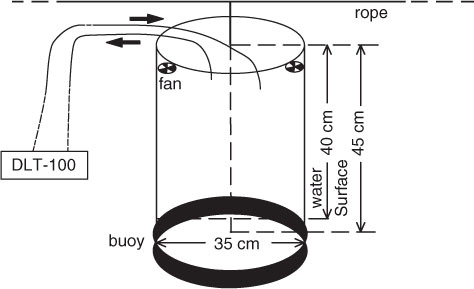
A static closed floating chamber system was used to measure CH4 and CO2 fluxes across the water-air interface throughout the diel period. The chambers are non-transparent, thermally insulated vertical tubes with a volume of 43.30 L and a surface area of 0.096 m2 (diameter and height are 0.35 and 0.45 m, respectively). Two chambers employed here were hanged to a rope, located over the pond with both endpoints firmly tied to pillars. One buoy was fixed on the lower portion of each chamber, allowing for precisely 5 cm of each chamber to rest below the water surface during flux monitoring. Only the portion above the water was taken into account when calculating the gas flux. Two fans (12 V, 0.22 A) were fixed at the top within each chamber to properly mix the air inside within each chamber headspace while not disturbing the water surface (). When we measured the emission flux of CH4 and CO2 across the water–air interface, one chamber was connected to a DLT-100 Gas which could monitor the CH4 and CO2 concentrations inside the chamber continuously at a frequency of 1 Hz. The DLT-100 is a cavity ringdown spectrometer with high resolution (0.1 ppb) and precision (1% of the reading accuracy) and that has been used and described in detail in literature (Hendriks et al., Citation2008; Eugster and Plüss, Citation2010; Hendriks et al., Citation2010; Herbst et al., Citation2011; Schroth et al., Citation2012; Xiao et al., Citation2013a, Citation2013b).
Fig. 2 Schematic design of a static chamber for measuring gas fluxes.
During the first monitoring period, two separate chambers were employed to make alternate monitoring between Sites N and F. A single flux measurement usually finished within 30 minutes. Only one chamber was used to monitor gas fluxes at Site M during the second observation period.
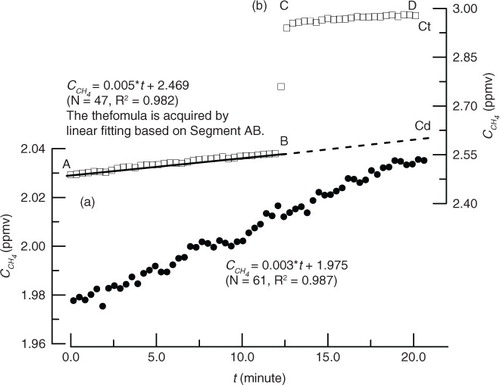
When there was no or little gas bubbles present in the chamber, CH4 and CO2 concentrations gradually curve over time in a straight line due to the increase or decrease of gas concentrations in the chamber (a). Under this situation, a simple linear regression method was used to calculate the releasing rate and the flux of gases, which was described in detail by Lambert and Fréchette (Citation2005). The gas concentration in the chamber will increase abruptly when bubbling occurs (b). We can separate the bubble and diffusion flux using data acquired by the DLT-100 Analyzer thanks to its high sampling frequency. First, the gas diffusive rate (0.005 ppmv/minute on b) is acquired by a linear fitting based on a relatively long and stable straight segment (for example, AB on b). Then, the diffusive concentration inside the chamber was derived from multiplying the gas diffusive rate by the time at the monitored endpoint. The surplus CH4 concentration in the chamber produced from bubble emissions was equal to the concentration at the monitored endpoint (Ct on b) minus the diffusive concentration and the original background value.
Fig. 3 Curve patterns of changes in CH4 concentration without bubble (a) and with bubble (b) during a single flux monitoring period.
2.4. Calculation of the gas transfer velocity
We calculated C
sat in eq. (1) with the Henry's Law (Sander, Citation1999),4 where c
g=gas concentration in the overlying atmosphere, R=gas constant, T=temperature, k
H =the Henry's law constant, k
H
O–=the Henry's law constant at 298.15 K, Δsoln
H/R= −d(ln k
H)/d(1/T) and T
O–=298.15 K.
We calculated k with eq. (1), where F is only the diffusive flux, and bubble flux was not included. To compare the exchange coefficient for different gases and at different water temperatures, the gas transfer velocity was normalised to a Schmidt number of 600 (Sc=600, for CO2 at 20°C) with the following equation (Jähne et al., Citation1987):5 where k
g,T and Scg,T are the transfer velocity and Schmidt number of a given gas and temperature, respectively (Wanninkhof, Citation1992). We calculated temperature specific Sc values using equations presented by Wanninkhof (Citation1992). Here we used n=2/3 for all wind speeds <3.7 m s−1 (Liss and Merlivat, Citation1986).
2.5. Enhancement factor calculations of the gas transfer velocity
The chemical enhancement of CO2 gas resulting from two hydration reactions 6 and 7 in water is a function of temperature, pH and ionic strength (Wanninkhof and Knox, Citation1996).6
7
Here the H&B model proposed by Hoover and Berkshire (Citation1969) and later modified by Wanninkhof and Knox (Citation1996) was used to calculate model predictions of the enhancement factor owing to its simplicity. The chemical enhancement factor for the model can be expressed as (Wanninkhof and Knox, Citation1996)8
Q=(r T D −1)0.5 (cm−l), where r=r 1+r 2 K′w α H−1 (s−l), T=1+α H 2/(K′1 K′2+K′1 α H) (dimensionless) and z=D/k−CO2 (cm). In addition, r l (s−l) and r 2 (L/mol/s) are the hydration rate constant for reactions 6 and 7, respectively; K′w is the apparent dissociation constant for water; α H is the activity coefficient for the hydrogen ion; D (m2/s) is the molecular diffusion coefficient for CO2; and K′1 and K′2 are the first and second apparent dissociation constants for carbonic acid, respectively. We calculated D with the formulation D=14.6836×10⁻⁹ [(273.15+t)/217.2056−1]1.997, where t is the water temperature in Celsiusdegree (Zeebe, Citation2011). r l and r 2 were given by Johnson (Citation1982), and the apparent dissociation constants for carbonic acid were given by Dickson and Millero (Citation1987).
Chamber estimates of the chemical enhancement factor can be expressed as9
3. Results
According to our data, bubble emissions of CH4 and CO2 accounted for 99.7% of the total CH4 emission, and only 3.0% of the total CO2 at Site F, and CH4 ebullition occurred in 44 of all 48 monitored segmentations (91.67%). At Site N, bubble emissions of CH4 and CO2 accounted for 96.41% of the total CH4 emission and 3.43% of the total CO2 from the pond, respectively. CH4 ebullition occurred in 21 of all 48 monitored segmentations (43.75%). However, no bubble was observed at Site M during the monitoring period. This may indicate complex factors affecting the diffusive processes of the two gases. The most probable factor responsible for the seasonal difference is that methane bubbles in the summer resulted from the degradation of dead algae instead of old sedimentary organic matters. These algae, which had derived from high primary productivity and settled on the bottom of the pond, were decomposed quickly in the hot summer. In contrast, the primary productivity was low due to the cool weather in the autumn, and thus organic matter was inadequate for methane accumulation. This issue requires to be investigated further. The data acquired at Site F were not analysed in this paper owing to the high frequent bubbles.
3.1. Variations in environmental factors
Variations in environmental parameters at Site N were different from those at Site M (); this suggests that the weather situation may dominate gas flux processes and transfer velocities. Air temperature, pressure and both the surface and bottom water temperature appeared to have diel changes during the first monitoring period, which corresponded to the rotation of the earth (). However, the air temperature experienced a decreasing trend during the second monitoring period, which might result from the season shifting. Accordingly, the surface water temperature decreased gradually (). The air temperature was higher than the surface water temperature before around 23:00 October 15, 2013, and opposite situation occurred after that time, which induced the water body to have been more unstable. Wind speeds were low during both field investigations, and in fact, they were too low to be measured most of the times ( and ).
Fig. 4 Changes of environmental factors and gas fluxes during the first monitoring period.
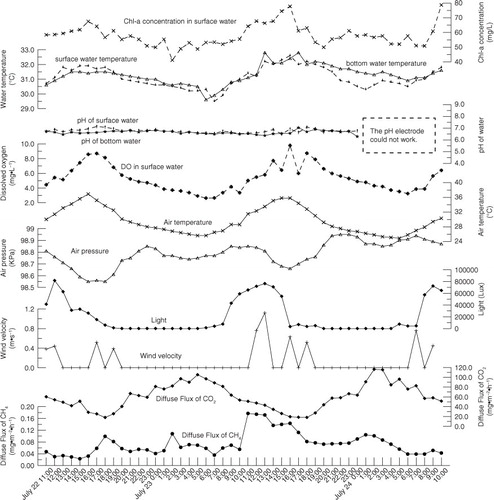
Fig. 5 Changes of environmental factors and gas fluxes during the second monitoring period.
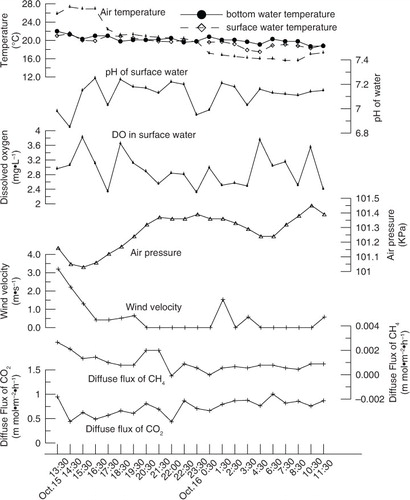
Table 1. Variation of environmental factors, gas fluxes and transfer velocities
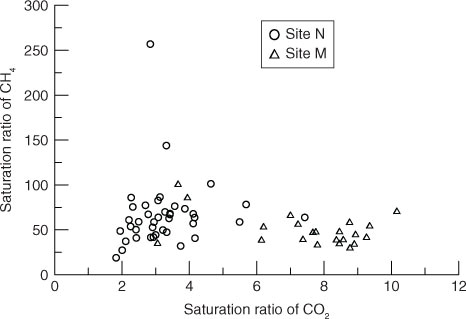
Surface water was supersaturated in both CH4 and CO2 with respect to the atmospheric equilibrium. The saturation ratios of CH4 were much higher than that of CO2 (). The average concentration of dissolved CO2 in the surface water collected from Site M was 1.24 times that of at Site N; however, the mean diffusive CO2 flux across the water–air interface measured at Site N was almost twice as that at Site M (). The mean concentration of dissolved CH4 in the surface water at Site M in October was around half of that at Site N, but the mean diffusive CH4 flux at Site N in July is 3–4 times higher than that of Site M.
Fig. 6 The saturation ratio of CO2 and CH4 measured during the two surveys.
3.2. Gas transfer velocity
Averaged k 600-CO2 and k 600-CH4 at Site M (0.65 and 0.55 cm/h) were much lower than those at Site N (2.83 and 1.64 cm/h) (), and the latter agreed with many previous reports from lakes and reservoirs at low wind speeds. At the Petit-Saut Reservoir (French Guiana) surface, the gas transfer velocities obtained from floating chambers were 2.2±1.4 and 1.9±1.0 cm h−1 for k 600-CO2 and k 600-CH4 for U 10<2 m s−1, respectively. For wind speeds ranging from 0.1 to 4.6 m s−1, the k 600-CO2 was 2.4±1.5 cm h−1 and k 600-CH4 was 2.8±1.7 cm h−1 (Guérin et al., Citation2007). In general, the gas transfer velocity calculated from SF6, which resulted from a tracer experiment in a small lake of north of the New York City, was approximate to that at Site N. On small (<50 ha) wind-sheltered (mean wind<3 m s−1) lakes, which are situated in Northern Michigan, USA, and are representative of a large area in the north temperate regions of the world, k 600 was likely close to 2.08 cm h−1 (Cole et al., Citation2010).
In contrary, k 600-CO2 and k 600-CH4 at Site M were only 0.72 and 0.53 cm/h, respectively, much smaller in comparison with other data reported, with the exception of a recent result (Cole et al., Citation2010) obtained from a wind speed model of Liss and Merlivat (Citation1986). However, a k 600 lower than 1 cm h−1 for very low wind speed was found on a temperate reservoir (ΔT=Ts−Ta=−1.4°C) (Frost and Upstill-Goddard, Citation2002).
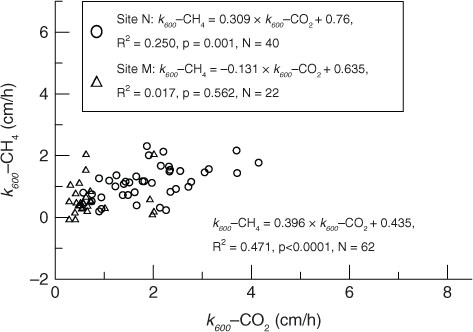
Gas transfer velocities derived from CH4 (k 600-CH4) to CO2 (k 600-CO2) were not statistically different at Site M, but were higher than that at Site N (). Significant correlations of gas transfer velocities between CO2 and CH4 were not observed at Site M, but did occur at Site N (). This may indicate that gas transfer velocities of the two sites were dominated by different factors. However, a significantly positive correlation between k 600-CH4 and k 600-CO2 was also found when combining the measurements of Site M (all having low k 600 values) and Site N ().
Fig. 7 Relationship between gas transfer velocities derived from CO2 and CH4, standardised to a Schmidt number of 600 (k 600).
4. Discussion
Concentrations of Chl-a in water were high during both monitoring periods. However, gas flux processes during the two monitoring periods were completely different ( and ), which might result from the different weather patterns. The averaged k 600-CH4 and k 600-CO2 at Site M were much lower than those at Site N, which was not proportional to their dissolved concentrations ().
4.1. Influence of wind speed on k 600
Our data showed no significant correlation between k 600 and U 10 at Site N in the pond, which might indicate that low wind speeds might not be a key factor to control gas transfer velocities in the summer (). The phenomenon without strong dependence of gas transfer velocity on wind speed for low wind speeds (U 10<3.7 m·s−1) was pervasive in summers (Crill et al., Citation1988; Clark et al., Citation1995; Cole and Caraco, Citation1998; Crusius and Wanninkhof, Citation2003).
Fig. 8 Relationships between k 600 values derived from CO2 (k 600-CO2) and CH4 (k 600-CH4), and wind speed corrected to a height of 10 m (U 10).
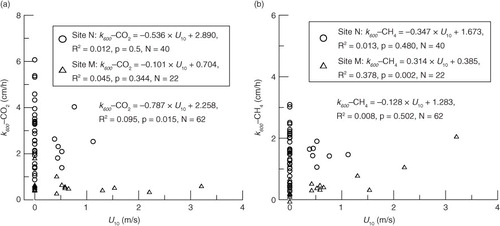
Significant correlation between k 600-CH4 and U 10 was only observed at Site M in the autumn (; k 600-CH4=0.314U 10+0.385). It showed that low wind speeds still dominated the rate of CH4 exchange across the air-water interface in cool weather. At very low wind speed (<3.7 m s−1), a weak dependency of k 600 with wind speed was also observed at the Petit-Saut Reservoir (Guérin et al., Citation2007) along with several other studies at lakes (Wanninkhof et al., Citation1985; Liss and Merlivat, Citation1986; Wanninkhof, Citation1992; Cole and Caraco, Citation1998). The slope of our linear regression function was 0.314 cm h−1/m s−1, which was much lower than previous reports. The slope of the relationship was 0.7 cm h−1/m s−1 for wind speed<3.7 m s−1 on the Petit-Saut Reservoir (Guérin et al., Citation2007).
4.2. Controls of other environmental factors on k 600 in the summer
As stated above, main environmental parameters during the first monitoring period appeared to have diel changes with the rotation of the earth (). Diel diffusion gas fluxes at Site N during the observation period in the summer were significantly positively correlated to the air pressure, and negatively correlated to the air temperature and light (). In addition, the diel diffusive CO2 gas flux was also significantly positively correlated to DO, surface water temperature, pH, wind speed and Chl-a. In the summer, the average dissolved CO2 concentration in water during nighttime was higher than that during daytime. On the contrary, the average Chl-a concentration of water during night was lower than that during daytime (). Both variations of dissolved CO2 and Chl-a concentrations resulted from the metabolism of phytoplankton. The average dissolved CO2 concentration in water of night and daytime was 132.27 and 106.28 µ mol/l, respectively. However, the average diffusive CO2 flux of night (1.87 m mol·m−2·h−1) was about two times that of daytime (0.94 m mol·m−2·h−1) (). In addition, the average diffusive CH4 flux of night (0.0043 m mol·m−2·h−1) was higher than that of daytime (0.0035 m mol·m−2·h−1) () although the average dissolved CH4 concentration in water of nighttime and daytime was very approximate (0.42 and 0.41 µ mol/l, respectively). We explain the differences as results from the nighttime cooling effect of water surface, which might accelerate turbulent mixing in the water column and enhancing the gas transfer velocity. At low wind speed conditions, convective cooling contributed significantly to gas exchange in lakes (Crill et al., Citation1988; Macintyre et al., Citation2002; Crusius and Wanninkhof, Citation2003). Diffusive methane flux could increase during the night because evaporative and sensible heat losses dominate the surface heat fluxes, and unstable the development of temperature gradients and convective mixing occur (Crill et al., Citation1988). Measured gas flux was up to five times higher when heat was being lost from the surface layer of an arctic lake and wind speeds were low than when wind speeds were 5 m s−1 (Macintyre et al., Citation2002).
Table 2. Average values of several environmental factors, diffusive gas fluxes and gas transfer velocity of diel monitored data according to the weather condition
Table 3. Correlation coefficients between diel diffusion flux, the dissolved gas concentration and the gas transfer velocities of CO2 and CH4 and the main environmental factors
4.3. Controls of other environmental factors on k 600 in the autumn
Relatively low temperature and overcast weather with occasionally light rain dominated the second campaign in the autumn, which subsequently lowered the metabolism of phytoplankton in the pond. Diel CO2 fluxes at Site M were significantly positively correlated to the air pressure, and negatively correlated to the air temperature and surface water temperature (). However, the diel CH4 flux was significantly positively correlated to air temperature, surface water temperature and U 10, and negatively correlated to the air pressure.
In our study, DO in the surface water was closely related to the respiration of plankton algae. Cloudy weather profoundly influenced DO concentrations in ponds (Romaire and Boyd, Citation1979). On clear days, there is sufficient light for high rates of photosynthesis, and DO concentrations normally are high. On cloudy day, photosynthesis is limited by insufficient light, and DO concentrations often are low (). The probability of DO depletion is much greater during nights following cloudy days than during nights following clear days (Boyd and Tucker, Citation1998).
Because both the air and surface water temperature decreased continually during the second monitoring period (), we averaged gas fluxes and environmental factors according to the comparison between the surface water temperature and the air temperature (). When Ts−Ta>0, it resulted in heat losing and cooling of the water surface, which might enhance the gas transfer velocity. The average k 600-CH4 of Ts−Ta<0 was more than two times that of Ts−Ta>0 () although the average dissolved CH4 concentration in water of the two phases was almost the same (0.19 µ mol/l). We attributed this situation to changes of the wind speed. The average wind speed of Ts−Ta<0 was much bigger than that of Ts−Ta>0 (), and k 600-CH4 was significantly positively correlated to U 10 (). A weak dependency of k 600 with low wind speed was also observed at several other lakes (Wanninkhof et al., Citation1985; Liss and Merlivat, Citation1986; Wanninkhof, Citation1992; Cole and Caraco, Citation1998; Guérin et al., Citation2007).
The average dissolved CO2 concentration in water of Ts−Ta>0 (148.03 µ mol/l) was approximate to that of Ts−Ta<0 (150.41 µ mol/l), but the average diffusive CO2 flux of Ts−Ta<0 (0.79 m mol·m−2·h−1) was much higher than that of Ts−Ta>0 (0.54 m mol·m−2·h−1) (). Although the air temperature decreased continually and the surface water temperature was lower than the air during the latter half segment of the second monitoring period, the average gas fluxes and gas transfer velocities during the autumn were still much smaller than those during the summer (). In addition, changes of both gas fluxes of and transfer velocities of CO2 and CH4 were opposite between time spans of Ts−Ta>0 and Ts−Ta<0. It may indicate that the cooling effect of water surface, which might induce turbulent mixing in the water column (penetrative convection) and enhancing the gas transfer velocity in thermal stratified water body (MacIntyre et al., Citation2002), was not the key factor to have enhanced gas exchanging in the pond during the second monitoring period. We believe that the most important reason might be the metabolism of phytoplankton and disturbance situation of water body.
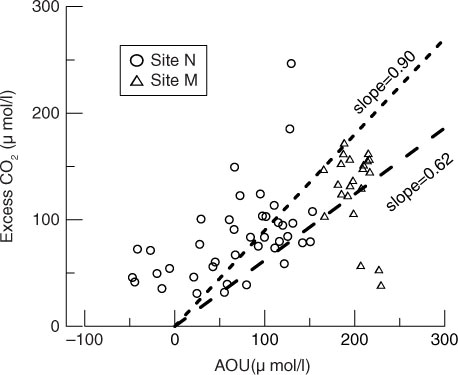
The water body in the pond was more stable under the condition of Ts−Ta<0 than that of Ts−Ta>0. DO was consumed and CO2 was produced because the respiration of plankton algae preceded its photosynthesis in overcast weather. When Ts−Ta>0, the unstable water body overturned more quickly, which might induce quick CO2 emitting from plankton algae in surface water and directly enter into the air. Thus, we observed enhanced CO2 emission, which also changed the inner relationship of the diffusive fluxes between CO2 and CH4. We verified it from a quantitative point of view with a plot of excess CO2 (=dissolved CO2 concentration measured−C sat-CO2) vs. AOU (apparent oxygen utilisation=saturated DO−measured DO) (). According to , most respiration quotients (=excess CO2: AOU) at Site M fell in the range of 0.62–0.90, which was stoichiometric ratio of aerobic biological respiration in the environment with abundance of HCO3 − (Chen et al., Citation1996; Taylor et al., Citation2003; Zhai et al., Citation2005). We can make it sure based on estimated uncertainty of C w and lack of duplicate C w measurements. However, respiration quotients at Site N varied greatly owing to alternative photosynthesis and respiration of plankton algae ().
Fig. 9 Excess CO2 vs. AOU in the pond. The two dashed lines show the upper limit (slope=0.90) and the lower limit (slope=0.62) for stoichiometric ratio of aerobic biological respiration in the environment with abundance of HCO3 − (Taylor et al., Citation2003; Zhai et al., Citation2005).
In a summary, the process of gases exchanging across the water-air interface in the eutrophic pond was dominated by both the difference in weather conditions and the algal metabolism.
4.4. Enhanced exchange of CO2
compares the chemical enhancement factor of model predictions (α) with that of the chamber estimates (γ) for the observed pH and temperature corresponding with the chamber deployments. It appears that chamber estimates (γ) are lower than model predictions (α) during most of the monitoring period.
Fig. 10 Chamber estimates of chemical enhancement factor (γ) plotted vs. H&B model predictions of chemical enhancement factor (α).
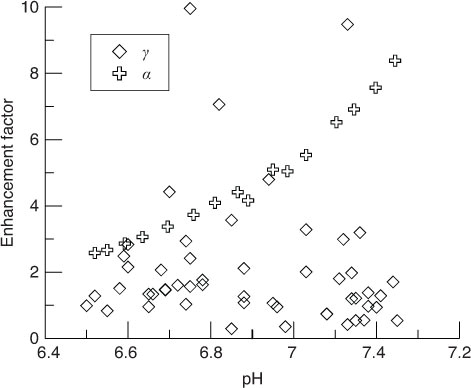
The mass transfer coefficient of CO2 could be chemically enhanced by 1.94-fold in the summer. The enhancement factor for CO2 estimated here was smaller than that reported in other lakes with high pH owing to the low pH in the pond. Increasing enhancement with increasing pH was observed pervasively with high pH in previous reports (Hoover and Berkshire, Citation1969; Wanninkhof and Knox, Citation1996; Bade and Cole, Citation2006). The mass transfer coefficient of CO2 was chemically enhanced by 3.5- to 7.5-fold in an experimentally eutrophied lake, which pH rose more than 9.5 (Bade and Cole, Citation2006). Large enhancements were also observed in experimental ditches with high biological productivity (Portielje and Lijklema, Citation1995). The enhancement factor for CO2 was bigger during the daytime (2.94) than that during the night in the summer (1.84) (). It was a response to the higher pH value resulted from high productivity during days. Under clear weather, the photosynthesis in plankton algae preceded their respiration during daytime, and the Chl-a concentration in water was higher during day than that during nighttime ().
Chemical enhancement factor of the chamber estimates (γ) was larger during Ts−Ta>0 than Ts−Ta<0 in the autumn. However, we could not discuss how degree on γ was influenced by the change of pH owing to the CO2 contribution from varying respiration of plankton algae in the overcast autumn mentioned above.
5. Conclusion
The mean diffusive CO2 flux across the water–air interface measured in the summer is almost twice compared with that in the autumn, and the mean diffusive CH4 flux in the summer is 4–5 times of that in the autumn. Our data acquired from the small eutrophic pond in a subtropical zone in China indicated that gas transfer velocities of CO2 and CH4 at low wind speeds in the summer were much higher than those in the autumn. The weather patterns and algal metabolism dominated the gas transfer velocities of CO2 and CH4. Chemical enhancements for CO2 were observed in the hot summer under clear weather with low wind speeds, which might result from the increasing hydration reactions in water. Diffusive gas fluxes increased during the nights owing to the nighttime cooling effect of water surface in the summer. A dependency of k 600-CH4 with low wind speed was also observed when the surface water temperature was lower than the air temperature in the autumn. When the surface water temperature was higher than the air temperature, higher CO2 efflux across the air-water interface occurred as a result of quick CO2 emitted from plankton algae in surface water. The process was strengthened by the unstable and quickly overturning water body.
Acknowledgements
This work was financially supported by the National Science Foundation of China (No. 41273110, 51179205), the Natural Science Foundation of Hubei province, China (No. 2014CFB672), and Major Science and Technology Program for Water Pollution Control and Treatment (No. 2012ZX07104-001). The manuscript was completed while the senior author spent a 1 yr research visit at Bryant University, and this publication is also the contribution 201401 from the Laboratory of Terrestrial Environments at Bryant University.
Notes
A Corrigendum has been published for this paper. Please see http://www.tellusb.net/index.php/tellusb/article/view/27480
Related Research Data
References
- Amorocho J. , DeVries J. J . A new evaluation of the wind stress coefficient over water surfaces. J. Geophys. Res. 1980; 85: 433–442.
- Bade D. L. , Cole J. J . Impact of chemically enhanced diffusion on dissolved inorganic carbon stable isotopes in a fertilized lake. J. Geophys. Res. 2006; 111: 01014.
- Barros N. , Cole J. J. , Tranvik L. J. , Prairie Y. T. , Bastviken D. , co-authors . Carbon emission from hydroelectric reservoirs linked to reservoir age and latitude. Nat. Geosci. 2011; 4: 593–596.
- Bastviken D. , Cole J. J. , Pace M. L. , Van de Bogert M. C . Fates of methane from different lake habitats: connecting whole-lake budgets and CH4 emissions. J. Geophys. Res. 2008; 113: G02024.
- Battin T. J. , Luyssaert S. , Kaplan L. A. , Aufdenkampe A. K. , Richter A. , co-authors . The boundless carbon cycle. Nat. Geosci. 2009; 2: 598–600.
- Beaulieu J. J. , Shuster W. D. , Rebholz J. A . Controls on gas transfer velocities in a large river. J. Geophys. Res. 2012; 117: 02007.
- Boyd C. E. , Tucker C. S . Pond Aquaculture Water Quality Management. 1998; Kluwer Academic Publishers, Boston.
- Chen C.-T. A. , Lin C.-M. , Huang B.-T. , Chang L.-F . Stoichiometry of carbon, hydrogen, nitrogen, sulfur and oxygen in the particulate matter of the western North Pacific marginal seas. Mar. Chem. 1996; 54: 179–190.
- Clark J. F. , Schlosser P. , Wanninkhof R. , Simpson H. J. , Schuster W. S. F. , co-authors . Gas transfer velocities for SF6 and 3He in a small pond at low wind speeds. Geophys. Res. Lett. 1995; 22: 93–96.
- Cole J. , Bade D. , Bastviken D. , Pace M. , Van de Bogert M . Multiple approaches to estimating air-water gas exchange in small lakes. Limnol. Oceanogr. Methods. 2010; 8: 285–293.
- Cole J. J. , Caraco N. F . Atmospheric exchange of carbon dioxide in a low-wind oligotrophic lake measured by the addition of SF6 . Limnol. Oceanogr. 1998; 43: 647–656.
- Crill P. M. , Bartlett K. B. , Wilson J. O. , Sebacher D. I. , Harriss R. C. , co-authors . Tropospheric methane from an Amazonian floodplain lake. J. Geophys. Res. Atmos. 1988; 93: 1564–1570.
- Crusius J. , Wanninkhof R . Gas transfer velocities measured at low wind speed over a lake. Limnol. Oceanogr. 2003; 48: 1010–1017.
- Dickson A. G. , Millero F. J . A comparison of the equilibrium constants for the dissociation of carbonic acid in seawater media. Deep Sea Res. A. 1987; 34: 1733–1743.
- Downing J. A. , Prairie Y. T. , Cole J. J. , Duarte C. M. , Tranvik L. J. , co-authors . The global abundance and size distribution of lakes, ponds, and impoundments. Limnol. Oceanogr. Methods. 2006; 51: 2388–2397.
- Eugster W. , Plüss P . A fault-tolerant eddy covariance system for measuring CH4 fluxes. Agric. For. Meteorol. 2010; 150: 841–851.
- Frost T. , Upstill-Goddard R. C . Meteorological controls of gas exchange at a small English lake. Limnol. Oceanogr. 2002; 47: 1165–1174.
- Grossart H.-P. , Frindte K. , Dziallas C. , Eckert W. , Tang K. W . Microbial methane production in oxygenated water column of an oligotrophic lake. Proc. Natl. Acad. Sci. USA. 2011; 108: 19657–19661.
- Guérin F. , Abril G. , Serça D. , Delon C. , Richard S. , co-authors . Gas transfer velocities of CO2 and CH4 in a tropical reservoir and its river downstream. J. Mar. Syst. 2007; 66: 161–172.
- Hendriks D. M. D. , Dolman A. J. , van der Molen M. K. , van Huissteden J . A compact and stable eddy covariance set-up for methane measurements using off-axis integrated cavity output spectroscopy. Atmos. Chem. Phys. 2008; 8: 431–443.
- Hendriks D. M. D. , van Huissteden J. , Dolman A. J . Multi-technique assessment of spatial and temporal variability of methane fluxes in a peat meadow. Agric. For. Meteorol. 2010; 150: 757–774.
- Herbst M. , Friborg T. , Ringgaard R. , Soegaard H . Interpreting the variations in atmospheric methane fluxes observed above a restored wetland. Agric. For. Meteorol. 2011; 151: 841–853.
- Hoover T. E. , Berkshire D. C . Effects of hydration on carbon dioxide exchange across an air-water interface. J. Geophys. Res. 1969; 74: 456–464.
- Jacinthe P. A. , Filippelli G. M. , Tedesco L. P. , Raftis R . Carbon storage and greenhouse gases emission from a fluvial reservoir in an agricultural landscape. CATENA. 2012; 94: 53–63.
- Jähne B. , Münnich K. O. , Bösinger R. , Dutzi A. , Huber W. , co-authors . On the parameters influencing air-water gas exchange. J. Geophys. Res. 1987; 92: 1937–1949.
- Johnson K . Carbon dioxide hydration and dehydration kinetics in seawater. Limnol. Oceanogr. 1982; 27: 849.
- Johnson K. M. , Hughes J. E. , Donaghay P. L. , Sieburth J. M . Bottle-calibration static head space method for the determination of methane dissolved in seawater. Anal. Chem. 1990; 62: 2408–2412.
- Kortelainen P. , Rantakari M. , Huttunen J. T. , Mattsson T. , Alm J . Sediment respiration and lake trophic state are important predictors of large CO2 evasion from small boreal lakes. Glob. Change Biol. 2006; 12: 1554–1567.
- Lambert M. , Fréchette J . Tremblay A. , Varfalvy L. , Roehm C. , Garneau M . Analytical techniques for measuring fluxes of CO2 and CH4 from hydroelectric reservoirs and natural water bodies. Greenhouse Gas Emissions—Fluxes and Processes: Hydroelectric Reservoirs and Natural Environments. 2005; Berlin: Springer. 37–60.
- Liss P. , Merlivat L . Buat-Ménard P . Air-sea gas exchange: introduction and synthesis. The role of air-sea exchange in geochemical cycling. 1986; Dordrecht, The Netherlands: Springer. 113–127.
- Macintyre S. , Eugster W. , Kling G. W . Donelan M. A. , Drennan W. M. , Saltzman E. S. , Wanninkhof R . The Critical Importance of Buoyancy Flux for Gas Flux Across the Air-Water Interface. Gas Transfer at Water Surfaces. 2002; Washington, DC, USA: American American Geophysical Union. 135–139.
- Portielje R. , Lijklema L . Carbon dioxide fluxes across the air-water interface and its impact on carbon availability in aquatic systems. Limnol. Oceanogr. 1995; 40: 690–699.
- Raymond P. , Cole J . Gas exchange in rivers and estuaries: choosing a gas transfer velocity. Estuaries. 2001; 24: 312–317.
- Repo M. E. , Huttunen J. T. , Naumov A. V. , Chichulin A. V. , Lapshina E. D. , co-authors . Release of CO2 and CH4 from small wetland lakes in western Siberia. Tellus B. 2007; 59: 788–796.
- Riera J. L. , Schindler J. E. , Kratz T. K . Seasonal dynamics of carbon dioxide and methane in two clear-water lakes and two bog lakes in northern, Wisconsin, USA. Can. J. Fish. Aquat. Sci. 1999; 56: 265–274.
- Romaire R. P. , Boyd C. E . Effects of solar radiation on the dynamics of dissolved oxygen in channel catfish ponds. Trans. Am. Fish. Soc. 1979; 108: 473–478.
- Sander R . Compilation of Henry's Law Constants for Inorganic and Organic Species of Potential Importance in Environmental Chemistry . 1999. (version 3), http://www.mpch-mainz.mpg.de/sander/res/henry.html .
- Schroth M. H. , Eugster W. , Gómez K. E. , Gonzalez-Gil G. , Niklaus P. A. , co-authors . Above- and below-ground methane fluxes and methanotrophic activity in a landfill-cover soil. Waste Manag. 2012; 32: 879–889.
- Stauffer R. E . Windpower time series above a temperate lake. Limnol. Oceanogr. 1980; 25: 513–528.
- Taylor G. T. , Way J. , Scranton M. I . Planktonic carbon cycling and transport in surface waters of the highly urbanized Hudson River estuary. Limnol. Oceanogr. 2003; 48: 1779–1795.
- Upstill-Goddard R. C. , Watson A. J. , Lissi P. S. , Liddicoat M. I . Gas transfer velocities in lakes measured with SF6 . Tellus B. 1990; 42: 364–377.
- Vachon D. , Prairie Y. T . The ecosystem size and shape dependence of gas transfer velocity versus wind speed relationships in lakes. Can. J. Fish. Aquat. Sci. 2013; 70: 1757–1764.
- Vachon D. , Prairie Y. T. , Cole J. J . The relationship between near-surface turbulence and gas transfer velocity in freshwater systems and its implications for floating chamber measurements of gas exchange. Limnol. Oceanogr. 2010; 55: 1723–1732.
- Wang X. F. , Wei F. S. , Qi W. Q . Monitoring and Analysis Methods of Water and Wastewater. 4th ed . 2002; China Environmental Science Press, Beijing (in Chinese).
- Wanninkhof R . Relationship between wind speed and gas exchange over the ocean. J. Geophys. Res. 1992; 97: 7373–7382.
- Wanninkhof R. , Asher W. E. , Ho D. T. , Sweeney C. , McGillis W. R . Advances in quantifying air-sea gas exchange and environmental forcing. Ann. Rev. Mar. Sci. 2009; 1: 213–244.
- Wanninkhof R. , Knox M . Chemical enhancement of CO2 exchange in natural waters. Limnol. Oceanogr. 1996; 41: 689.
- Wanninkhof R. , Ledwell J. , Broecker W . Gas exchange-wind speed relation measured with sulfur hexafluoride on a lake. Science. 1985; 227: 1224.
- Whitfield C. J. , Aherne J. , Baulch H. M . Controls on greenhouse gas concentrations in polymictic headwater lakes in Ireland. Sci. Total Environ. 2011; 410–411: 217–225.
- Xiao S. B. , Liu D. F , Wang Y. C. , Yang Z. J. , Chen W. Z . Temporal variation of methane flux from Xiangxi Bay of the Three Gorges Reservoir. Sci. Rep. 2013a; 3: 2500.
- Xiao S. , Wang Y. , Liu D. , Yang Z. , Lei D. , co-authors . Diel and seasonal variation of methane and carbon dioxide fluxes at Site Guojiaba, the Three Gorges Reservoir. J. Environ. Sci. 2013b; 25: 2065–2071.
- Yang L. , Lu F. , Wang X. , Duan X. , Song W. , co-authors . Spatial and seasonal variability of diffusive methane emissions from the Three Gorges Reservoir. J. Geophys. Res. Biogeosci. 2013; 118: 471–481.
- Zeebe R. E . On the molecular diffusion coefficients of dissolved CO2, HCO3 −, and CO3 2− and their dependence on isotopic mass. Geochim. Cosmochim. Acta. 2011; 75: 2483–2498.
- Zhai W. , Dai M. , Cai W.-J. , Wang Y. , Wang Z . High partial pressure of CO2 and its maintaining mechanism in a subtropical estuary: the Pearl River estuary, China. Mar. Chem. 2005; 93: 21–32.