
Abstract
This investigation focuses on the characterisation of the aerosol particle hygroscopicity. Aerosol particle optical properties were measured at Granada, Spain, during winter and spring seasons in 2013. Measured optical properties included particle light-absorption coefficient (σap) and particle light-scattering coefficient (σsp) at dry conditions and at relative humidity (RH) of 85±10%. The scattering enhancement factor, f(RH=85%), had a mean value of 1.5±0.2 and 1.6±0.3 for winter and spring campaigns, respectively. Cases of high scattering enhancement were more frequent during the spring campaign with 27% of the f(RH=85%) values above 1.8, while during the winter campaign only 8% of the data were above 1.8. A Saharan dust event (SDE), which occurred during the spring campaign, was characterised by a predominance of large particles with low hygroscopicity. For the day when the SDE was more intense, a mean daily value of f(RH=85%)=1.3±0.2 was calculated. f(RH=85%) diurnal cycle showed two minima during the morning and afternoon traffic rush hours due to the increase in non-hygroscopic particles such as black carbon and road dust. This was confirmed by small values of the single-scattering albedo and the scattering Ångstrom exponent. A significant correlation between f(RH=85%) and the fraction of particulate organic matter and sulphate was obtained. Finally, the impact of ambient RH in the aerosol radiative forcing was found to be very small due to the low ambient RH. For high RH values, the hygroscopic effect should be taken into account since the aerosol forcing efficiency changed from −13 W/m2 at dry conditions to −17 W/m2 at RH=85%.
1. Introduction
Aerosol particles, both natural and anthropogenic, are radiatively active components of the Earth's atmosphere. They play relevant roles in scattering and absorbing solar and infrared radiation and being at the same time able to act as cloud condensation and/or ice nuclei. Aerosol particles can take up water depending on their chemical composition and the ambient relative humidity (RH), become larger in size than their dry counterparts and, hence, can scatter more light. Wet particles also have different angular scattering properties and refractive indices than their dry equivalents. Deliquescent aerosol particles can exist in two phases at the same RH, known as hysteresis (Orr et al., Citation1958). For increasing RH, pure deliquescent aerosol particles experience a sudden phase transition from solid to liquid at a defined RH that is called deliquescence relative humidity (DRH). Once the RH is above the DRH and the particle is liquid, a decrease in RH does not make the particle to recrystallise at the DRH. The recrystallisation RH is known as efflorescence RH. As shown by Tang and Munkelwitz (Citation1993), mixed deliquescent aerosol particles can exhibit one or more phase changes. If the particles are not deliquescent but hygroscopic, they grow or shrink monotonically with increasing or decreasing RH. All these effects present a direct influence in the radiative forcing of aerosol particles being of great scientific importance its quantitative determination.
Numerous works have investigated the change in size of aerosol particles due to water uptake by means of Humidified Tandem Differential Mobility Analyzers (HTDMAs) (Massling et al., Citation2007; Meier et al., Citation2009; Wu et al., Citation2013, and references therein). Some of these works include theoretical calculations using Mie theory to quantify the effect that this growth in size may have in the scattering coefficient, which is of more climatic relevance. In this sense, it is possible to measure directly the enhancement in the scattering coefficient due to water uptake by means of a tandem of nephelometer set-up (e.g. Covert et al., Citation1972; Fierz-Schmidhauser et al., Citation2010a). Typically, one of the nephelometers measures at a reference RH (usually between 20 and 40%) while the second nephelometer measures the particle light-scattering coefficient at a high RH (up to 90%). The combination of both measurements allows the determination of the scattering enhancement factor [f(RH)], that is, the ratio between the scattering coefficient at a certain RH and the scattering coefficient at dry conditions. This factor quantifies the amount of change in the particle light-scattering coefficient due to water uptake. Typical measured values of f(RH) for different aerosol types are listed in . Quantitative knowledge of the scattering enhancement is very important when comparing remote sensing measurements such as lidar or sun photometers with in-situ measurements (e.g. Zieger et al., Citation2011, Citation2012; Estéve et al., Citation2012), as well as for climate models. Most measurement stations, such as those involved in the ACTRIS or GAW (WMO/GAW, Citation2003) networks, perform routine measurements of the aerosol optical and physical properties at dry conditions (RH<40%). In order to use these measurements at low RH in climate studies, the influence of RH must be taken into account. Although most chemical transport and radiative transfer models have incorporated empirically derived f(RH) values (Massoli et al., Citation2009), some difficulties still exist in modelling the changes of aerosol optical properties with water uptake for species such as dust and soot, and specially organic aerosols (Malm and Kreidenweis, Citation1997; Mircea et al., Citation2005). In addition, most satellite algorithms retrievals omit hygroscopic properties of ambient aerosols, and it has encouraged the incorporation of in-situ knowledge of RH in aerosol retrieval algorithms (Wang and Martin, Citation2007), especially when applied to urban aerosols.
Table 1. Hygroscopic growth factors from the literature measured for different aerosol types
In this work, we describe a recently build humidification system for a nephelometer that allows the determination of f(RH). After testing the capabilities of the system in the laboratory with well-defined monodisperse aerosols, the system was installed in the IISTA-CEAMA station located in Granada, Southern Spain, for continuous measurements of f(RH). Results of two sampling campaigns performed during winter and spring seasons are reported here. The data are analysed in the base of diurnal and seasonal changes in aerosol particle composition and meteorological conditions. In addition, the relationships between f(RH), chemical composition and intensive aerosol parameters, such as the aerosol single-scattering albedo or the scattering coefficient related Ångström exponent, are explored.
2. Experimental
2.1. Site description
All data presented here have been measured at an urban station located in Southeastern Iberian Peninsula (Granada, 37.18°N, 3.58°W, 680 m a.s.l). Two measurement campaigns were performed: the first one took place during winter season (from 22 January to 15 February 2013) and the second one during spring season (from 4 April to 10 May 2013).
Granada is a medium-sized city sited in a valley surrounded by high mountains. The sampling site is located in the southern part of the city and it is less than 500 m away from a highway that surrounds the city. Titos et al. (Citation2012) reported that, in Granada, the coarse fraction (PM10–1) was mainly composed by mineral matter (around 62%) and organic and elemental carbon (EC), OC+EC (12%) while the fine fraction (PM1) was composed mainly by OC+EC (32%) and secondary inorganic aerosol material that contributed around 20%. In a recent source apportionment study of fine and coarse particulate matter, Titos et al. (Citation2014b) pointed out that the major aerosol sources at Granada are road traffic and mineral dust as well as fuel-based domestic heating during winter time. The levels of the mineral matter increase considerably from winter to summer due to the dryness conditions, which favour re-suspension processes and the higher frequency of Saharan outbreaks (Navas-Guzmán et al., Citation2013), while OC+EC increase its contribution during winter compared with summer (Titos et al., Citation2014b). In addition, the aerosol particle mass concentration and its composition depend on the combination of both local and regional sources as well as meteorological conditions which may lead during specific situations to the accumulation of pollutants near the surface (Lyamani et al., Citation2012).
2.2. Instrumentation
Air sampling for all the instruments was obtained from the top of a stainless steel tube of 20 cm diameter and 5 m length (Lyamani et al., Citation2008, Citation2010), located at about 15 m above the ground. Measurements were performed neither with particle size cut-off and heating of sampled air. Inside this main stack, there are several stainless steel pipes that drive the sampling air to the different instruments. Different diameters of the pipes have been selected in order to optimise the efficiency of the system in terms of isokinetic sampling (Baron and Willeke, Citation2001).
At the station, we operate two integrating nephelometers, one of them equipped with a humidification system. The integrating nephelometer (model TSI 3563) is able to measure particle light-scattering (σsp) and back scattering (σbsp) coefficients at three wavelengths 450, 550 and 700 nm (Anderson et al., Citation1996). A routine maintenance and calibration of the nephelometers is carried out periodically using CO2 and filtered air. The experimental set-up consists of two TSI 3563 integrating nephelometers running in parallel. A schematic representation of the experimental set-up is shown in . One of the nephelometers measures the particle light-scattering coefficient at dry conditions (reference nephelometer) and the second one measures at high RH with a humidifier system attached to the inlet (humidified nephelometer). Both nephelometers draw the ambient air at a flow rate of 15 l/min. The humidifier consists of two concentric tubes: the inner one is a high density porous PTFE (polytetrafluoroethylene) tube of 15.5±0.5 mm inner diameter and 30 cm length. The pore size is large enough to allow the transfer of water molecules across the membrane, but too small for larger molecules to cross the barrier. The outer tube is made up of stainless steel and is wrapped in a cable heater and insulation. There is a closed loop of water that circulates between the PTFE and the outer tube. As the water temperature increases, the RH of the sample air increases. The temperature of the water is regulated via a feedback system between the RH sensor, the PID (proportional–integral–derivative) controller and the heater. If the measured RH after the humidifier is below the set point the PID controller sends a signal to send current to the heater. The PID regulates the amount of current and heating rate of the humidifier heater until the desired set point is attained.
Fig. 1 Experimental set-up.
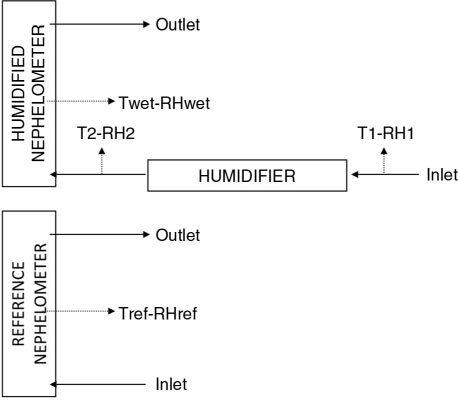
Temperature and RH sensors (Rotronic HygroClips HC2-S, accuracy of ±0.8% RH and ±0.1 K) are placed before and after the humidifier to measure air temperature and RH, before and after humidification, respectively (). Since very precise measurements of the RH are needed for this study, two additional sensors (Rotronic Probes HC2-C04, accuracy ±1.5%RH and ±0.3 K) have been placed inside the nephelometers’ chamber, side by side to the original TSI sensor (sample sensor according to the TSI 3563 manual). Since the temperature measured by the TSI sensor is needed for calibration, the original sensor was also kept in the nephelometer. In Section 2.4 the comparison between the Rotronic and TSI sensors is discussed.
The humidified and reference nephelometers measured at a frequency of 1 min and non-idealities due to truncation errors and non-Lambertian light source were corrected according to Anderson and Ogren (Citation1998). The uncertainty in σsp is about 7% (Heintzenberg et al., Citation2006). During most of the study period, the RH of the humidified nephelometer was set to a constant value of 85% RH and for some time periods of 2–3 h of duration the humidity was cycled from low to high RH.
Furthermore, the particle light-absorption coefficient, σap, was measured with a Multi-Angle Absorption Photometer (MAAP) (Thermo ESM Andersen Instruments, Erlangen, Germany). In this instrument, particles are deposited on a quartz fibre filter and a continuous 637 nm laser (Müller et al., Citation2011) illuminates the filter matrix perpendicularly. In the MAAP, the determination of the particle light-absorption coefficient of the deposited aerosol particles uses radiative transfer calculations and explicitly includes a treatment of backscattering effects from the filter matrix and the light-scattering aerosol component (Petzold and Schönlinner, Citation2004). The MAAP draws the ambient air at constant flow rate of 16.7 l/min and provides 1-min values. The total method uncertainty for the particle light-absorption coefficient inferred from MAAP measurement is around 12% (Petzold and Schönlinner, Citation2004).
A high-volume sampler (CAV-A/MSb) was used for sampling PM10 at a flow rate 30 m3 h−1 using quartz fibre filters. The filters were conditioned and treated pre- and post-sampling. Once the particle mass concentrations were determined by gravimetry, the filters experienced different laboratory treatments for determining the levels of major and trace components (Querol et al., Citation2009; Titos et al., Citation2012). A total of nine filters were collected during the study period (three and six filters during the winter and spring campaigns, respectively).
Meteorological variables including ambient RH were measured by an automatic weather station at the sampling site. The ambient RH was measured, at the same height of the sampling inlet, by a psychrometer model MTH-A1 (ITC, Almeria, Spain) with precision of 5%. The ambient RH data were recorded as 1 min averages.
In order to characterise the transport pathways of air masses arriving at our study area and to detect the aerosol source regions responsible for some aerosol episodes affecting our station, 5-d backward trajectories arriving at Granada at 500 m a.g.l. were calculated online using the HYSPLIT4 model (Draxler et al., Citation2013). The model version employed uses GDAS (Global Data Assimilation System) meteorological data and includes vertical wind.
2.3. Data treatment
An important variable when studying the effect of RH on particle light-scattering is the scattering enhancement factor f(RH) that is defined as the ratio of σsp(λ) at high and at a reference dry RH:1
The scattering enhancement factor can be well described with the following two free parameters equation (Clarke et al., Citation2002; Carrico et al., Citation2003):2 where a is the intercept at RH =0% and γ parameterises the magnitude of the scattering enhancement.
From the measured aerosol light-scattering and absorption coefficients, it is possible to derive other variables that offer additional information and, hence, improve the characterisation of aerosol particles. In this sense, the scattering Ångström exponent that characterises the wavelength dependence of σsp was calculated according to the following formula for the wavelength pair λ1=700 nm and λ2=450 nm.3
This variable increases with decreasing particle size and takes values around 2 when the scattering process is dominated by fine particles, while it is close to 0 when the scattering process is dominated by coarse particles (Seinfeld and Pandis, Citation1998; Delene and Ogren, Citation2002).
The single-scattering albedo (ω0) is a key variable for determining the aerosol radiative forcing. It is defined as the ratio between the scattering and the extinction (scattering plus absorption) coefficients at a given wavelength:4
As a result of dividing the backscattering coefficient (σbsp(λ)) by σsp(λ), we obtain the backscatter fraction (b), which is the fraction of radiation that is scattered at angles between 90° and 180°. This parameter increases with decreasing particle size.5
The aerosol forcing (ΔF) from an optically thin, partially absorbing aerosol layer can be calculated using the following equation (Haywood and Shine, Citation1995):6
where D is the fractional day length, S0 is the solar constant, Tat is the atmospheric transmission, Ac is the fractional cloud amount, δ is the aerosol optical depth, β is the upscatter fraction and Rs is the surface reflectance. The aerosol forcing efficiency can be defined as the aerosol forcing per unit optical depth (Sheridan and Ogren, Citation1999) and can be calculated from eq. (6) just by dividing by δ:
7
The upscatter fraction is the fraction of light that is scattered into the upward hemisphere relative to the horizon, and hence, depends on the zenith angle and the particle size. In this work, β is parameterised as a function of the measured backscatter fraction (b) using the equation proposed by Wiscombe and Grams (Citation1976):8
In addition, for the computation of the aerosol forcing efficiency, constant values of D=0.5, S 0=1370 W m−2, T at=0.76, A c=0.6, and R s=0.15 (Haywood and Shine, Citation1995) have been assumed.
2.4. Performance of the humidifier system
Laboratory measurements of well-defined monodisperse ammonium sulphate and sodium chloride particles were performed in order to test the capabilities of the humidifier system. These measurements were performed at the facilities of the Leibniz Institute for Tropospheric Research (TROPOS) in Leipzig, Germany, and showed a good agreement between the experimental results and literature values. In this sense, the DRH was found to be 78% for (NH4)2SO4 in comparison with literature values of 80% (Tang, Citation1996) and 79.5% (Kus et al., Citation2004). In the case of NaCl, the experimental DRH point was 75% which is in agreement with the values of 75 and 75.2% reported by Tang (Citation1996) and Kus et al. (Citation2004), respectively.
As mentioned in the instrumentation section, two Rotronic sensors (factory-calibrated) were placed side by side to the original TSI sample sensors inside both nephelometers. The Rotronic sensors were inter-compared prior to installation in the nephelometers and in the humidifier system showing a good agreement. The comparison between RH TSI and Rotronic sensors showed a good agreement for low RH values while relative differences up to 12% were observed for RH>75%. Concerning the temperature measurements, the TSI sensor showed differences lower than 1% compared with the Rotronic sensor in the reference nephelometer whereas differences up to 6% were observed in the humidified nephelometer, probably due to more abrupt changes in temperature caused by heating in the humidifier. However, this difference in the temperature has a very small effect in the calculated particle light-scattering coefficient. In fact, assuming a temperature difference of 6% at 300 K, this would cause an error smaller than 0.1 Mm−1 in the Rayleigh scattering at 550 nm, which can be considered as negligible.
In the winter campaign, the RH inside the reference nephelometer was on average 17±5% and during the spring campaign it was 30±7%. These low RH values were attained with no need for drying. For those periods when both nephelometers measured at dry conditions (RH<50%), they showed a good agreement with each other in the measured scattering coefficients. In particular, the particle light-scattering coefficient at 550 nm and dry conditions (<50% RH) in the humidified nephelometer was around 8% (R 2=0.99) and 3% (R 2=0.97) smaller than the measured in the reference nephelometer during the winter and spring campaigns, respectively. Similar results were obtained for the other wavelengths. This difference could be related with sampling losses in the humidifier system and it was empirically corrected by applying the slopes of the regression between the reference and the humidified nephelometers when measuring at RH<50% as correction factors. It is necessary to highlight that the temperature of the sampled air was kept below 34°C in order to minimise losses of volatile compounds (Bergin et al., Citation1997; ten Brink et al., Citation2000).
3. Results and discussion
3.1. Overview: winter and spring campaigns
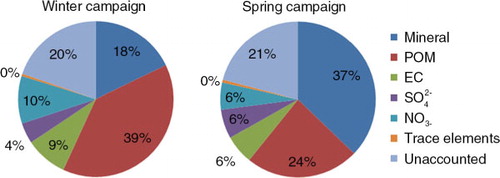
The winter campaign started on 22 January and lasted till 15 February 2013. It was characterised by low ambient temperatures with average campaign values of 9±5°C and ambient RH of 61±21%. Both variables presented clear diurnal patterns with high temperature and low RH values at midday. During the spring campaign (4 April – 10 May 2013), the mean ambient temperature was 16±6°C and the RH was 50±20%. From 13 to 19 April, the temperature increased considerably, reaching hourly values up to 30°C at midday. After this period, the temperature experienced a strong decrease being the period from 28 to 30 April characterised by very low temperatures (maximum temperature at midday below 10°C). With regard to the chemical composition of aerosol particles in the PM10 size fraction, shows the chemical speciation for the winter and spring campaigns. During the winter campaign, EC contributed 9% to the total mass and particulate organic matter (POM, calculated as 1.6*Organic Carbon) contributed around 40%. Mineral matter (calculated as the sum of Al2O3, SiO2, CO3, Ca, Fe, Mg, K) represented 18% of the PM10 mass concentration. This last constituent doubled its contribution to PM10 mass concentration during the spring campaign whereas the contribution of POM and EC decreased to 24 and 6%, respectively. The contribution of was slightly higher during the spring campaign while in the case of NO3− its contribution was higher during the winter campaign. In spite of the limited number of samples, the chemical speciation during the campaigns was in accordance with the results reported by Titos et al. (Citation2014b) for the period 2006–2010 in Granada.
Fig. 2 Chemical speciation of PM10 fraction during winter and spring campaigns expressed in percentages (%).The unaccounted mass fraction refers to the percentage of mass that was not determined by chemical analysis compared to the gravimetric PM10 mass. Mineral fraction was calculated as the sum of Al2O3, SiO2, CO3, Ca, Fe, Mg, K; trace elements as the sum of Li, P, Sc, Ti, V, Cr, Mn, Co, Ni, Cu, Zn, Ga, Ge, As, Se, Rb, Sr, Cd, Sn, Sb, Cs, Ba, La, Ce, Lu, Hf, Ta, W, Tl, Pb, Bi, Th and U; and POM as OC*1.6.
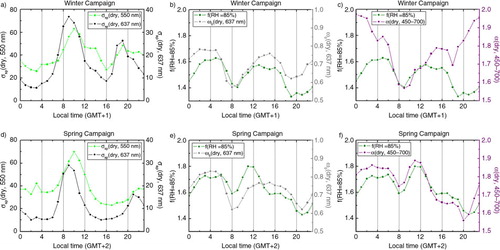
a and a show an overview of the measured dry particle light-scattering and absorption coefficients, σsp(dry, 550 nm) and σap(dry, 637 nm), during the winter and spring campaigns at Granada, respectively. The data shown represent hourly averaged data. Unfortunately, there are no data of the particle light-absorption coefficient for around half of the winter campaign (since 8 February), because the instrument was shipped for the ACTRIS intercomparison workshop. summarises the mean (±SD) and median values of measured and derived variables for the two measurement periods. During the winter campaign, the hourly σsp(dry, 550 nm) ranged from 3 to 187 Mm−1 and from 2 to 338 Mm−1 during the spring campaign. The hourly σap(dry, 637 nm) varied within the winter measurement period from 0.6 to 84 Mm−1 with an average value of 17±17 Mm−1. During the spring campaign, the values of the σap(dry, 637 nm) were slightly lower (average 11±11 Mm−1), showing a strong day to day variability during both measurement periods. Intensive aerosol particle variables such as the single-scattering albedo and scattering Ångström exponent were used to better understand the variability of the enhancement factor of the particle light-scattering. On average, the differences between both campaigns when looking at ω0(dry, 637 nm) and α(dry, 450–700) were very small (b and b). According to the values reported in , absorbing aerosol particles presented a significant contribution to the aerosol population over Granada in both campaigns. The scattering processes were dominated by fine particles in agreement with previous studies performed in our station (Lyamani et al., Citation2008; Lyamani et al., Citation2010; Titos et al., Citation2012).
Fig. 3 Time series of hourly average values of the scattering and absorption coefficients, single-scattering albedo, scattering Ångström exponent and f(RH=85%) during the winter campaign.
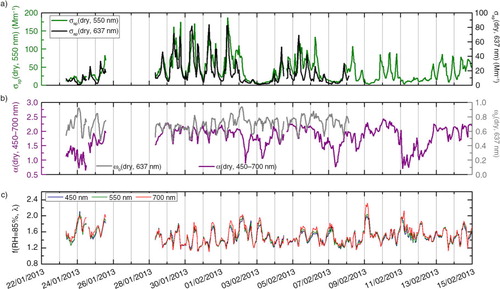
Table 2. Statistical summary of the aerosol dry scattering and absorption coefficient, single-scattering albedo, scattering Ångström exponent and scattering enhancement factor at 85% RH during the winter and spring campaigns
c and c show the temporal evolution of f(RH=85%, λ) for the winter and spring campaigns, respectively. It is interesting to note that the actual RH measured inside the humidified nephelometer can differ in ±10% from the set point value of RH=85% due to the thermal gradient between the outlet of the humidifier and the nephelometer chamber. Fierz-Schmidhauser et al. (Citation2010b) encountered a similar issue in their humidified nephelometer. In our system, although the RH downstream of the humidifier was almost constant in time, the RH inside the humidified nephelometer was not. In order to avoid a masked effect in the f(RH) due to RH fluctuations inside the humidified nephelometer, the f(RH) measured at RH values between 75 and 95% has been recalculated to the target value of RH=85% using eq. (9) that is based on eq. (2) and assuming that it generally holds. 9
Mean campaign values of the fitting parameter γ were used for the calculation of f(RH=85%) in eq. (9). For the winter and spring campaigns, the mean γ values were 0.27 and 0.40, respectively (see Section 3.3). The use of a mean γ in eq. (9) contributes to the uncertainty in the reported f(RH=85%) values. However, since only f(RH) values measured between 75 and 95% RH were recalculated to 85% RH, small differences are expected. For example, if the measured f(RH=75%)=1.5 and γ=0.40, a change of ±20% in the γ value when recalculating f(RH) to 85% RH would cause an average difference of 4% in f(RH=85%), which is not very substantial. Hereafter, f(RH) will refer to the 550 nm wavelength. The average f(RH=85%) values for both campaigns were very similar (1.5±0.2 for winter and 1.6±0.3 for spring campaigns). During the winter campaign, daily averaged values of f(RH=85%) ranged from 1.35 to 1.70 while during the spring campaign f(RH=85%) varied from 1.30 to 2. The average values reported in this study are in the range of values reported in the literature for urban and continental aerosols (see ). Considerably higher values of f(RH) have been measured in the Arctic (Zieger et al., Citation2010), in the coastal Northeastern United States (Titos et al., Citation2014a) and in the free troposphere (Fierz-Schmidhauser et al., Citation2010b).
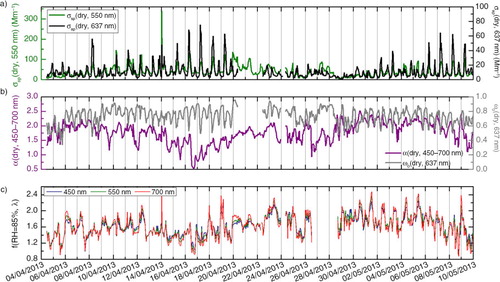
A Saharan dust event (SDE) of moderate intensity occurred during the spring campaign (14–19 April according to the backward trajectories ending in Granada at 500 m a.g.l.). This period was characterised by a strong decrease in the dry scattering Ångström exponent (see b), which reached its minimum during 16 April, with a daily mean value close to 0.5, denoting an increase in the contribution of coarse mode aerosols. In coincidence with this decrease, the dry single-scattering albedo at 637 nm increased to values up to 0.9. The f(RH=85%) also decreased during this period to values close to 1 denoting that dust particles have low hygroscopic enhancement. The f(RH=85%) daily mean value on 16 April was 1.3±0.2, which is in accordance with the values reported by Pan et al. (Citation2009) of 1.2 at 80% RH during a dust episode near Beijing and by Fierz-Schmidhauser et al. (Citation2010b) for dust aerosols in the free troposphere [f(RH=85%)=1.2].
Fig. 4 Time series of hourly average values of the scattering and absorption coefficients, single-scattering albedo, scattering Ångström exponent and f(RH=85%) during the spring campaign.
3.2. Diurnal cycles
All the variables analysed here presented clear diurnal patterns () mainly governed by changes in local sources, especially road traffic emissions, and the meteorological conditions. Lyamani et al. (Citation2010) performed a detailed analysis of the seasonal diurnal evolutions of σsp(dry, 550 nm), σap(dry, 637 nm), α(dry, 450–700) and ω 0(dry, 637 nm) in Granada during the period 2005–2007. The diurnal patterns observed in this study are in agreement with the previously reported by Lyamani et al. (Citation2010). Here, these diurnal cycles are used to support the interpretation of the diurnal cycle of the scattering enhancement factor. During both campaigns, f(RH=85%) showed two minima during the morning and afternoon traffic rush hours and the diurnal cycle displayed by this variable was very similar to the one presented by the single-scattering albedo (b). The two f(RH=85%) minima were probably connected to the relative increase of the non-hygroscopic particle fraction such as black carbon and road dust due to traffic emissions as indicated by a decrease in α(dry, 450-700) and ω0(dry, 637 nm) during the traffic rush hours (b and c). In addition, during the spring campaign, f(RH=85%) exhibited a maximum at 11:00 local time in coincidence with the maximum observed in α(dry, 450–700). Thus, the diurnal behaviour of f(RH=85%) seems to be driven by both the chemical composition and the size of the dry particles (related here with the single-scattering albedo and the scattering Ångström exponent due to the lack of online chemical measurements). In Section 3.4, the relationship between f(RH=85%) and α(dry, 450–700) and ω0(dry, 637 nm) is analysed in more detail.
Fig. 5 Diurnal evolution of the scattering and absorption coefficients at 550 nm, scattering enhancement factor at 85% RH and 550 nm, single-scattering albedo at 637 nm and scattering Ångström exponent during the winter (upper panel) and spring (lower panel) campaigns.
3.3. Humidograms
During some time periods in both campaigns, the RH was scanned from low to high values (up to 90–95%). The RH measurement cycle started with a zero measurement and the RH was increased stepwise to 80–85% in the humidified nephelometer within 30 min, and then decreased back to RH values around 40% or below during the second half of the hour. To perform these RH-cycles, temporal windows in which the aerosol particle properties are thought to not change drastically (as usually occurred between the morning and evening traffic rush hours) were selected in order to avoid a strong effect of local traffic and easily characterise f(RH) changes connected with changes in the air masses affecting our site. shows the humidograms measured during the winter (1) and spring (2) campaigns. The data shown represent average values in 2% RH size bins and the date and local time of each humidogram are shown in the legend. No deliquescence behaviour was observed during the study period, and in all the cases the f(RH) increased monotonically with RH. Five days air mass back-trajectories arriving at Granada at 500 m a.g.l. were computed online (http://ready.arl.noaa.gov/) using HYSPLIT4 model to support the interpretation of the humidograms. shows the mean and standard deviation of the particle light-scattering and absorption coefficients, single-scattering albedo, scattering Ångström exponent, f(RH=85%), and the air mass classification at 500 m a.g.l. for each scan period. As can be observed, α(dry, 450–700) and ω0(dry, 637 nm) values showed low variability within each scan (as indicated by the standard deviation) which suggests no significant changes in the aerosol composition and type during the scan.
Fig. 6 Aerosol light-scattering enhancement factor at 550 nm versus relative humidity during different time periods in the winter (a) and spring (b) campaigns. Each point represents the average f(RH) value in 2% RH size bins.
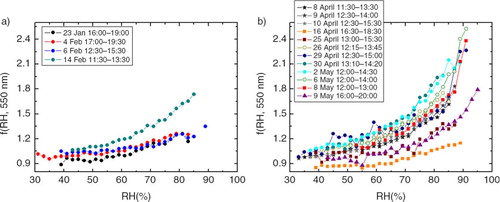
Table 3. Mean and standard deviation of the dry scattering and absorption coefficients, single-scattering albedo, scattering Ångström exponent and scattering enhancement factor at 85% RH during the humidograms
During the winter campaign, all the humidograms were very similar in shape and magnitude with the exception of 14 February that presented a higher scattering enhancement. On 23 January, 4 and 6 February, the humidograms showed very little enhancement with values of f(RH=85%) below 1.25. However, on 14 February, f(RH) reached values up to 1.74 at 85% RH. During this particular scan, α(dry, 450–700) was larger (see ), which suggest a predominance of fine and more hygroscopic aerosol particles. These differences between scans can be connected with different air masses arriving at the sampling location (and thus different aerosol type). During all the winter scans, the air masses arriving at 500 m a.g.l. at Granada were coming from the Atlantic Ocean and crossed Spain in their way to Granada. However, during 14 February the air masses were advected at very low levels, close to the ground, likely picking up pollutants, leading to an increase in the particle light-scattering coefficient and α(dry, 450–700). During the spring campaign most humidograms presented a similar shape and magnitude with the exception of those obtained on 16 and 25 April and 9 May (b). The lowest scattering enhancement of the spring campaign was observed on 16 April. On this day, Granada was affected by air masses from the Sahara Desert. For this case, the average (±SD) ω 0(dry, 637 nm) was 0.86±0.02 and the scattering Ångström exponent was 0.6±0.1, indicating a predominance of coarse particles. The enhancement of the particle light-scattering coefficient with RH was very small, with an average f(RH=85%) of 1.12. Furthermore, sampling losses in the humidifier system during this day were higher since there were f(RH) values below 1 at low RH. The shape and magnitude of the scattering enhancement observed under SDE conditions in this study was very similar to that reported by Fierz-Schmidhauser et al. (Citation2010b) for dust aerosols [f(RH=85%)=1.2]. On 25 April, the air masses affecting Granada at 500 m a.g.l. were coming from the Mediterranean basin. The single-scattering albedo observed was very low with an average value of 0.66±0.05 at 637 nm. The high relative contribution of absorbing particles may explain the low hygroscopic enhancement observed of f(RH=85%)=1.32. On 9 May, the air mass arriving at Granada at 500 m a.g.l. came from the Atlantic Ocean and was advected at very low levels and low speed, suggesting stagnant conditions, which led to an α(dry, 450–700) value of 1.3±0.2, ω0(dry, 637 nm)=0.7±0.1 and f(RH=85%) value of 1.37. Higher scattering enhancements were observed on the rest of scans where fine particles predominated [α(dry, 450–700) values around 2]. The air masses at 500 m a.g.l. arrived from the North Atlantic Ocean (8, 9, 10, 29 and 30 April and 2 May) and the Mediterranean Sea (26 April and 6–8 May). In all these cases, the air masses were travelling at very low levels in their way to Granada, likely picking up pollutants. These results connect with those obtained for the winter campaign where air masses travelling at low levels experienced a higher scattering enhancement as occurred on 14 February.
3.4. Relationship between f(RH) and other measured variables
shows the frequency distribution of 1 min f(RH=85%) values for the winter and spring campaigns. The f(RH=85%) frequency distributions presented different shape in each campaign. In the winter campaign, the most frequent values were comprised between 1.3 and 1.5 representing 40% of the data. On the contrary, during the spring campaign, the most frequent values were in the range 1.4–1.8 comprising around 52% of the data. In addition, cases of high scattering enhancement were more frequent during the spring campaign since 27% of the data had a f(RH=85%)>1.8 while only 8% of the data were above 1.8 during the winter campaign.
Fig. 7 Frequency distribution of f(RH=85%) at 550 nm during the winter and spring campaigns. Data for periods where α(dry, 450–700) was above and below 1 and ω0(dry, 637 nm) was above and below 0.6 were extracted and plotted separately.
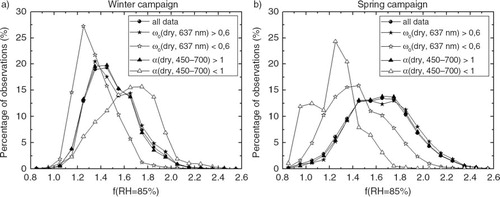
Observations of f(RH) when α(dry, 450–700) was above and below 1 (indicating a significant influence of small or large particles, respectively) and ω0(dry, 637 nm) was above and below 0.6 (less or more absorbing aerosol particles, respectively), were extracted from the data set and plotted as frequency distributions in . For both campaigns, the f(RH=85%) frequency distributions for ω0(dry, 637 nm)<0.6 were shifted towards lower f(RH=85%) values in comparison with those corresponding to ω0(dry, 637 nm)>0.6. This means that aerosols containing a larger fraction of absorbing particles were less hygroscopic. During the spring campaign, the f(RH=85%) frequency distribution for α(dry, 450–700)<1 was shifted towards lower f(RH=85%) values. This suggests that the aerosol containing a higher proportion of large particles was less hygroscopic than the one containing a higher proportion of small particles [α(dry, 450–700)>1] (b). This behaviour is connected with the large contribution of dust particles with low hygroscopicity (Sheridan et al., Citation2001; Fierz-Schmidhauser et al., Citation2010b) to the coarse mode during the spring campaign. As shown in , mineral dust, which commonly occurs in the coarse fraction (Song et al., Citation2012), contributed around 37% to the total PM10 mass concentration. During the winter campaign, the behaviour observed was the opposite; the frequency distribution of f(RH=85%) for α(dry, 450–700)<1 was shifted towards higher f(RH=85%) values (a). This different behaviour between seasons can be connected with differences in the chemical composition. During winter time, when fine particles predominated [α(dry, 450–700)>1] the fine mode was mainly composed by non-hygroscopic material such as EC and OC that is thought to suppress or reduce hygroscopic growth (Carrico et al., Citation2005), resulting in a lower hygroscopic enhancement for cases of α(dry, 450–700)>1 than for cases of α(dry, 450–700)<1.
In order to better understand the relationship between f(RH=85%) and other aerosol particle variables, a cross-correlation of the main in-situ aerosol particle variables and f(RH=85%) was performed. The scattering enhancement factor showed no correlation with the extensive parameters σsp(dry, 550 nm), σbsp(dry, 550 nm) and σap(dry, 637 nm). It was moderately correlated with ω0(dry, 637 nm) showing a R
2=0.3 and 0.2 during the winter and spring campaigns, respectively. The backscatter fraction was negatively correlated with f(RH=85%) during the winter campaign (R
2=0.2), but no correlation was found during the spring campaign. During the winter campaign, f(RH=85%) showed no correlation with α(dry, 450–700) although during the spring campaign it showed a moderate correlation with R
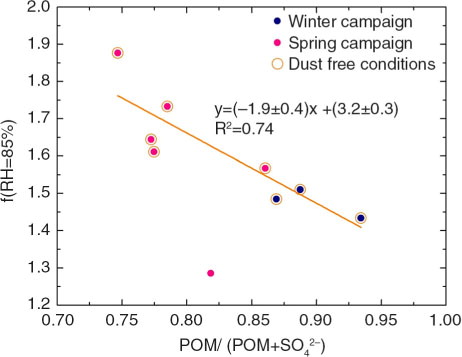
2=0.4. The different correlations obtained for winter and spring campaigns again suggest differences in the chemical composition of the coarse and fine modes between campaigns and make very difficult to find a single equation that might be used to estimate the scattering enhancement using other optical variables at our site. With regard to the chemical composition of aerosol particles, some authors have observed a relationship between the scattering enhancement and the chemical composition with special focus in the organic and inorganic content. In particular, Quinn et al. (Citation2005) proposed a parameterisation to predict f(RH) based on the fraction of POM and Garland et al. (Citation2007) showed that the f(RH=80%) varied linearly with the organic/inorganic content. In order to explore the relationship between f(RH) and the relative amount of POM and mass concentrations, shows f(RH=85%) versus the ratio POM/(POM+
) in the PM10 fraction. For this analysis, f(RH=85%) values have been averaged over the sampling interval of the filters (24 h starting at 7 GMT). A substantial decreasing trend of f(RH) for increasing POM mass fraction was found with R
2=0.78 (excluding the sample collected during the SDE). In spite of the limited number of samples, it seems that there is a significant relationship between the relative content of POM and the magnitude of f(RH). In this sense, based on three measurement campaigns performed in India, Asia and the Northeastern United States, Quinn et al. (Citation2005) found out that aged aerosol particles presented a higher hygroscopicity and lower POM contribution than fresh aerosols connected with the degree of oxidation. A recent publication by Zieger et al. (Citation2014) showed that the magnitude of f(RH) was clearly correlated with the inorganic mass fraction and pointed out that the chemical composition is the main factor determining the magnitude of the scattering enhancement. In this sense, an effort should be done in order to better constrain the factors affecting f(RH) at different environments as suggested by Titos et al. (Citation2014a).
Fig. 8 Scattering enhancement factor at 85% relative humidity versus the ratio POM/(POM+) for the winter and spring campaigns. The linear fit refers to dust-free conditions.
3.5. Implication for climatic relevant variables
Since the particle light-scattering coefficient changes with RH, other derived variables such as the single-scattering albedo or the backscatter fraction are also expected to change, being also the aerosol radiative forcing dependent on RH. Thus, to quantify the direct effect of aerosol particles in the energy budget, it is necessary to transform the dry measurements to ambient conditions. The ambient RH (a), the single-scattering albedo (b), the backscatter fraction (c) and the aerosol forcing efficiency (d) at ambient conditions, at RH=85% and at the reference RH for the spring campaign, as shown in , depicts the differences between ambient and dry aerosol properties. This analysis was performed only for the spring campaign data due to low data coverage during the winter campaign (no availability of MAAP data from 8 February to the end of the campaign and no ambient RH data from 31 January to the 7 February). The ω0(550 nm) at ambient RH has been calculated assuming that the absorption coefficient does not change with RH (Nessler et al., Citation2005) and the change in the scattering coefficient from dry to ambient RH has been calculated using eq. (9) and the corresponding γ parameter. The ω0 at 550 nm has been calculated assuming a λ −1 dependence of the measured σap(637 nm). In this section, all the variables refer to 550 nm wavelength.
Fig. 9 Time series of daily a) Ambient relative humidity, b) single-scattering albedo at 550 nm, c) backscatter fraction at 550 nm and d) aerosol forcing efficiency at 550 nm measured with the reference nephelometer and calculated to ambient RH conditions and to RH=85% during the spring campaign.
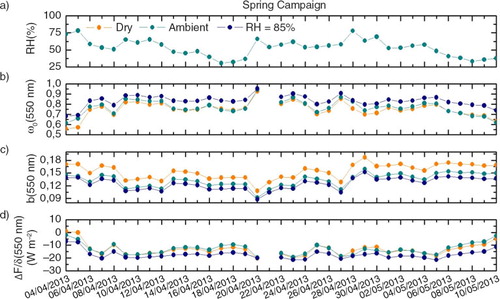
The ambient RH in Granada was very low during the spring campaign, with a daily average campaign value of 53%. Due to this low ambient RH, differences between dry and ambient optical properties were also very low. The single-scattering albedo changed from a mean campaign value of 0.75 at dry conditions to 0.77 at ambient conditions. The mean campaign backscatter fraction at dry and at ambient conditions was 0.15 and 0.13, respectively. These small differences led to negligible differences in the calculated aerosol forcing efficiency, which was on average −13 W m−2, both at dry and ambient conditions. During time periods characterised by a higher ambient RH, it can be observed that the aerosol forcing efficiency was higher at ambient RH compared to dry conditions. An important fact is that the forcing efficiency can change from positive to negative due to the effect of RH, as occurred on 4 and 5 April. At 85% RH, the effect of water uptake by aerosols is of substantial importance, with an average aerosol forcing efficiency at 85% RH of −17 W m−2. During the study period, the impact of ambient RH in the aerosol particle optical properties was very small. However, for periods of elevated RH, it is necessary to quantify the effect that ambient RH may has in the measured dry aerosol optical properties in order to obtain an appropriate estimation of the radiative forcing by aerosols.
4. Conclusions
Two measurement campaigns were conducted in Granada during the winter and spring seasons to study the aerosol particle scattering enhancement due to water uptake. A custom-built humidifier system was successfully tested in the laboratory and installed in the IISTA-CEAMA station for ambient measurements. For the winter and spring campaigns, mean f(RH=85%) were 1.5±0.2 and 1.6±0.3, respectively. SDE was characterised by a predominance of large particles [low α(dry, 450–700) values] with low hygroscopicity. All the variables analysed presented a diurnal pattern. The two f(RH=85%) minima were connected to the relative increase of the non-hygroscopic fraction (such as black carbon and road dust) due to traffic emissions as indicated by a decrease in α(dry, 450–700) and ω0(dry, 637 nm) during the traffic rush hours. For both campaigns, aerosols containing a larger fraction of absorbing particles were less hygroscopic. However, concerning particles’ mean size, the behaviour in the winter and the spring campaigns was the opposite: coarse particles were more hygroscopic in the winter than in the spring campaign, which suggests that the chemical composition of the coarse mode during both campaigns was different. In spring, the coarse mode would be probably composed by dust particles that show a low hygroscopicity while during the winter campaign the contribution of mineral matter was much lower, showing a higher hygroscopicity. In spite of the apparent relationship observed between f(RH=85%) and α(dry, 450–700) and ω0(dry, 637 nm), these variables showed no substantial correlation with f(RH=85%). In terms of the chemical composition, a decreasing trend of f(RH=85%) for increasing the mass fraction of POM was found with a R 2=0.78. However, due to the limited number of samples, this last result needs to be confirmed with a longer data series. In order to quantify the impact of the RH in the ambient optical properties, measurements taken at low RH<50% were transformed to ambient RH using the two-fit parameter equation and the mean γ parameter for each campaign (winter campaign: γ=0.27 and spring campaign: γ=0.40). Due to the ambient conditions in the experimental site, characterised by low RH values, the effect of the RH in the single-scattering albedo, the backscatter fraction and, hence, the radiative forcing efficiency was almost negligible. At RH=85%, the radiative forcing efficiency changed from −13 W m−2 at dry conditions to −17 W m−2. Thus, for situations of elevated RH, this effect should be taken into account in order to report an accurate estimation of the radiative effect of aerosols.
5. Acknowledgements
This work was supported by the Andalusia Regional Government through projects P10-RNM-6299 and P12-RNM-2409; by the Spanish Ministry of Economy and Competitiveness through projects CGL2010-18782, CSD2007-00067, CGL2011-13580-E/CLI and CGL2011-16124-E; and by EU through ACTRIS project (EU INFRA-2010-1.1.16-262254). The authors express their gratitude to the NOAA Air Resources Laboratory (ARL) for the provision of the HYSPLIT transport and dispersion model, to Andrea and Hartmut Haudek from TROPOS (Leipzig, Germany) for their technical help and to IDAEA-CSIC (Barcelona, Spain), especially to Dr. Andrés Alastuey, for the chemical analyses. G. Titos was funded by the program FPI of the Spanish Ministry of Economy and Competitiveness – Secretariat of Science, Innovation and Development under grant BES-2011-043721.
Related Research Data
References
- Anderson T. L. , Covert D. S. , Marshall S. F. , Laucks M. L. , Charlson R. J. , co-authors . Performance characteristics of a high-sensitivity, three-wavelength, total scatter/backscatter nephelometer. J. Atmos. Ocean. Technol. 1996; 13: 967–986.
- Anderson T. L. , Ogren J. A . Determining aerosol radiative properties using the TSI 3563 integrating nephelometer. Aerosol Sci. Technol. 1998; 29: 57–69.
- Baron P. A. , Willeke K . Aerosol Measurement: Principles, Techniques and Applications. 2001; , New York: Wiley.
- Bergin M. H. , Ogren J. A. , Schwartz S. E. , McInnes L. M . Evaporation of ammonium nitrate aerosol in a heated nephelometer: implications for field measurements. Environ. Sci. Technol. 1997; 31: 2878–2883.
- Carrico C. M. , Kreidenweis S. M. , Malm W. C. , Day D. E. , Lee T. , co-authors . 2005. Hygroscopic growth behavior of a carbon-dominated aerosol in Yosemite National Park. Atmos. Environ. 39: 1394–1404.
- Carrico C. M. , Kus P. , Rood M. J. , Quinn P. K. , Bates T. S . Mixtures of pollution, dust, sea salt, and volcanic aerosol during ACE-Asia: radiative properties as a function of relative humidity. J. Geophys. Res. 2003; 108(D23): 8650.
- Clarke A. D. , Howell S. , Quinn P. K. , Bates T. S. , Ogren J. A. , co-authors . INDOEX aerosol: a comparison and summary of chemical, microphysical, and optical properties observed from land, ship, and aircraft. J. Geophys. Res. 2002; 107: 8033.
- Covert D. S. , Charlson R. J. , Ahlquist N. C . A study of the relationship of chemical composition and humidity to light scattering by aerosols. J. Appl. Meteorol. 1972; 11: 968–976.
- Delene D. J. , Ogren J. A . Variability of aerosol optical properties at four North American surface monitoring sites. J. Atmos. Sci. 2002; 59: 1135–1149.
- Draxler R. R. , Stunder B. , Rolph G. , Stein A. , Taylor A . HYSPLIT4 User's Guide. 2013. NOAA Air Resources Laboratory. Online at: http://www.arl.noaa.gov/documents/reports/hysplit_user_guide.pdf, last access: February 2014..
- Estéve A. R. , Ogren J. A. , Sheridan P. J. , Andrews E. , Holben B. N. , co-authors . Sources of discrepancy between aerosol optical depth obtained from AERONET and in-situ aircraft profiles. Atmos. Chem. Phys. 2012; 12: 2987–3003.
- Fierz-Schmidhauser R. , Zieger P. , Gysel M. , Kammermann L. , DeCarlo P. F. , co-authors . Measured and predicted aerosol light scattering enhancement factors at the high alpine site Jungfraujoch. Atmos. Chem. Phys. 2010b; 10: 2319–2333.
- Fierz-Schmidhauser R. , Zieger P. , Vaishya A. , Monahan C. , Bialek J. , co-authors . Light scattering enhancement factors in the marine boundary layer (Mace Head, Ireland). J. Geophys. Res. 2010c; 115: 20204.
- Fierz-Schmidhauser R. , Zieger P. , Wehrle G. , Jefferson A. , Ogren J. A. , co-authors . Measurement of relative humidity dependent light scattering of aerosols. Atmos. Meas. Tech. 3: 39–50.
- Garland R. M. , Ravishankara A. R. , Lovejoy E. R. , Tolbert M. A. , Baynard T . Parameterization for the relative humidity dependence of light extinction: organic- ammonium sulfate aerosol. J. Geophys. Res. 2007; 112: 19303.
- Haywood J. M. , Shine K. P . The effect of anthropogenic sulphate and soot aerosol on the clear sky planetary radiation budget. Geophys. Res. Lett. 1995; 22(5): 603–606.
- Heintzenberg J. , Wiedensohler A. , Tuch T. M. , Covert D. S. , Sheridan P. J. , co-authors . Intercomparisons and aerosol calibrations of 12 commercial integrating nephelometers of three manufacturers. J. Atmos. Ocean. Technol. 2006; 23: 902–914.
- Koloutsou-Vakakis S. , Carrico C. M. , Kus P. , Rood M. J. , Li Z. , co-authors . Aerosol properties at a midlatitude Northern Hemisphere continental site. J. Geophys. Res. 2001; 106(D3): 3019–3032.
- Kus P. , Carrico C. M. , Rood M. J. , Williams A . Measured and modeled light scattering values for dry and hydrated laboratory aerosols. J. Atmos. Ocean. Technol. 2004; 21: 981–994.
- Lyamani H. , Fernández-Gálvez J. , Pérez-Ramírez D. , Valenzuela A. , Antón M. , co-authors . Aerosol properties over two urban sites in South Spain during an extended stagnation episode in winter season. Atmos. Environ. 2012; 62: 424–432.
- Lyamani H. , Olmo F. J. , Alados-Arboledas L . Light scattering and absorption properties of aerosol particles in the urban environment of Granada, Spain. Atmos. Environ. 2008; 42: 2630–2642.
- Lyamani H. , Olmo F. J. , Alados-Arboledas L . Physical and optical properties of aerosols over an urban location in Spain: seasonal and diurnal variability. Atmos. Chem. Phys. 2010; 10: 239–254.
- Malm W. C. , Kreidenweis S. M . The effects of models of aerosol hygroscopicity on the apportionment of extinction. Atmos. Environ. 1997; 31(13): 1965–1976.
- Massling A. , Leinert S. , Wiedensohler A. , Covert D . Hygroscopic growth of sub-micrometer and one-micrometer aerosol particles measured during ACE-Asia. Atmos. Chem. Phys. 2007; 7: 3249–3259.
- Massoli P. , Bates T. S. , Quinn P. K. , Lack D. A. , Baynard T. , co-authors . Aerosol optical and hygroscopic properties during TexAQS-GoMACCS 2006 and their impact on aerosol direct radiative forcing. J. Geophys. Res. 2009; 114: 00F07.
- Meier J. , Wehner B. , Massling A. , Birmili W. , Nowak A. , co-authors . Hygroscopic growth of urban aerosol particles in Beijing (China) during wintertime: a comparison of three experimental methods. Atmos. Chem. Phys. 2009; 9: 6865–6880.
- Mircea M. , Facchini M. C. , Decesari S. , Cavalli F. , Emblico L. , co-authors . Importance of the organic aerosol fraction for modelling aerosol hygroscopic growth and activation: a case study in the Amazon Basin. Atmos. Chem. Phys. 2005; 5: 3111–3126.
- Müller T. , Henzing J. S. , de Leeuw G. , Wiedensohler A. , Alastuey A. , co-authors . Characterization and intercomparison of aerosol absorption photometers: result of two intercomparison workshops. Atmos. Meas. Tech. 2011; 4: 245–268.
- Navas-Guzmán F. , Bravo-Aranda J. A. , Guerrero-Rascado J. L. , Granados-Muñoz M. J. , Alados-Arboledas L . Statistical analysis of aerosol optical properties retrieved by Raman lidar over Southeastern Spain. Tellus B. 2013; 65: 21234. http://dx.doi.org/10.3402/tellusb.v65i0.21234 .
- Nessler R. , Weingartner E. , Baltensperger U . Effect of humidity on aerosol light absorption and its implications for extinction and the single scattering albedo illustrated for a site in the lower free troposphere. J. Aerosol Sci. 2005; 36: 958–972.
- Orr C. Jr , Hurd K. , Corbett W. J . Aerosol size and relative humidity. J. Colloid Sci. 1958; 13: 472–482.
- Pan X. L. , Yan P. , Tang J. , Ma J. Z. , Wang Z. F. , co-authors . Observational study of influence of aerosol hygroscopic growth on scattering coefficient over rural area near Beijing mega-city. Atmos. Chem. Phys. 2009; 9: 7519–7530.
- Petzold A. , Schönlinner M . Multi-angle absorption photometry – a new method for the measurement of aerosol light absorption and atmospheric black carbon. J. Aerosol Sci. 2004; 35: 421–441.
- Querol X. , Alastuey A. , Pey J. , Cusack M. , Pérez N. , co-authors . Variability in regional background aerosols within the Mediterranean. Atmos. Chem. Phys. 2009; 9: 4575–4591.
- Quinn P. K. , Bates T. S. , Baynard T. , Clarke A. D. , Onasch T. B. , co-authors . Impact of particulate organic matter on the relative humidity dependence of light scattering: a simplified parameterization. Geophys. Res. Lett. 2005; 32: 22809.
- Seinfeld J. H. , Pandis S. N . Atmospheric Chemistry and Physics: From Air Pollution to Climate Change. 1998; Wiley, New York, 1326.
- Sheridan P. J. , Delene D. J. , Ogren J. A . Four years of continuous surface aerosol measurements from the Department of Energy's Atmospheric Radiation Measurement Program Southern Great Plains Cloud and Radiation Testbed site. J. Geophys. Res. 2001; 106(D18): 20735–20747.
- Sheridan P. J. , Ogren J. A . Observation of the vertical and regional variability of aerosol optical properties over central and eastern North America. J. Geophys. Res. 1999; 104(D14): 16793–16805.
- Song S. , Wu Y. , Jiang J. , Yang L. , Cheng Y. , Hao J . Chemical characteristics of size-resolved PM2.5 at a roadside environment in Beijing, China. Environ. Pollut. 2012; 161: 215–221.
- Tang I. N . Chemical and size effects of hygroscopic aerosols on light scattering coefficients. J. Geophys. Res. 1996; 101: 19245–19250.
- Tang I. N. , Munkelwitz H. R . Composition and temperature dependence of the deliquescence properties of hygroscopic aerosols. Atmos. Environ. 1993; 27A: 467–473.
- ten Brink H. M. , Khlystov A. , Kos G. P. A. , Tuch T. , Roth C. , co-authors . A high flow humidograph for testing the water uptake by ambient aerosol. Atmos. Environ. 2000; 34: 4291–4300.
- Titos G. , Foyo-Moreno I. , Lyamani H. , Querol X. , Alastuey A. , co-authors . Optical properties and chemical composition of aerosol particles at an urban location: an estimation of the aerosol mass scattering and absorption efficiencies. J. Geophys. Res. 2012; 117: 04206.
- Titos G. , Jefferson A. , Sheridan P. J. , Andrews E. , Lyamani H. , co-authors . Aerosol light-scattering enhancement due to water uptake during TCAP campaign. Atmos. Chem. Phys. 2014a; 14: 7031–7043.
- Titos G. , Lyamani H. , Pandolfi M. , Alastuey A. , Alados-Arboledas L . Identification of fine (PM1) and coarse (PM10-1) sources of particulate matter in an urban environment. Atmos. Environ. 2014b; 89: 593–602.
- Wang J. , Martin S. T . Satellite characterization of urban aerosols: importance of including hygroscopicity and mixing state in the retrieval algorithms. J. Geophys. Res. 2007; 112: 17203.
- Wiscombe W. J. , Grams G. W . The backscattered fraction in two-stream approximations. J. Atmos. Sci. 1976; 33: 2440–2451.
- WMO/GAW. Aerosol Measurement Procedures Guidelines and Recommendations. 2003; Geneva, Switzerland: World Meteorological Organization. Global Atmosphere Watch Report No. 153.
- Wu A. , Birmili W. , Poulain L. , Wang Z. , Merkel M. , co-authors . Particle hygroscopicity during atmospheric new particle formation events: implications for the chemical species contributing to particle growth. Atmos. Chem. Phys. 2013; 13: 6637–6646.
- Yan P. , Pan X. , Tang J. , Zhou X. , Zhang R. , co-authors . Hygroscopic growth of aerosol scattering coefficient: a comparative analysis between urban and suburban sites at winter in Beijing. Particuology. 2009; 7: 52–60.
- Zieger P. , Fierz-Schmidhauser R. , Gysel M. , Ström J. , Henne S. , co-authors . Effects of relative humidity on aerosol light scattering in the Artic. Atmos. Chem. Phys. 2010; 10: 3875–3890.
- Zieger P. , Fierz-Schmidhauser R. , Poulain L. , Müller T. , Birmili W. , co-authors . Influence of water uptake on the aerosol particle light scattering coefficients of the Central European aerosol. Tellus B. 2014; 66: 22716. http://dx.doi.org/10.3402/tellusb.v66.22716 .
- Zieger P. , Fierz-Schmidhauser R. , Weingartner E. , Baltensperger U . Effects of relative humidity on aerosol light scattering: results from different European sites. Atmos. Chem. Phys. 2013; 13: 10609–10631.
- Zieger P. , Kienast-Sjögren E. , Starace M. , von Bismarck J. , Bukowiecki N. , co-authors . Spatial variation of aerosol optical properties around the high-alpine site Jungfraujoch (3580 m a.s.l.). Atmos. Chem. Phys. 2012; 12: 7231–7249.
- Zieger P. , Weingartner E. , Henzing J. , Moerman M. , de Leeuw G. , co-authors . Comparison of ambient aerosol extinction coefficients obtained from in-situ, MAX-DOAS and LIDAR measurements at Cabauw. Atmos. Chem. Phys. 2011; 11: 2603–2624.