
Abstract
This paper describes the NOy plumes originating from lightning emissions based on 4 yr (2001–2005) of MOZAIC measurements in the upper troposphere of the northern mid-latitudes, together with ground- and space-based observations of lightning flashes and clouds. This analysis is primarily for the North Atlantic region where the MOZAIC flights are the most frequent and for which the measurements are well representative in space and time. The study investigates the influence of lightning NOx (LNOx) emissions on large-scale (300–2000 km) plumes (LSPs) of NOy. One hundred and twenty seven LSPs (6% of the total MOZAIC NOy dataset) have been attributed to LNOx emissions. Most of these LSPs were recorded over North America and the Atlantic mainly in spring and summer during the maximum lightning activity occurrence. The majority of the LSPs (74%) is related to warm conveyor belts and extra-tropical cyclones originating from North America and entering the intercontinental transport pathway between North America and Europe, leading to a negative (positive) west to east NOy (O3) zonal gradient with −0.4 (+18) ppbv difference during spring and −0.6 (+14) ppbv difference in summer. The NOy zonal gradient can correspond to the mixing of the plume with the background air. On the other hand, the O3 gradient is associated with both mixing of background air and with photochemical production during transport. Such transatlantic LSPs may have a potential impact on the European pollution. The remaining sampled LSPs are related to mesoscale convection over Western Europe and the Mediterranean Sea (18%) and to tropical convection (8%).
1. Introduction
Nitrogen species (NOy=NO+NO2+HNO3+N2O5+PAN+other reservoir species) and especially reactive nitrogen (NOx=NO+NO2) play a crucial role in atmospheric chemistry by determining the level of ozone (O3), acidity and the oxidising capacity of the atmosphere (Crutzen, Citation1973; Liu et al., Citation1980; Thompson, Citation1992). The partitioning of NOy into NOx and oxidised reservoir species, such as HNO3, N2O5, PAN and other organic nitrates, varies among regions and as a function of altitude. For example, Neuman et al. (Citation2001) found NOy to be dominated by HNO3+NOx in the upper troposphere (UT) (40–100%). Similar results were obtained by Talbot et al. (Citation1999) with more than 60% of the background NOy mixing ratio found to be due to NOx and HNO3. More recently, Bertram et al. (Citation2007) showed that the ratio NOx/HNO3 is higher than the steady-state ratio at altitudes greater than 6 km. Hudman et al. (Citation2007) observed a maximum of PAN of approximately 400 pptv at altitudes of 6–10 km and a depletion of HNO3 in the free troposphere because of heterogeneous removal.
The various NOx sources in the UT (Grewe, Citation2007) include uplifting of surface emissions (anthropogenic, biogenic and biomass burning emissions, e.g. Real et al., Citation2008), stratosphere to troposphere exchange (Brioude et al., Citation2006), as well as aircraft emissions, and production by lightning, henceforth denoted LNOx (e.g. Koike et al., Citation2003). Among these influences, lightning production is one of the highest sources all year round in the UT at northern mid-latitudes, with maximum values during summer (Christian et al., Citation2003; Hudman et al., Citation2007), although the global source strength is still poorly constrained with a best estimate of 5±3 Tg N yr−1 (c.f. Schumann and Huntrieser, Citation2007). LNOx emissions are induced by convective systems with thunderstorms, either isolated or embedded in warm conveyor belts (WCB) and frontal systems (Koike et al., Citation2003). Moreover, deep convection can inject NOx directly in the UT where its lifetime (week) is much longer than in the planetary boundary layer (PBL, <day), thus increasing its potential influence over longer distances compared to the lower troposphere (LT). In addition, several studies have shown that LNOx has the strongest influence on O3 production efficiency in the UT (Grewe, Citation2007; Sauvage et al., Citation2007a), where O3 has the most important radiative effect on surface temperature (Mickley et al., Citation2004). Model studies (DeCaria et al., Citation2000; Hauglustaine et al., Citation2001; Cooper et al., Citation2006; Martin et al., Citation2006; Hudman et al., Citation2007) suggested that the impact of LNOx on the O3 budget over North America (1–13 ppbv/day) is larger than previously estimated (Pickering et al., Citation1990, Citation1992a, Citationb; Allen et al., Citation2000). Cooper et al. (Citation2009) showed that in summer a plume of aged thunderstorm outflow could extend from North America to the west coasts of Northern Africa and Southern Europe suggesting that such plumes could have a potential impact remotely from the source region due to intercontinental transport.
Dedicated aircraft campaigns conducted in the past have made considerable contributions to improve the estimate of LNOx emissions over mid-latitudes or sub-tropics, e.g. STREAM 1998 (Stratosphere–Troposphere Exp eriment by Aircraft Measurements; Lange et al., Citation2001), STERAO (Stratosphere–Troposphere Experiment: Radiation, Aerosols, and Ozone; Dye et al., Citation2000; Skamarock et al., Citation2003), EULINOX (European Lightning Nitrogen Oxides Project; Ott et al., Citation2007), TROCCINOX (Tropical Convection, Cirrus and Nitrogen Oxides; Huntrieser et al., Citation2008), and SCOUT-O3/ACTIVE (Stratospheric–Climate Links with Emphasis on the Upper Troposphere and Lower Stratosphere and Aerosol; and Chemical Transport in Deep Convection; Huntrieser et al., Citation2009; Labrador et al., Citation2009). These campaigns present limitations for quantifying a global budget of upper tropospheric NOx. Indeed most of the measurements were confined to the vicinity of meso-scale convective systems and did not allow the investigation of the evolution downwind. Nevertheless, other aircraft campaigns (Emmons et al., Citation1997; Thakur et al., Citation1999; Ziereis et al., Citation2000; Singh et al., Citation2006; Huntrieser et al., Citation2008) and space-based observations (Bertram et al., Citation2005; Martin et al., Citation2007; Sioris et al., Citation2007; Keim et al., Citation2008; Wespes et al., Citation2009) offer the possibility to observe nitrogen species in the UT with the spatio-temporal coverage required for distinguishing the influence of LNOx from other potential sources. Distinguishing LNOx emissions from anthropogenic emissions is difficult as both of them can be injected in the UT through rapid upward transport in continental convective cells as suggested by Singh et al. (Citation2007) in the analysis of the ICARTT (International Consortium for Atmospheric Research on Transport and Transformation) mission of the Intercontinental Chemical Transport Experiment over North America (INTEX-NA). However, using CO as a tracer of anthropogenic emissions could help to differentiate between lightning and anthropogenic emissions, as both emission sources are high over North America (Olivier and Berdowski, Citation2001). The INTEX-NA project provided observations of nitrogen species (NOx, HNO3 and PAN) influenced by lightning during the summer 2004 (1 July–15 August) over the Eastern United States and the Atlantic. Measurements were performed by one aircraft (with 18 science flights) downwind of convective events in order to characterise chemistry of some plumes over the Atlantic. Brunner et al. (Citation1998) observed large-scale plumes (LSP) of pollution in the UT extending over hundreds of kilometres over the Eastern part of North America in the data from the NOXAR experiment (Nitrogen OXides and ozone along Air Routes). They attributed these plumes to anthropogenic and LNOx emissions, without further distinguishing their actual origin and their chemical evolution during transport. Jeker et al. (Citation2000) analysed three cases of LSP using the SONEX (Subsonic Assessment (SASS) Ozone and Nitrogen Oxide Experiment)/POLINAT 2 (Pollution from Aircraft Emissions in the North Atlantic Flight Corridor) campaign in 1997 over the North Atlantic flight corridor (Singh et al., Citation1999 and Thompson et al., Citation2000). Moreover, a number of studies from the SONEX and POLINAT campaigns point out the link between plumes of post-convection NOx sources and LNOx emissions (Liu et al., Citation1999; Thompson et al., Citation1999; Wang et al., Citation2000). They also showed that the long-lived NOx and NOy are important sources of UT O3. However, these and other aircraft campaigns lack the statistical robustness of comprehensive seasonal and geographical coverage that measurements on commercial aircraft can provide.
In this paper, we use simultaneous in-situ observations of chemical species (O3, CO, NOy) measured by the MOZAIC programme (Measurement of Ozone, water vapour, nitrogen oxides and carbon monoxide by AIrbus in-service airCraft, http://www.iagos.fr/mozaic; Marenco et al., Citation1998). Measurements have been made between April 2001 and May 2005 mostly in the UT and the lower stratosphere (LS) of the North Atlantic flight corridor (see Section 2.1 for more details). The sampling by the MOZAIC programme is recognised to have a good representativeness in space and time in light of climatologies of trace gases carried out previously (Thouret et al., Citation2006). Also, this study is mainly for the North Atlantic and for time and locations where commercial aircrafts fly within the North Atlantic corridor as the main flight route. Thomas et al. (Citation2014) discuss the NOy measurements made in MOZAIC, showing that lightning emissions have a potentially large influence on the seasonal and regional distribution of NOy in the UT. We use the same MOZAIC measurements together with ground-based and space-borne observations of lightning activity and clouds to provide the detailed description of lightning-related LSPs. Section 3 explains the methodology used to extract the LSPs from the entire data base. In particular, Lagrangian simulations with the FLEXPART model are used to identify the convective origin of the plumes. Section 4 gives the overall picture with a special focus on the LSPs observed over the North Atlantic flight corridor, downwind of thunderstorm systems over North America.
2. Data and numerical tools
2.1. MOZAIC in-situ data
The primary data used in this study are from in-situ observations of NOy, O3, and CO made with autonomous instruments deployed aboard commercial long-haul aircraft in the MOZAIC programme (Marenco et al., Citation1998). Most of the measurements are recorded in the UT/LS, between 9 and 12 km altitude. In MOZAIC, regular measurements of O3 and RH (Relative Humidity) have been performed since 1994, using a UV-absorption monitor for O3 (Thouret et al., Citation1998) and a Vaisala Humicap sensor for RH (Helten et al., Citation1998). In 2001, a NOy instrument was installed on one of the MOZAIC aircraft using a chemiluminescence detector combined with a catalytic converter for conversion of the different NOy compounds to NO (Volz-Thomas et al., Citation2005). CO has been measured regularly on all MOZAIC aircrafts since December 2001, using a modified infrared filter correlation monitor (Nédélec et al., Citation2003). For the integration interval of 4s applied in MOZAIC, the accuracy of the measurements has been estimated as follows: O3:±2 ppbv ±2% (Thouret et al., Citation1998); RH:±6% (Helten et al., Citation1998; Smit et al., Citation2008); CO (30s response time):±5 ppbv±5% (Nédélec et al., Citation2003); and NOy:±50 pptv±5%(Volz-Thomas et al., Citation2005; Pätz et al., Citation2006). Between December 2001 and May 2005, 1685 MOZAIC flights are available with combined measurements of NOy and the other trace gases. It must be noted that the MOZAIC data do not provide direct information on NOx.
2.2. Satellite cloud imagery
Observations of clouds were obtained from infrared (IR) images provided by geostationary satellites, mainly the Geostationary Operational Environmental Satellite (GOES) East satellite (channel 4). The data were provided at hourly resolutions by the SATMOS service (http://www.satmos.meteo.fr/). These data give a good overview of synoptic weather systems in order to localise deep convection potentially leading to lightning activity. Geostationary satellite IR imagery also offers the possibility to track short- and long-lifetime convective systems and, consequently, to identify the spatial and temporal occurrence of those convective clouds from which the trace gases measured along the flight tracks originate. According to the regions of interest, only the data over North Atlantic and North America were used in this study.
2.3. Ground-based lightning detection
Information on the lightning activity in convective clouds was derived from the National Lightning Detection Network (NLDN), which consists of over 100 ground-based sensing stations located across the United States. This system provides information on location, time, polarity and amplitude of each stroke by detecting the electromagnetic signals given off when lightning strikes the surface over the United States and the adjacent coastal areas (18°N–60°N and 130°W–60°W). Since 2002, NLDN detects cloud-to-ground (CG) flashes with a detection efficiency of at least 90% (Cummins and Murphy, Citation2009). In the following all the flashes recorded by NLDN are considered as CG flashes.
2.4. FLEXPART Lagrangian dispersion model
The spatial and temporal origin of the air masses observed by MOZAIC was determined using the FLEXPART Lagrangian dispersion model version 9.02 (http://transport.nilu.no/flexpart; Stohl et al., Citation2005). The model calculates trajectories of user-defined ensembles of particles released from three-dimensional boxes either in backward or in forward mode. In this study, 10000 particles were released from each 0.1°×0.1°×0.1 hPa box along every MOZAIC flight track. The model was run in backward mode, which has been shown to be more efficient than forward modelling for calculating source–receptor relationships (Stohl et al., Citation2003). The model was driven by wind fields provided by the European Centre for Medium-range Weather Forecast (ECMWF) using both analyses and forecasts with a temporal resolution of 3 hours (analyses at 0000, 0600, 1200, 1800 UTC; forecasts at 0300, 0900, 1500, 2100 UTC). The horizontal resolution is 1°×1° and 60 vertical levels are used. Turbulence is parameterised solving Langevin equations (Stohl and Thomson, Citation1999) and the convection parameterisation scheme is adopted from Emanuel and Zivkovic-Rothman (Citation1999) for all types of convection. The PBL height is derived using the critical Richardson number concept. Besides particle positions, FLEXPART also includes cluster analysis for particle ensembles and the average residence time of the particles in the grid cells.
In this study, two different FLEXPART calculations were performed in order to attribute air masses with enhanced NOy to lightning: (1) cluster analysis to discard the influence by transport from the stratosphere; and (2) analysis of residence time of trajectories to trace back the convective origin. In the first case, information of the particle positions is used to distinguish between MOZAIC observations influenced by the stratosphere and those related to tropospheric processes. We adopted a method that Stohl et al. (Citation2002) developed to condense the large volume of information of the particle dispersion in trajectory ensembles, by using a cluster analysis of the particle positions.
3. Methodology for identifying lightning-related plumes
As mentioned earlier, besides lightning, sources of NOy to the UT include aircraft emissions, as well as transport from the stratosphere and the boundary layer.
Therefore, a methodology was developed to identify plumes of high NOy induced by lightning NOx emissions, comprising the following steps:
Removal of aircraft emissions (Section 3.1).
Identification of tropospheric air masses by discarding stratospheric influence (Section 3.2).
Within the tropospheric air masses, identification of lightning related plumes by using CO and NOy seasonal distributions in the UT for the discarding air masses influenced by surface emissions (Section 3.3).
Validation and further characterisation of lightning-related LSPs of NOy (Section 3.4).
The method was automatically applied to all MOZAIC flights.
3.1. Aircraft emissions
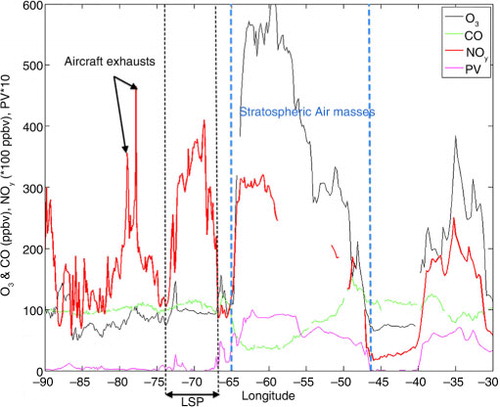
Over the North Atlantic flight corridor aircraft emissions are intense since it is one of the busiest air routes in the world and, according to model simulations, can influence the NOy budget by up to 10% on annual average (Grewe, Citation2007). However, it has been shown that recent aircraft emissions are characterised by sharp anomalies up to 8 ppbv of NOy and 5–10 km extent (Schumann, Citation1997). Aircraft emissions are clearly visible on individual flights, as shown in , and are distinct from the large NOy anomalies related to lightning NOx emissions (between 68°W and 74°W in ). They are thus easily excluded in the individual MOZAIC flights. After a few hours in the troposphere, the remaining NOx contribution from air traffic is quite low, i.e. 25–50 pptv in monthly average (Kraabol et al., Citation2002), due to dilution.
Fig. 1 Trace gas measurements along the flight track between Frankfurt and Houston and between 85°W and 40°W, on 13 June 2003. The data were averaged every 0.1°. NOy (ppbv×100, red line), CO (green), O3 (black) mixing ratios (ppbv), and PV (pvu×10, pink). Blue dashed lines delimit the stratospheric influence and the black dotted line point out an LSP.
3.2. Identification of tropospheric air masses
A twofold approach is used to distinguish air masses of stratospheric-origin from those of tropospheric-origin in the MOZAIC records:
All data for which the potential vorticity (PV) computed from ECMWF analysis and interpolated over the MOZAIC observations is larger than 2 pvu are discarded. This criterion is commonly used to distinguish between tropospheric and stratospheric air (Hoskins et al., Citation1985).
Since PV at the time of the observation may not be sufficiently restrictive to discard stratospheric-origin air masses, we also discard all air masses for which the back trajectories have been associated with PV values larger than 2 pvu during the last 3 d before the observation. For each MOZAIC observation in the entire MOZAIC NOy database (every 0.1° in latitude or longitude) five clustered particle positions such as latitude, longitude, pressure, PV and the fraction of the total number of particles for each cluster, are used to exclude stratospheric air masses and those influenced by recent intrusions from the stratosphere when at least three clusters show stratospheric origin.
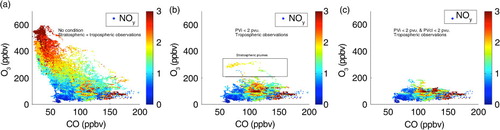
illustrates how the methodology removes the stratospheric air masses from the MOZAIC dataset based on O3 – CO scatter plots (colour-coded with NOy). The left panel (a) displaying non-filtered data shows the stratospheric reservoir, i.e. the vertical branch with high O3 and NOy and low CO, the tropospheric reservoir (horizontal branch with high CO, variable O3 and NOy) and the transition between the two branches (Hoor et al., Citation2002; Brioude et al., Citation2008). The centre panel (b) displays the same scatter plot for data filtered using the local PV threshold. The remaining stratospheric signatures are finally removed by applying the Lagrangian cluster approach on PV (right panel, c).
Fig. 2 Scatter plots of MOZAIC O3 vs. CO mixing ratios collared with simultaneous NOy mixing ratios during June–July–August 2003 in the UTLS over the American continent. Left: UTLS (Upper Troposphere Lower Stratosphere region, pressure <300 hPa); middle: tropospheric data with remaining stratospheric influence (instant potential vorticity, PVi <2 pvu.); right: tropospheric data (PV <2 pvu. during the 72 hours before observations).
3.3. Identification of lightning-related plumes
Starting from the tropospheric dataset (described in Section 3.2), plumes in the UT (pressure lower than 300 hPa) are extracted based on the seasonal and regional frequency distributions of NOy and on the coincident CO mixing ratios.
3.3.1. Seasonal NOy and CO distributions in the upper troposphere
Table and 2 summarise the frequency distributions of NOy and CO respectively in the UT (p<300 hPa) in terms of mean, median and Q3 for each season and for three different geographical regions (North America, Atlantic, and Europe). NOy plumes are defined as to be part of the upper 25% of the seasonal distribution (higher than the 75% percentile Q3; ). This selection describes the air masses with distinct NOy anomalies respect to the median (Q2). As a specification in terms of statistical analysis, the Q3 splits off the highest 25% of data from the lowest 75% and the median or Q2 parameter cuts dataset in half. The median is generally used to assess atmospheric baseline concentrations for atmospheric observation datasets, that is an atmosphere free of recent pollution or of very clean influence and characteristic of well-mixed air masses of different origins (Hemispheric Transport of Air Pollution HTAP report, 2010: http://www.htap.org/). Therefore, this selection allows focusing on NOy enhancements that are related to quite recent emissions and avoids ambiguous cases of aged plumes that may have already undergone extensive mixing with potentially higher influence of multiple sources than recent air masses.
Table 1. Statistics (median, mean and third quartile) of NOy for the upper tropospheric air masses observed in MOZAIC between 2001 and 2005 for three different regions (North America: 30°N-60°N/120°W-60°W, Atlantic: 0°N-60°N/60°W-25°W, and Europe: 35°N-70°N/25°W-40°E)
Table 2. Statistics (median, mean and third quartile) of CO for the upper tropospheric air masses observed in MOZAIC between 2001 and 2005 for three different regions (North America: 30°N-60°N/120°W-60°W, Atlantic: 0°N-60°N/60°W-25°W, and Europe: 35°N-70°N/25°W-40°E)
As detailed in Thomas et al. (Citation2014), there are 80–120 flights per season between April 2001 and May 2005. NOy mixing ratio is higher by a factor of 1.5–5 during spring (MAM) and summer (JJA) than in autumn (SON) and winter (DJF). Moreover, using this methodology, 351 plumes were identified during MAM, 201 plumes in JJA, 413 plumes during SON, and the DJF season has 430 NOy plumes. The highest number of plumes identified in DJF period is likely due to the fact that Q3 is much lower in DJF. However, only a few (five plumes over the 4 yr) of these winter plumes meet the large-scale criteria (length >300 km, see Section 3.4). The following results will then concentrate on MAM, JJA and SON.
3.3.2. Surface emissions
In order to isolate the influence of polluted surface air, coincident CO concentrations were used. CO is co-emitted with NOx from combustion sources and is a well-suited tracer for transport of pollution from the boundary layer (e.g. Worden et al., Citation2010).
The mean climatology of CO (from year 2001 to 2005) is relatively featureless in the North Atlantic flight corridor with the seasonal median almost constant over the three regions (). Thus, the CO median in the UT of the northern mid-latitudes is representative of well-mixed air masses, in line with its relatively long photochemical lifetime (weeks to months) in the UT. Regional differences appear when considering the seasonal Q3 with a difference of 8 ppbv in MAM between the North Atlantic flight corridor and adjacent continental regions located close to convection.
Consequently, NOy enhancements associated with positive anomalies of CO mixing ratio measurements (higher than the seasonal UT Q3) are excluded in order to avoid mixed situations of both anthropogenic and lightning sources. On the other hand, NOy enhancements with small CO anomalies (lower than Q3) would be considered as representative of both LNOx emissions and uplifting of unpolluted air from the PBL generally characterised by higher CO than UT baseline values for continental air masses (e.g. Pickering et al., Citation1996; Folkins et al., Citation2006).
3.4. Characterisation of LSPs and validation of the lightning-NOx influence
3.4.1. Further characterisation of LSPs
Using the criteria defined above, 1395 NOy enhanced plumes were found in the MOZAIC database. displays the frequency distribution of the horizontal extent of the plumes for the three geographical regions: North America (NAM, 30°N–60°N/120°W–60°W), Atlantic (ATL, 0°N–60°N/60°W–25°W) and Europe (EU, 35°N–70°N/25°W–40°E), in summer (JJA). In general, plumes have a horizontal extent of less than 300 km (77, 88 and 83% for the measurements made respectively over NAM, ATL and EU). Although the horizontal extent of the plumes is difficult to assess from 1D data trajectories such as MOZAIC flights, shows that plumes wider than 300 km on average have NOy mixing ratios about 0.5 ppbv higher than the plumes smaller than 300 km. Therefore, the 300 km threshold was chosen in order to focus on those exceptional plumes only. This value is much larger than the typical 50 km length observed in research aircraft experiments close to the outflow of convective cells (e.g. Huntrieser et al., Citation2008) and still wider than the 100 km length observed during the NOXAR experiment (Brunner et al., Citation1998). The selection is, however, consistent with the much longer lifetime of NOy (several days) in the UT as compared to NOx (several hours).
Fig. 3 Frequency distributions of the horizontal extent of the NOy lightning-related plumes (see Sections 3.2 and 3.3) observed in JJA over the regions NAM, ATL, and EU.
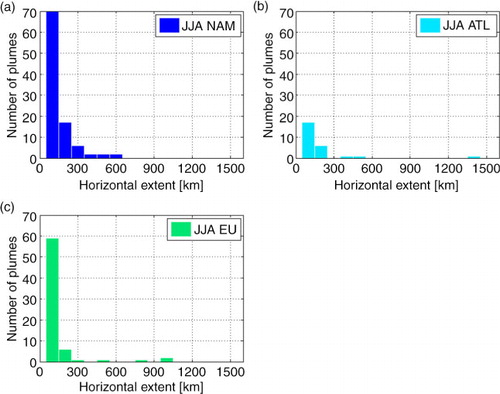
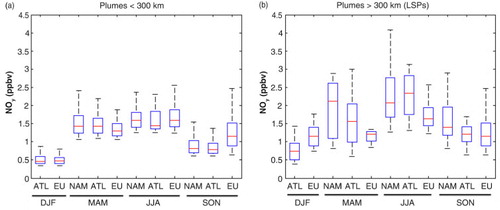
Fig. 4 Seasonal variations (DJF, MAM, JJA and SON) of the frequency distribution (box and whisker plots) of NOy for plumes with a horizontal extent <300 km (left) and within the LSPs of >300 km (right) for the three different regions (NAM, ATL and EU). Boxes: interquartile range (Q1 and Q3); red line: median; whiskers: 5th and 95th percentiles.
3.4.2. Evidence of lightning NOx influence
In order to investigate that such NOy enhanced plumes wider than 300 km are induced by LNOx emissions (LSPs), their link with convection and lightning activity was investigated by comparing FLEXPART backward trajectories of particles initialised in each LSP to GOES IR brightness temperatu-res (BTs) and NLDN flash observations. This was realised only for plumes originating from the North American continent for which the observation of lightning activity was available. The convective origin was retrieved in releasing multiple particles from each LSP. The FLEXPART model, used in backward mode, calculates residence time and the horizontal and vertical dispersion of the particles throughout the troposphere. To trace back convective areas, we consider only particles located according to the backward calculations at the altitude ranges 0–3 km (corresponding to LT) and 9–12 km (corresponding to UT) at each 3-hourtime-step. This is the way to localise particles within the convective updraft considering the main altitudes regions of entrainment (LT) and detrainment (UT) (De Rooy et al., Citation2013).
a gives for MAM, JJA and SON a composite map of the origin of the LSPs in terms of residence time of particles normalised to (1) the cumulative residence time and (2) the fraction of flights recording transatlantic LSPs against total number of MOZAIC flights, for both over each season, and integrated for the 6 d prior the MOZAIC measurements. Sensitivity tests were conducted to select suitable integration time (3–10 d) for FLEXPART calculations. As demonstrated by Cooper et al. (Citation2009), high concentration of O3 and NO species in the UT over North America can be associated with aged LNOx emissions (greater than 3 d). Consequently, FLEXPART simulations have been integrated over 6 d to ensure reliability of back trajectories and in order to better assess the origin of the plumes that may be associated with lightning activity. The GOES IR BT lower than 220 K is used as a proxy of the deep convection occurrence (Cecil, Citation2009; Liu et al., Citation2011). GOES IR observations are selected at the same time and location of the backward plumes retrieved by FLEXPART at the two LT and UT altitude ranges at each 3-hour time-step of the FLEXPART calculation. Cumulative distributions of BT were computed at each FLEXPART grid point to derive the percentile for BT below 220 K (referring to b). NLDN observations were further used to quantify the CG lightning activity temporally and spatially coincident with the FLEXPART simulations. The NLDN data are integrated over ±1.5 hours around the FLEXPART calculation output at each 3-hour time-step. Finally, the number of flashes is integrated for each LSP and over each season (referring to c). Note that the NLDN observations do not correspond strictly to GOES-IR BTs <220 K.
Fig. 5 Convective origin below 3 km and between 9 and 12 km of a 6 d integration of the transatlantic NOy LSPs as calculated with the FLEXPART model, with a horizontal resolution of 1°×1°, as the normalised residence time (normalised to (1) the cumulative residence time and (2) the fraction of flights recording transatlantic LSPs against total number of MOZAIC flights, for both over each season) in% (a), the occurrence of the IR brightness temperature <220 K in% observed by GOES (b) and the distribution of lightning flashes observed by NLDN (c). NLDN and GOES observations are sampled at the same time and location as the FLEXPART model. Parameters are represented over seasons (top: MAM, middle: JJA, bottom: SON).
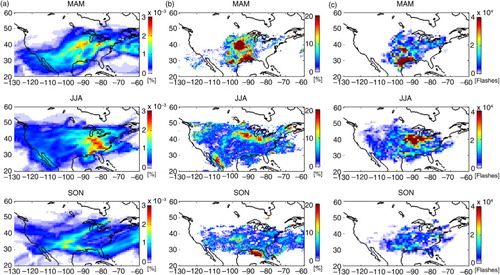
There is a good agreement between FLEXPART backward plumes coming from the LT & UT (>1×10Λ−3%) and the occurrence of high convective clouds observed by GOES and CG lightning flashes observed by NLDN. displays also a clear seasonal variability for the three data fields. The maximum FLEXPART residence time occurs during JJA between the Great Lakes region and Florida (>2×10Λ−3%), in agreement with the maximum number of NLDN flashes south of the Great Lakes region (>4×10Λ4 flashes) and with high occurrence of BT lower than 220 K (>20%). In spring, the highest residence time calculated by the FLEXPART model is located southwest of the Great Lakes region. This maximum is associated with the convective activity represented by the geographical maximum occurrence of deep convection as derived from GOES IR measurements (>20%) with a cumulated lightning amount of 2–4×10Λ4 flashes. It is worth mentioning that the distribution of flashes does not necessarily match exactly the regions of the highest occurrence of deep convective clouds for the LSPs studied here. This can be explained by the fact that the NLDN observations correspond only to CG flashes and do not document the intra-cloud activity, which is more linked to deep convection. Finally, SON is characterised by maximum of high clouds occurrence over Gulf of Mexico (15–20%) and over Colorado (10%) and a lightning activity (1–2.104 flashes) where the maximal residence time is computed by FLEXPART.
4. Results
In this section, we describe the seasonal features of the NOy LSPs induced by LNOx emissions, i.e. distribution variations, origin and transport pathways with a focus on the Atlantic region.
4.1. Seasonal and regional distributions of the LSPs
When applying the criteria described in Section 3 to the MOZAIC database, 127 plumes (6% of the total MOZAIC NOy dataset and less than 10% of the 1395 lightning-related plumes) are identified as LSPs (). As summarised in , most of the plumes are observed in SON (43 plumes, observed over 35 flights), JJA (41 plumes, observed over 32 flights) and MAM (38 observed over 21 flights), whereas only five plumes are observed in DJF (over five flights). Just over half (51%) of the LSPs detected along the MOZAIC routes are found over the East coast of the North American continent and over the North Atlantic flight corridor; the remaining LSPs are detected over Europe (41%) and over Northern Africa and Asia (8%).
Fig. 6 Number of NOy LSPs identified for the different seasons (DJF, MAM, JJA, SON) over the regions NAM, ATL, EU, AFR and ASIA using the criteria described in Sections 3.2 and 3.3.
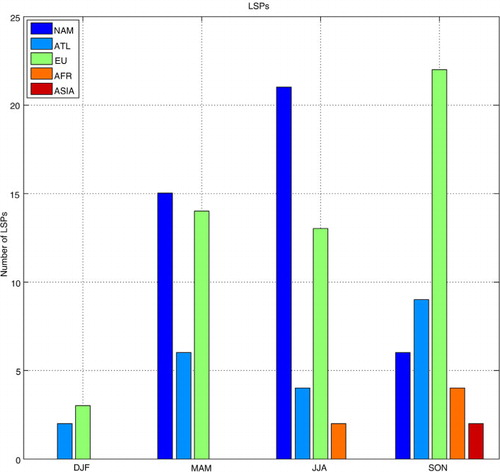
Table 3. Seasonal distribution of the LSPs (top) and origin of the convection (bottom)
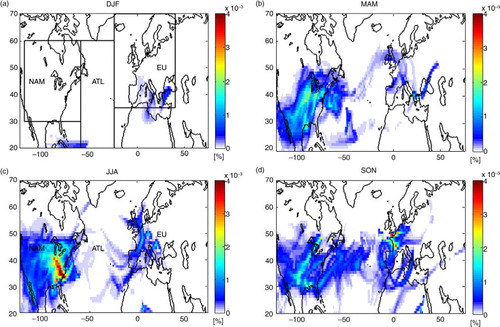
gives the backward trajectories of LSPs for each season from FLEXPART calculations. Regions of interest are represented by rectangles on the DJF panel respectively from the left to the right: NAM, ATL and EU. shows that plumes observed over Europe in MAM and JJA are mostly related to continental convection over Europe (6% of the 127 plumes). During the other seasons, NOy plumes measured over continental Europe can be explained also by convection occurring over the Mediterranean Sea (6% of the 127 plumes) as it is frequently observed in those seasons (Defer et al., Citation2005). Some of the plumes measured over Africa during JJA and SON (not shown here) are related to convective and lightning activity associated with the Inter Tropical Convergence Zone (less than 8% of the 127 plumes).
Fig. 7 Origin of the NOy LSPs as calculated with the FLEXPART model with a horizontal resolution of 1°×1°, for the four seasons over the North mid-latitudes (20°N–70°N). Colours represent the normalised residence time (normalised to (1) the cumulative residence time and (2) the fraction of flights recording LSPs against total number of MOZAIC flights, both over each season) of the particles initialised inside each LSP in the 0–3 km (LT) and 9–12 km (UT) layers during the 6 d backward simulation. The three black rectangles in the upper left panel define the study areas.
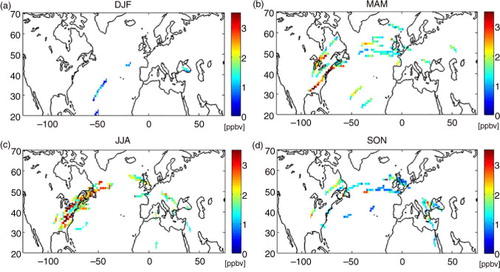
b shows that the average NOy mixing ratio within LSPs over the East coast of North America is higher by a factor of 1.5 in JJA and MAM than in SON and DJF. shows the seasonally averaged NOy mixing ratios of the 127 LSPs observed between December 2001 and May 2005 in the UT at a flight altitude ranging from 9 to 12 km. For that specific plot, mixing ratios have been averaged over 1°×1° grid boxes. There is a notable NOy seasonal variability in the LSPs between DJF, MAM, JJA and SON according to the . Especially, the NOy maximum (minimum) in JJA is about 3.5 (1.5) ppbv with the most of LSPs observed over the NAM west coast. On the other hand, in MAM and SON the NOy maximum (minimum) is about 3.5 (1) ppbv and 3 (0.75) ppbv respectively with LSPs identified in majority over the North Atlantic flight corridor and over Western Europe. Finally, DJF is characterised by a NOy mixing ratio lower than 0.5 ppbv in the selected LSPs over the Atlantic and Mediterranean basin.
Fig. 8 Seasonally averaged NOy mixing ratios (ppbv) in the LSPs determined as described in Section 3. Values are averaged over 1°latitude×1°longitude and for each season over the North mid-latitudes.
4.2. Composition of transatlantic LSPs
The objective here is to propose a pseudo-Lagrangian analysis of such LSPs in terms of trace gases composition. Therefore, we focus on 94 plumes (74% of the LSPs) observed over the North Atlantic flight corridor, which correspond to air masses originating from lightning over the American continent according to the FLEXPART analysis described above. displays the statistical parameters of the chemical compounds (NOy, CO, and O3) for those plumes for MAM, JJA and SON. As discussed previously, the winter season is not shown, because of the generally small NOy mixing ratios, which render the distinction between plumes and background statistically insignificant.
Fig. 9 Frequency distributions (box and whisker plots) of NOy, O3 and CO in the transatlantic LSPs for the three different regions (NAM, ATL, EU) during spring (MAM), summer (JJA) and autumn (SON). Boxes: interquartile range (Q1 and Q3); red line: median; whiskers: 5th and 95th percentiles.
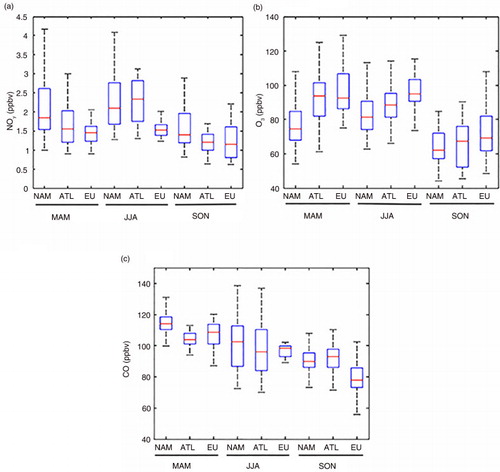
shows the highest NOy mixing ratios are observed during MAM and JJA over NAM and ATL with median values of 1.8–2.3 ppbv. Over Europe, NOy median mixing ratios are generally lower than over the western regions for all three seasons. As a result there is a negative west to east NOy gradient with differences of −0.4, −0.6 and −0.3 ppbv between NAM and EU in MAM, JJA and SON, respectively. On the other hand, ozone mean concentrations are higher over EU than over the NAM during MAM, JJA and SON, with respectively 93, 95 and 70 ppbv, leading to a positive west to east gradient with differences of +18, +14 and +7 ppbv between NAM and EU in each season. The results emphasise the more intense lightning activity during JJA and MAM leading to higher NOy anomalies with a potentially larger ozone production during spring than summer. Specifically, the observed O3 positive gradient associated with the NOy negative gradient in the plumes may be interpreted as the result of the photochemical production from the NOx. In addition, the O3 production could have an important impact on the seasonal temperature changes (as an important gas for the oxidising capacity of the atmosphere and as a powerful greenhouse gas) and on the wet deposition leading to a permanent removal of NOy species as HNO3 mentioned in the introduction part. also shows that CO values over the NAM region, i.e. closer to continental convection, are also slightly higher than over EU with −5, −4 and −12 ppbv differences in MAM, JJA and SON. These observations illustrate the effect of mixing with surrounding upper tropospheric air during transport between NAM and EU.
Overall, these results demonstrate that the so-called transatlantic LSPs observed by MOZAIC in the North Atlantic flight corridor are entering the classical scheme of intercontinental transport with uplift transport and lightning emissions over North American continent through continental convection (maximum of residence time over the East coast of the US in and ). This is followed by eastward advection over the Atlantic to Europe where downwelling of air masses may occur. Indeed, the North American continent and western Atlantic region has the maximum frequency of WCBs and extra-tropical cyclones in the northern latitudes (Eckhardt et al., Citation2004; HTAP report, 2010: http://www.htap.org/). Lightning activity is also predominant most of the year (except during winter) over this region, as seen in the lightning climatology derived from the Optical Transient Detector (OTD) and LIS instruments ( of Christian et al., Citation2003). More than 2×10Λ5 CG flashes are associated in annual average (JJA, MAM and SON) to each transatlantic LSP, corresponding to 1.7 (82) ppbv NOy (O3) anomaly.
4.3. Distributions of trace gases
These features could explain the geographical and seasonal distributions of the trace gases described in Section 4.1 for the North Atlantic flight corridor, with a west to east negative (positive) NOy (O3) gradient observed in the UT:
In the entry area over NAM and ATL regions, highest NOy mixing ratios are observed close to LNOx emissions and during the maximum of lightning activity (MAM and JJA), whereas O3 is lower in these regions of freshly uplifted air masses. Indeed over the NAM, LNOx emissions can be lifted into the mid- and UT to the western Atlantic and then transported downwind, as simulated with an LNOx passive tracer in the study of Cooper et al. (Citation2009).
Over EU, many NOy plumes are observed, with lower (higher) NOy (O3) mixing ratios compared to NAM and ATL regions. Only three transatlantic NOy LSPs are observed in DJF when lightning activity is minimal. On the other hand, O3 concentrations are higher in the eastern part of the North Atlantic flight corridor during the most intense lightning activity and photochemistry seasons MAM and JJA (), which may indicate a favoured photochemical production during eastward advection for these seasons. Note that the ozone enhancement is not related to stratospheric influence because of the PV filtering applied. The removal of air masses with recent stratospheric influence is also the reason why there are no data above 50°N in and .
As shown in , NOy and CO decrease during transport through dilution with surrounding air. This observation is illustrated by the decrease of the NOy/CO ratio from 0.016 (0.021) to 0.013 (0.015) ppbv/ppbv in MAM (JJA) during eastward transport, comparable to the study by Schumann et al. (Citation2004) who found the upper tropospheric NOy/CO ratio to decrease from 0.016 to 0.008 ppbv/ppbv in plumes increasing in age from about 1–6 hours to 13–18 hours. The likely reason is the larger enhancement of NOy in the plumes and hence the larger relative gradient to the environment as compared to CO.
It is difficult to quantify the photochemical production of O3 from lightning NOx during transport in the UT because the positive O3 gradient can also be explained by transport of low O3 concentrations from the planetary boundary layer over North America during convection followed by mixing with higher O3 concentrations from the UT during transport towards Europe (cf. Hauf et al., Citation1995; Bertram et al., Citation2007). Further analysis of this aspect requires numerical simulations and is beyond the scope of this paper.
5. Conclusions and perspectives
This study further illustrates the importance of lightning NOx emissions focusing on LSPs of enhanced NOy advected in the UT of the northern middle latitudes.
The analysis of 1685 MOZAIC flights (over the period 2001–2005) of NOy, O3, and CO was conducted together with a characterisation of the convection with the use of ground-based observations of lightning activity and space-borne observations of cloud. A methodology to extract lightning-related LSPs from the MOZAIC database is described. This consists in discarding aircraft exhaust emissions, stratospheric intrusions and pollution from the surface to keep only tropospheric air masses potentially influenced by lightning NOx. This latter source linking convection and lightning activity is then identified using FLEXPART simulations, GOES images and NLDN data. As a result, 1395 enhanced NOy plumes (anomaly above the Q3) attributed to LNOx emissions were identified. Furthermore, a plume horizontal extent threshold of 300 km was used in order to select the exceptional events. This leads to 127 LSPs, almost 6% of the total MOZAIC dataset, which is significant enough to require a detailed analysis. Larger plumes induce higher NOy anomalies (on average 0.5 ppbv higher than the plumes <300 km) and thus have a stronger potential impact on the chemistry downwind. The methodology allows focusing on the LSPs related to lightning emissions only. Although the relatively stringent selection retains a small fraction of the total plumes observed, it largely reduces any remaining ambiguity.
The majority of these plumes are observed in summer (41), autumn (43) and spring (38), over the Atlantic (74% with 2,5 ppbv of NOy on average), Europe (18% with 1,5 ppbv of NOy on average), and over Africa (8% with 1,5 ppbv of NOy on average). This distribution matches the global seasonal variations of NOy in the UT (Thomas et al., Citation2014). Only five LSPs (not detailed here because not statistically significant) are detected in winter, which is the season with the minimum lightning activity in the northern hemisphere.
The main findings of this study based on the entire MOZAIC data base are the following:
74% of the LSPs are observed downwind of the lightning activity occurring over North America, i.e. the transatlantic LSPs, leading to a negative (positive) west to east zonal gradient of NOy (O3) of −0.4 (+18) ppbv in spring, −0.6 (+14) ppbv in summer and −0.3 (+7) ppbv in autumn. Higher NOy values are measured close to emissions and lower values are measured eastward after dilution. As NOy is chemically conservative in the UT after injection through convection, the zonal gradient can be explained by mixing of the plumes with background air. On the contrary, the O3 gradient will be associated with both mixing of background air and photochemical production during transport. The origin of those plumes is attributed to maximum frequency of WCBs and cyclones in the northern hemisphere. The seasonal and regional variability of LSPs distributions is then driven by the seasonal variability of lightning activity and by the typical long range transport pathway between North America and Europe, with vertical transport in the western part of the Atlantic, eastward advection in the Atlantic UT before a possible subsidence over Europe.
18% of the lightning-related LSPs are observed over Europe associated with continental European convection and maritime Mediterranean convection.
8% of the LSPs are observed over Africa, mainly, associated with the continental convective activity of the ITCZ.
Such estimates improve our knowledge on LNOx emissions by filling in information gaps, i.e. NOy distributions influenced by lightning activity. Such estimates are important also for the evaluation of three dimensional simulations of NOy and O3 transported by LSPs. Modelling studies suggest that most of the UT O3 is driven by LNOx emissions directly injected in the UT where there is a larger NOx lifetime with respect to oxidation, leading to a potentially higher O3 production efficiency than in the LT (Jacob et al., Citation1996; Sauvage et al., Citation2007a, Citationb; Cooper et al., Citation2011).
Further modelling studies will investigate the impact of such LSPs over the chemistry of the atmosphere downwind of emissions, and especially over Europe where subsidence can bring such air masses to lower levels of the atmosphere and may end up impacting air quality.
Finally, the present study demonstrates the strength of MOZAIC to provide unique sampling of the atmosphere in data sparse regions. The successor programme IAGOS (http://www.iagos.org), unlike the previous MOZAIC programme, allows the NOx measurement, which is already working on board one aircraft. The NOx measurement will offer the possibility to document more LSPs and quantify more precisely their dependence to the properties of the lightning activity which will be derived from the up-coming geostationary MTG (Meteosat Third Generation) and GOES-R (Geostationary Operational Environmental Satellites) lightning detection missions.
6. Acknowledgements
This work has been funded by INSU-CNRS and DFG in the frame of the bilateral project Integrated analysis of long-range pollution transport to mid- and high-latitudes over Europe using model simulations, satellite observations, and aircraft measurements (INTAS). The authors acknowledge the strong support of the European Commission for the support to the MOZAIC project (1994–2003) and the preparatory phase of IAGOS (2005–2012), Airbus, and the Airlines (Lufthansa, Air-France, Austrian, Air Namibia, Cathay Pacific and China Airlines so far) for carrying the MOZAIC or IAGOS equipment and for performing the maintenance since 1994. MOZAIC is presently funded by INSU-CNRS (France), Météo-France, CNES, Université Paul Sabatier (Toulouse, France) and Research Center Jülich (FZJ, Jülich, Germany). The MOZAIC-IAGOS data are available via http://www.pole-ether.fr thanks to the support ETHER, French data centre service.Geostationary satellite data were provided by Météo France SATMOS data centre. TRMM Microwave Imager (TMI) data were downloaded from the TRMM dataserver. LIS datafiles were retrieved from the NASA LIS dataserver. SSMI observations were downloaded from the GHRC data centre. We are grateful to Dr. Carlo Moralès (Universidade de Sao Paulo) and Dr. Alec Bennett (UK Met Office) for providing ZEUS and ATDnet lightning data during the early stage of the study. We also acknowledge Nick Demetriades for his help with the NLDN data and Jeremy Vouzelaud for his contribution in the early stage of the study. Finally, we would like to thank the Anonymous Reviewers for their careful reading of the manuscript and their constructive suggestions.
References
- Allen D. J. , Pickering K. E. , Stenchikov G. L. , Thompson A. M. , Kondo Y . A 3-D NOy simulation during SONEX using a stretched-grid chemical transport model. J. Geophys. Res. 2000; 105: 3851–3876.
- Bertram T. H. , Heckel A. , Richter A. , Burrows J. P. , Cohen R. C . Satellite measurements of daily variations in soil NOx emissions. Geophys. Res. Lett. 2005; 32(24): L24812.
- Bertram T. H. , Perring A. E. , Wooldridge P. J. , Crounse J. D. , Kwan A. J. , co-authors . Direct measurements of the convective recycling of the upper troposphere. Science. 2007; 315: 816–820.
- Brioude J. , Cammas J.-P. , Cooper O. R . Stratosphere-troposphere exchange in a summertime extratropical low: analysis. Atmos. Chem. Phys. 2006; 6: 2337–2353.
- Brioude J. , Cammas J.-P. , Cooper O. R. , Nédélec P . Characterization of the composition, structure, and seasonal variation of the mixing layer above the extratropical tropopause as revealed by MOZAIC measurements. J. Geophys. Res. 2008; 113: D00B01.
- Brunner D. , Staehelin J. , Jeker D . Large-scale nitrogen oxide plumes in the tropopause region and implications for ozone. Science. 1998; 282: 1305–1309.
- Cecil D. J . Passive microwave brightness temperature as proxies for hailstorms. J. Appl. Meteor. Clim. 2009; 50: 233–240.
- Christian H. J. , Blakeslee R. J. , Boccippio D. J. , Boeck W. L. , Buechler D. E. , co-authors . Global frequency and distribution of lightning as observed from space by the Optical Transient Detector. J. Geophys. Res. 2003; 108(D1): 4005.
- Cooper M. , Martin R. V. , Sauvage B. , Boone C. D. , Walker K. A. , co-authors . Evaluation of ACE-FTS and OSIRIS Satellite retrievals of ozone and nitric acid in the tropical upper troposphere: application to ozone production efficiency. J. Geophys. Res. 2011; 116: D12306.
- Cooper O. R. , Eckhardt S. , Crawford J. H. , Brown C. C. , Cohen R. C. , co-authors . Summertime buildup and decay of lightning NOx and aged thunderstorm outflow above North America. J. Geophys. Res. 2009; 114: D01101.
- Cooper O. R. , Stohl A. , Trainer M. , Thompson A. M. , Witte J. C. , co-authors . Large upper tropospheric ozone enhancements above midlatitude North America during summer: in situ evidence from the IONS and MOZAIC ozone measurement network. J. Geophys. Res. 2006; 111: D24S05.
- Crutzen P. J . A discussion of the chemistry of some minor constituents in the stratosphere and troposphere. Pure Appl. Geophys. 1973; 106–108: 1385–1399.
- Cummins K. L. , Murphy M. J . An overview of lightning locating systems: history, techniques, and data uses, with an in-depth look at the US NLDN. IEEE Trans. Elec. Compa. 2009; 51: 499–518.
- DeCaria A. J. , Pickering K. E. , Stenchikov G. L. , Scala J. R. , Stith J. L. , co-authors . A cloud-scale model study of lightning-generated NOx in an individual thunderstorm during STERAO-A. J. Geophys. Res. 2000; 105(D9): 11601–11616.
- Defer E. , Lagouvardos K. , Kotroni V . Lightning activity in the eastern Mediterranean region. J. Geophys. Res. 2005; 110(D24): D24210.
- De Rooy W. C. , Bechtold P. , Fröhlich K. , Hohenegger C. , Jonker H. , co-authors . Entrainment and detrainment in cumulus convection: an overview. Q. J. R. Meterorol. Soc. 2013; 139(670): 1–19.
- Dye J. E. , Ridley B. A. , Skamarock W. , Barth M. , Venticinque M. , co-authors . An overview of the Stratospheric-Tropospheric Experiment: Radiation, Aerosols, and Ozone (STERAO)-Deep Convection experiment with results for the July 10, 1996 storm. J. Geophys. Res. 2000; 105(D8): 10023–10045.
- Emanuel K. A. , Zivkovic-Rothman M . Development and evaluation of a convection scheme for use in climate models. J. Atmos. Sci. 1999; 56: 1766–1782.
- Emmons L. K. , Carroll M. A. , Hauglustaine D. A. , Brasseur G. P. , Atherton C. , co-authors . Climatologies of NOx and NOy: a comparison of data and models. Atmos. Environ. 1997; 31: 1851–1904.
- Eckhardt S. , Stohl A. , Wernli H. , James P. , Forster C. , co-authors . A 15-year climatology of warm conveyor belts. J. Clim. 2004; 17: 218–237.
- Folkins I. , Bernath P. , Boone C. , Donner L. J. , Eldering A. , co-authors . Testing convective parameterizations with tropical measurements of HNO3, CO, H2O, and O-3: implications for the water vapor budget. J. Geophys. Res. 2006; 111(D23): L16802.
- Grewe V . Impact of climate variability on tropospheric ozone. Sci. Total. Environ. 2007; 374: 167–181.
- Hauf T. , Schulte P. , Alheit R. , Schlager H . Rapid vertical trace gas-transport by an isolated midlatitude thunderstorm. J. Geophys. Res. Atmos. 1995; 100(D11): 22957–22970.
- Hauglustaine D. , Emmons L. , Newchurch M. , Brasseur G. , Takao T. , co-authors . On the role of lightning NOx in the formation tropospheric ozone plumes: a global model perspective. J. Atmos. Chem. 2001; 38: 277–294.
- Helten M. , Smit H. G. J. , Strater W. , Kley D. , Nédélec P. , co-authors . Calibration and performance of automatic compact instrumentation for the measurement of relative humidity from passenger aircraft. J. Geophys. Chem. 1998; 103(D19): 25643–25652.
- Hoor P. , Fischer H. , Lange L. , Lelieveld J. , Brunner D . Seasonal variations of a mixing layer in the lowermost stratosphere as identified by the CO-O3 correlation from in situ measurements. J. Geophys. Chem. 2002; 107: 5–6.
- Hoskins B. J. , Mc Intyre M. E. , Robertson A. W . On the use and significance of isentropic potential vorticity maps. Q. J. Roy Meterol. Soc. 1985; 111: 470. 877.
- Hudman R. C. , Jacob D. J. , Turquety S. , Leibensperger E. M. , Murray L. T. , co-authors . Surface and lightning sources of nitrogen oxides over the United States: magnitudes, chemical evolution, and outflow. J. Geophys. Res. 2007; 112: D12S05.
- Huntrieser H. , Schlager H. , Lichtenstern M. , Roiger A. , Stock P. , co-authors . NOx production by lightning in Hector: first airborne measurements during SCOUT-O3/ACTIVE. Atmos. Chem. Phys. 2009; 9: 8377–8412.
- Huntrieser H. , Schumann U. , Schlager H. , Höller H. , Giez A. , co-authors . Lightning activity in Brazilian thunderstorms during TROCCINOX: implications for NOx production. Atmos. Chem. Phys. 2008; 8: 921–953.
- Jacob D. J. , Heikes B. G. , Fan S. M. , Logan J. A. , Mauzerall D. L. , co-authors . Origin of ozone and NOx in the tropical troposphere: a photochemical analysis of aircraft observations over the South Atlantic basin. J. Geophys. Res. 1996; 101(D19): 24235–24250.
- Jeker D. P. , Pfister L. , Thompson A. M. , Brunner D. , Boccippio D. J. , co-authors . Measurements of nitrogen oxides at the tropopause: attribution to convection and correlation with lightning. J. Geophys. Res. 2000; 105: 3679–3700.
- Keim C. , Liu G. Y. , Blom C. E. , Fischer H. , Gulde T. , co-authors . Vertical profile of peroxyacetyl nitrate (PAN) from MIPAS-STR measurements over Brazil in February 2005 and its contribution to tropical UT NOy partitioning. Atmos. Chem. Phys. 2008; 8: 4891–4902.
- Koike M. , Kondo Y. , Kita K. , Nishi N. , Liu S. C. , co-authors . Reactive nitrogen over the tropical western Pacific: influence from lightning and biomass burning during BIBLE A. J. Geophys. Res. 2003; 108: 8403.
- Kraabol A. G. , Berntsen T. K. , Sundet J. K. , Stordal F . Impacts of NOx emissions from subsonic aircraft in a global three-dimensional chemistry transport model including plume processes. J. Geophys. Res. 2002; 107(D22): 4655.
- Labrador L. , Vaughan G. , Heyes W. , Waddicor D. , Volz-Thomas A. , co-authors . Lightning-produced NOx during the Northern Australian monsoon; results from the ACTIVE campaign. Atmos. Chem. Phys. 2009; 9: 7419–7429.
- Lange L. , Hoor P. , Helas G. , Fischer H. , Brunner D. , co-authors . Detection of lightning-produced NO in the midlatitude upper troposphere during STREAM 1998. J. Geophys. Res. 2001; 106: 27777–27785.
- Liu C. , Cecil D. , Zipser E. J . Relationships between flash rates and passive microwave brightness temperatures at 85 and 37 GHz over the tropics and subtropics. J. Geophys. Res. 2011; 116: D23108.
- Liu S. C. , Kley D. , McFarland M. , Mahlman J. D. , Levy H . On the origin of tropospheric ozone. J. Geophys. Res. 1980; 85: 7546–7552.
- Liu S. C. , Yu H. , Wang Y. , Davis D. D. , Kondo Y. , co-authors . Sources of reactive nitrogen in the upper troposphere during SONEX. Geophys. Res. Lett. 1999; 26: 2441–2444.
- Marenco A. , Thouret V. , Nédélec P. , Smit H. , Helten M. , co-authors . Measurement of ozone and water vapour by Airbus in-service aircraft: the MOZAIC airborne program, an overview. J. Geophys. Res. 1998; 103(D19): 25631–25642.
- Martin R. V. , Sauvage B. , Folkins I. , Sioris C. E. , Boone C. , co-authors . Space-based constraints on the production of nitric oxide by lightning. J. Geophys. Res. 2007; 112: D09309.
- Martin R. V. , Sioris C. E. , Chance K. , Ryerson T. B. , Bertram T. H. , co-authors . Evaluation of space-based constraints on global nitrogen oxide emissions with regional aircraft measurements over and downwind of eastern North America. J. Geophys. Res. 2006; 111(D15): D15308.
- Mickley L. J. , Jacob D. J. , Field B. D. , Rind D . Climate response to the increase in tropospheric ozone since preindustrial times: a comparison between ozone and equivalent CO2 forcings. J. Geophys. Res. 2004; 109: D05106.
- Nédélec P. , Cammas J. P. , Thouret V. , Athier G. , Cousin J.-M. , co-authors . An improved infrared carbon monoxide analyser for routine measurements aboard commercial Airbus aircraft: technical validation and first scientific results of the MOZAIC III programme. Atmos. Chem. Phys. 2003; 3: 1551–1564.
- Neuman J. A. , Gao R. S. , Fahey D. W. , Holecek J. C. , Ridley B. A. , co-authors . In situ measurements of HNO3, NOy, NO, and O3 in the lower stratosphere and upper troposphere. Atmos. Environ. 2001; 35: 5789–5797.
- Olivier J. G. J. , Berdowski J. J. M . Berdowski J. , Guicherit R. , Heij B. J . Global emissions sources and sinks. The Climate System. 2001; Lisse, The Netherlands: A. A. Balkema Publishers. 33–78.
- Ott L. E. , Pickering K. E. , Stenchikov G. L. , Huntrieser H. , Schumann U . Effects of lightning NOx production during the 21 July European Lightning Nitrogen Oxides Project storm studied with a three-dimensional cloud-scale chemical transport model. J. Geophys. Res. 2007; 112(D5): D05307.
- Pätz H.-W. , Volz-Thomas A. , Hegglin M. I. , Brunner D. , Fischer H. , co-authors . In-situ comparison of the NOy instruments flown in MOZAIC and SPURT. Atmos. Chem. Phys. 2006; 6: 2401–2410.
- Pickering K. E. , Thompson A. M. , Dickerson R. R. , Luke W. T. , McNamara D. P. , co-authors . Model calculations of tropospheric ozone production potential following observed convective events. J. Geophys. Res. 1990; 95: 14049–14062.
- Pickering K. E. , Thompson A. M. , Scala J. R. , Tao W.-K. , Dickerson R. R. , co-authors . Free tropospheric ozone production following entrainment of urban plumes into deep convection. J. Geophys. Res. 1992b; 97: 17985–18000.
- Pickering K. E. , Thompson A. M. , Scala J. R. , Tao W.-K. , Simpson J . Ozone production potential following convective redistribution of biomass burning emissions. J. Atmos. Chem. 1992a; 14: 297–313.
- Pickering K. E. , Thompson A. M. , Wang Y. , Tao W.-K. , McNamara D. P. , co-authors . Convective transport of biomass burning emissions over Brazil during TRACE-A. J. Geophys. Res. 1996; 101: 23993–24012.
- Real E. , Law K. S. , Schlager H. , Roiger A. , Huntrieser H. , co-authors . Lagrangian analysis of low altitude anthropogenic plume processing across the North Atlantic. Atmos. Chem. Phys. 2008; 8: 7737–7754.
- Sauvage B. , Martin R. V. , van Donkelaar A. , Liu X . Quantification of the factors controlling tropical tropospheric ozone and the South Atlantic maximum. J. Geophys. Res. 2007a; 112: D11309.
- Sauvage B. , Martin R. V. , van Donkelaar A. , Liu X. , Chance K. , co-authors . Remote sensed and in situ constraints on processes affecting tropical tropospheric ozone. Atmos. Chem. Phys. 2007b; 7: 815–838.
- Schumann U . The impact of nitrogen oxides emissions from aircraft upon the atmosphere at flight altitudes – results from the AERONOX project. Atmos. Environ. 1997; 31: 1723–1733.
- Schumann U. , Baehr J. , Schlager H . Ozone and ozone precursors influenced by tropical convection over South America. Proceedings Quadriennial Ozone Symposium. 2004; Greece: Kos. 283–284.
- Schumann U. , Huntrieser H . The global lightning-induced nitrogen oxides source. Atmos. Chem. Phys. 2007; 7: 3823–3907.
- Singh H. B. , Brune W. H. , Crawford J. H. , Jacob D. J. , Russel P. B . Overview of the summer 2004 Intercontinental Chemical Transport Experiment-North America (INTEX- A). J. Geophys. Res. 2006; 111: D24S01.
- Singh H. B. , Thompson A. M. , Schlager H . The 1997 SONEX aircraft campaign and coordinated POLINAT-2 activity: overview and accomplishments. Geopys. Res. Lett. 1999; 26: 3053–3056.
- Singh H. B. , Salas L. , Herlth D. , Kolyer R. , Czech E. , co-authors . Reactive nitrogen distribution and partitioning in the North American troposphere and lowermost stratosphere. J. Geophys. Res. 2007; 112: D12S04.
- Sioris C. E. , McLinden C. A. , Martin R. V. , Sauvage B. , Haley C. S. , co-authors . Vertical profiles of lightning-produced NO2 enhancements in the upper troposphere observed by OSIRIS. Atmos. Chem. Phys. 2007; 7: 4281–4294.
- Skamarock W. C. , Dye J. E. , Defer E. , Barth M. C. , Stith J. L. , co-authors . Observational- and modeling-based budget of lightning-produced NOx in a continental thunderstorm. J. Geophys. Res. 2003; 108(D10): 4305.
- Smit H. G. J. , Volz-Thomas A. , Helten M. , Paetz W. , Kley D . An in-flight calibration method for near-real-time humidity measurements with the airborne MOZAIC sensor. J. Atmos. Ocean. Tech. 2008; 25: 656–666.
- Stohl A. , Eckhardt S. , Forster C. , James P. , Spichtinger N. , co-authors . A replacement for simple back trajectory calculations in the interpretation of atmospheric trace substance measurements. Atmos. Environ. 2002; 36: 4635–4648. ISSN 1352–2310.
- Stohl A. , Forster C. , Eckhardt S. , Spichtinger N. , Huntrieser H. , co-authors . A backward modeling study of intercontinental pollution transport using aircraft measurements. J. Geophys. Res. 2003; 108(D12): 4370.
- Stohl A. , Forster C. , Frank A. , Seibert P. , Wotawa G . Technical note: the Lagrangian particle dispersion model FLEXPART version 6.2. Atmos. Chem. Phys. 2005; 5: 2461–2474.
- Stohl A. , Thomson D. J . A density correction for Lagrangian particle dispersion models. Boundary Layer Meteorol. 1999; 90: 155–167.
- Talbot R. W. , Dibb J. E. , Scheuer E. M. , Kondo Y. , Koike M. , co-authors . Reactive nitrogen budget during the NASA SONEX mission. Geophys. Res. Lett. 1999; 26: 3057–3060.
- Thakur A. N. , Singh H. B. , Mariani P. , Chen Y. , Wang Y. , co-authors . Distribution of reactive nitrogen species in the remote free troposphere: data and model comparisons. Atmos. Environ. 1999; 33: 1403–1422.
- Thomas K. , co-authors . Climatology of NOy in the troposphere and UTLS from measurements made in MOZAIC, MOZAIC-IAGOS 20th Anniversary Symposium Special Issue. Tellus B. 2014
- Thompson A. M . The oxidizing capacity of the Earth's atmosphere: probable past and future gradients. Science. 1992; 256: 1157–1165.
- Thompson A. M. , Singh H. B. , Schlager H . Introduction to special section: SONEX (Subsonic Assessment Ozone and Nitrogen Oxides Experiment) and POLINAT (Pollution in North Atlantic Tracks). J. Geophys. Res. 2000; 105: 3595–3603.
- Thompson A. M. , Sparling L. C. , Kondo Y. , Anderson B. E. , Gregory G. L. , co-authors . Perspectives on NO, NOy and fine aerosol sources and variability during SONEX. Geophys. Res. Lett. 1999; 26: 3073–3076.
- Thouret V. , Cammas J.-P. , Sauvage B. , Athier G. , Zbinden R. , co-authors . Tropopause referenced ozone climatology and inter-annual variability (1994–2003) from the MOZAIC programme. Atmos. Chem. Phys. 2006; 6: 1033–1051.
- Thouret V. , Marenco A. , Logan J. A. , Nédélec P. , Grouhel C . Comparisons of ozone measurements from the MOZAIC airborne program and the ozone sounding network at eight locations. J. Geophys. Res. 1998; 103(D19): 25695–25720.
- Volz-Thomas A. , Berg M. , Heil T. , Houben N. , Lerner A. , co-authors . Measurements of total odd nitrogen (NOy) aboard MOZAIC in-service aircraft: instrument design, operation and performance. Atmos. Chem. Phys. 2005; 5: 583–595.
- Wang Y. , Liu S. C. , Anderson B. E. , Kondo Y. , Gregory G. L. , co-authors . Evidence of convection as a dominant source of condensation nuclei in the northern midlatitude upper troposphere. Geophys. Res. Lett. 2000; 27: 369–372.
- Wespes C. , Hurtmans D. , Clerbaux C. , Santee M. L. , Martin R. V. , co-authors . Global distributions of nitric acid from IASI/MetOP measurements. Atmos. Chem. Phys. 2009; 9: 7949–7962.
- Worden H. M. , Deeter M. N. , Edwards D. P. , Gille J. C. , Drummond J. R. , co-authors . Observations of near-surface carbon monoxide from space using MOPITT multispectral retrievals. J. Geophys. Res. 2010; 115: D18314.
- Ziereis H. , Schlager H. , Schulte P. , van Velthoven P. F. J. , Slemr F . Distributions of NO, NOx, and NOy in the upper troposphere and lower stratosphere between 28 degrees and 61 degrees N during POLINAT 2. J. Geophys. Res. 2000; 105(D3): 3653–3664.