
Abstract
The observed variability of shortwave (SW) irradiance, clouds and temperature and the potential connections between them is studied for the subarctic site Bergen (60.4°N, 5.3°E), located on the Norwegian west coast. Focusing on the quality and spatial representativity of the data, we compare observations from independent instruments and neighbouring measurement sites. The observations indicate that the decrease of sunshine duration and SW irradiance during the 1970s and 80s in Bergen is associated with the increasing frequency of clouds, in particular clouds of low base heights. We argue that the observed cloud changes are indicative of increased frequencies of storms in northern Europe. The annual mean observational time series show an increase in SW irradiance since 1990, which is not accompanied by a cloud cover (NN) decrease. This implies the influence of factors other than clouds, for example, decreasing aerosol emissions. Calculations of the aerosol optical depth (AOD) based on irradiance observations for hours when the sun is unobscured by clouds confirm a decreasing aerosol load after 1990, from 0.15 to 0.10 AOD which corresponds to 2–6 Wm−2 of brightening. At the same time, a seasonal analysis reveals opposite changes in SW irradiance and NN during the months of strongest changes – March, April and August – also during the recent period of increasing SW irradiance. We conclude that the seasonally decreasing NN also contributes to the recent changes in SW irradiance. Finally, we address the relationship between temperature, SW irradiance and clouds. In winter (December–February), the surface air temperature in Bergen is statistically linked to the warming influence of clouds. In all other seasons, the North Atlantic sea surface temperature variability has a more dominant influence on the air temperature in Bergen compared to local cloud and SW irradiance variability.
1. Introduction
Observational studies have revealed a notable shortwave (SW) variability on decadal to multidecadal time scales: a wide spread decrease of SW irradiance measured at the Earth's surface from the 1950s to the 1980s, followed by a trend reversal and positive SW irradiance trends from the early 1990s to the present day in many regions, including northern Europe (Stanhill and Cohen, Citation2001; Liepert, Citation2002; Wild et al., Citation2005; Gilgen et al., Citation2009; Liley, Citation2009; Russak, Citation2009). These decadal SW irradiance trends are known as dimming and brightening.
Because the observed SW irradiance variations at the surface of the Earth are larger than the fluctuations of corresponding measurements at the top of the atmosphere (Fröhlich, Citation2009), changes in solar output cannot explain the observed dimming and brightening. Instead, the observed SW trends should be due to variations within the atmosphere. Previous studies have attributed SW irradiance trends to changes in aerosols and clouds (e.g. Norris and Wild, Citation2007; Wild, Citation2009b). The relative importance varies depending on the meteorological conditions as well as local and long-range sources of aerosols (Wild, Citation2012). A detailed and local perspective can therefore be more useful than the broad and continental or worldwide when investigating the causes and implications of global dimming and brightening.
In this study, we focus on dimming and brightening in Bergen (60.4°N, 5.3°E), a subarctic site on the west coast of Norway. Stjern et al. (Citation2009) found opposing trends in cloud cover (NN) and SW irradiance in Bergen for all months, implying that clouds have had a dominant influence on the SW radiative climate at the site. The observed cloud changes in Bergen are likely related to large-scale circulation (North Atlantic Oscillation, North-Sea Caspian Pattern), which have been found to have a strong influence on the climate in northern Europe (Chiacchio and Wild, Citation2010).
The purpose of this study is to evaluate the plausibility of cloud changes as a cause of the observed SW irradiance trends in Bergen and its implications for the observed variability of surface temperatures. There is a wealth of observational data from Bergen that have not been studied in the context of long-term trends of solar irradiance and clouds. We investigate the changing cloud situation from 1957 to 2013, verifying the cloud trends and investigating the spatial representativity by comparing data from two neighbouring observational sites in Bergen. The solar climate is evaluated based on complementary measures of solar irradiance: global, diffuse and direct irradiance, sunshine duration and their normalised counterparts. The cloud and solar changes are investigated on a seasonal basis, and it is evident that there are seasonal variations of dimming and brightening in Bergen. To evaluate the contribution of aerosol changes to the recent solar brightening, we estimate the aerosol optical depth (AOD) from clear-sky irradiance observations. Finally, we assess the impact of clouds and SW irradiance on surface temperature variability.
2. Site description
Bergen is situated on the west coast of Norway in a north–south oriented valley, approximately 15 km long and 300–600 m deep (Hanssen-Bauer, Citation1985). The climate is maritime and temperate, with monthly mean temperatures ranging from 1.5°C in January and 14.5°C in July and on average 202 precipitation days (>1 mm) per year, among the highest precipitation rates in Europe. (The climatological values are based on observations during the reference period 1961–1990 and are available from the NOAA world weather website www.worldweather.wmo.int.) Cloud formation and precipitation is promoted by orographic lifting of the air along the mountains surrounding the city. The meteorological conditions in Bergen are also strongly influenced by synoptic weather patterns and storms associated with the North Atlantic storm track. We will report on this subject in a separate paper.
We use observations from three meteorological stations in Bergen: Florida, which is the weather stations on the roof top of the Geophysical Institute at the University of Bergen, located in the city centre, Fredriksberg which is located 2 km north west of the Florida site, also in the city, and Flesland, a measurement station at the airport approximately 20 km south west of the city, outside of the Bergen valley. The topography around Flesland is, in contrast to the sites in the city, almost flat with a view towards the Atlantic Ocean to the west and the mountainous inland to the east. The difference in surrounding topography at Flesland and Florida influences both the meteorological and observational conditions at the sites. Surface based measurements of solar radiation are available from Florida, cloud observations from both Florida and Flesland, and temperature measurements from Florida, Flesland and Fredriksberg.
3. Data
3.1. Solar radiation data
Solar measurements have been conducted at the Florida site in Bergen for more than 60 yr. Since 1952, the sunshine duration has been measured by a Campbell-Stokes sunshine recorder, an instrument consisting of a glass sphere that focuses the incoming solar radiation on to a paper strip (Stanhill, Citation2003). The beam burns the paper strip when the direct SW irradiance exceeds a threshold (205±35 Wm−2).
In 1965, two instruments were installed at the Florida station, an Eppley precision spectral pyranometers (PSP) to measure the global irradiance and a Kipp&Zonen (Gorzinsky solarimeter) with a circular disc mounted on a rotating arm shadowing direct irradiance to measure the diffuse irradiance. The instruments were replaced in 1982 by Eppley PSP instruments, and again in 1995 by Kipp&Zonen CM11 pyranometers. The global and diffuse irradiance instruments have undergone yearly calibrations by means of the absolute self-calibrating cavity pyrheliometer, EPAC 13617, to ensure the consistency of the measurements. The calibration procedure is described in Reda et al., (Citation2003). The EPAC 13617 was compared to the World Radiation Reference Scale (WRR) during the IV, V, VI, VII and XI International Pyrheliometer Comparisons at the World Radiation Centre in Davos (Finsterle, Citation2011) and has been extremely stable from 1975 to 2010, varying within a range of less than ±0.1%.
Since 1990, direct normal SW irradiance observations by Eppley normal incidence pyrheliometers (NIP) have been conducted at Florida, the instrument being replaced in 1992 and 1995. The direct irradiance instrument has been routinely calibrated yearly with the EPAC 13617 pyrheliometer as discussed above, ensuring measurement consistency and quality.
3.1.1. Uncertainty of solar radiation observations
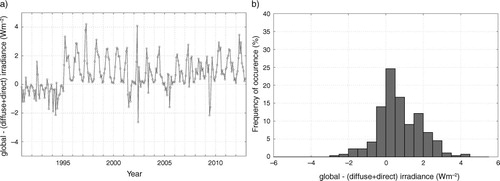
To estimate the uncertainty of the SW irradiance measurements, we study the global, diffuse and direct irradiance during the period 1991–2013 for which all three observational parameters are available. The measured global irradiance should be equal to the sum of the diffuse and direct irradiance at all times; large instantaneous or systematic differences indicate that one or more of the measurements are erroneous. The root-mean-square difference (RMSD) between the global and direct+diffuse irradiance is used as an estimate of the uncertainty of the SW irradiance measurements and the relative uncertainty is estimated by dividing the RMSD by the average observed global irradiance for the period 1991–2013 [similar to the uncertainty evaluation of Gilgen et al. (Citation1998)].
The RMSD between the global and diffuse+direct irradiance is 3.1 Wm−2, 1.5 Wm−2 and 1.0 Wm−2 for the daily, monthly and annually averaged time series, respectively. This corresponds to a relative uncertainty of approximately 3.5% (daily), 1.6% (monthly), and 1.1% (annual). For the seasonally averaged time series, the RMSD is higher in spring (2.1 Wm−2) and summer (1.4 Wm−2) when the SW irradiance is strong, compared to the less sunny seasons, autumn (0.6 Wm−2) and winter (0.5 Wm−2). The relative uncertainty is higher in winter (3.1%) than in autumn (1.3%), spring (1.6%), and summer (0.9%).
The uncertainty reduction from daily to monthly and monthly to annually averaged time series is smaller than expected based on basic rules of error propagation, assuming only random errors. For example, based on a daily uncertainty of 2.5 Wm−2, the expected uncertainty of the monthly time series is 0.5 Wm−2 (assuming a 30 d long month and equal uncertainty for all days, ). The smaller uncertainty reduction found in Bergen is caused by a bias: the global irradiance measurements systematically exceed the diffuse+direct irradiance (). The maximum difference between the monthly averaged global and diffuse+direct irradiance is 4.2 Wm−2, observed in May 1997, and the average is approximately 1 Wm−2. The bias indicates that either the global irradiance is systematically overestimated or the diffuse and/or direct irradiance are underestimated. The difference grows larger and has a more pronounced seasonal cycle after 1994 (a). This is likely related to the shift of the SW irradiance instruments in 1995 (see instrument history in Section 3). Since all instruments were exchanged (global, diffuse and direct normal irradiance) and we cannot tell which of the instruments are at fault, we cannot correct the SW irradiance observations, but we keep the 1994/1995 bias increase in mind when studying SW irradiance trends in recent decades. Compared to measurement uncertainties reported at many other stations, which can be up to 5% for the monthly averaged time series (Gilgen et al., Citation1998), the uncertainties of the SW irradiance data from Bergen are small.
Fig. 1 Difference between the monthly averaged global irradiance and the sum of diffuse and direct irradiance, measured at the Florida site in Bergen, Norway, from 1991 to 2013, shown as a time series (left panel) and a histogram (right panel).
3.2. Cloud observations
Visual observations of clouds have been made every three hours since 1955 at Flesland and 1957 at Florida, but only the 6-hourly daytime observations (6, 12 and 18 UTC=7, 13, 19 standard local time) have been transferred to digital format for both stations and for the full periods of available data. For consistency, we use only the 6, 12 and 18 UTC data even in periods when additional observations are available. The cloud observations are freely available via the Norwegian Meteorological Institute's weather and climate data website Eklima (www.eklima.no).
The cloud data are reported according to Word Meteorological Organization (WMO) standards for weather observations (World Meteorological Organization, Citation2008). The observed cloud parameters used in this study are the NN and the cloud base height (HL). Based on the NN and HL observations, we calculate the frequency of occurrence of cloud free or almost cloud free conditions (NN<2 oktas) and of low clouds with a HL below 1000 m. The NN is reported in oktas (eighths of the sky that are covered by clouds). The HL is reported in meters according to a fixed scale that is finer at lower levels (0, 50, 100, 200, 300, 600, 1000, 1500, 2000 and 2500 m). The reported cloud base value is the lower limit of an interval; 0 m means that the cloud base is lower than 50 m and 2500 m refers to clouds with a base height of 2.5 km or higher.
3.2.1. Spatial representativity and uncertainty of cloud observations
Cloud observations are associated with large uncertainties because they are made by human observers. Spurious trends and shifts may occur as a result of new observers or changes in the observational routines. To evaluate the quality of the cloud observations, we compare data from Flesland and Florida. Since the sites are located 20 km apart, differences are not necessarily indicative of erroneous observations, but can be a result of actual or perceived differences of the cloud field. However, cloud features that are found at both observational sites can be assumed to be not only real but also spatially representative of the larger Bergen region.
The correlation between the NN observed at Flesland and Florida is high, indicating that the variability of the observed NN is representative of the larger Bergen region. For the hourly, daily, monthly and annually averaged observations, the Pearson's correlation (R) between NN at Flesland and Florida is 0.91, 0.95, 0.97, and, 0.96, respectively. Comparisons of the seasonally averaged NN at the two sites produce values of R between 0.95 and 0.98. (All correlation coefficients discussed here are statistically significant at the 95%-level, estimated by student's t-test). Nevertheless, there are some notable differences between the NN observed at the two stations. First of all, clear-sky (0 oktas) and overcast (8 oktas) observations are more common at Florida than Flesland, while reports of almost clear and overcast (1 and 7 oktas) conditions are more common at Flesland (a). Similar differences in NN distribution occur in all seasons (not shown here). Secondly, the average observed NN is approximately 0.1 oktas, or in relative terms 2% higher at the Florida station and then at Flesland. The NN difference between Flesland and Florida is statistically significant at the 95%-level, based on a two-tailed t-test of the mean value difference of two distributions. Similar statistically significant NN differences are found in summer, spring and autumn, but not winter (not shown here).
Fig. 2 Comparison of the distribution of (a) cloud cover and (b) cloud base observations at the Florida and Flesland stations in Bergen, Norway. The observational stations are presented in Section 2 and the cloud data are discussed in Section 3.2.
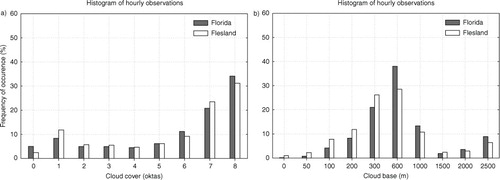
The cloud base observations from Flesland and Florida are also highly correlated: R=0.71, 0.82, 0.90, and 0.86, for the hourly, daily, monthly, and annually averaged time series, respectively. For the seasonally averaged cloud base time series, the correlation varies from 0.83 to 0.92 (All statistically significant at the 95%-level.) However, the average cloud base observed at Flesland is around 115 m lower than at Florida. The difference can be seen in the cloud base distributions in b, where clouds with a base height of 600 m and above occur more often at Florida than Flesland and vice versa for HLs below 600 m.
The observed cloud differences described above may be related to the site topography. Mountains influence the weather conditions by promoting cloud formation as the air is forced to follow the terrain. The orographic lift may explain the higher average NN observed at Florida compared to Flesland. The relatively low frequency of clouds with a base height lower than 600 m at Florida compared to Flesland may also be connected to the surroundings, possibly the concrete surfaces of the city which seals moisture more effectively than the grass plains around the airport. The topography can also influence the perceived cloud situation. At the Florida station, the surrounding mountains block the view to the east and west. This may explain the higher frequency of clear sky and overcast observations at Florida compared to Flesland because only the portion of the sky seen by the observer has to be totally free from (or covered by) clouds to be perceived as clear (overcast). In the flatter landscape surrounding Flesland, the observers have a less restricted view of the sky and are more likely to spot a distant cloud (or opening in the cloud field) during an otherwise clear (overcast) situation.
3.3. Temperature observations
Measurements of the air temperature are available at Florida from 1957 to 2013, at Flesland from 1955 to 2014, and at Fredriksberg from 1904 to 1984. Although hourly measurements have been made, only the 6-hourly daytime observations are available for all three stations in all periods. For consistency, we use only the 6, 12 and 18 UTC observations from all stations, even when 1-hourly observations are available.
In Section 6, we also look into the connection between air and sea surface temperature (SST). For this purpose, we use the area weighted average SST (Kaplan et al., Citation1998) over the North Atlantic ocean from 0 to 70°N (not smoothed or detrended) which has been used in many previous studies of natural and anthropogenic SST variability (Enfield, Citation2001).
3.3.1. Uncertainty of temperature observations
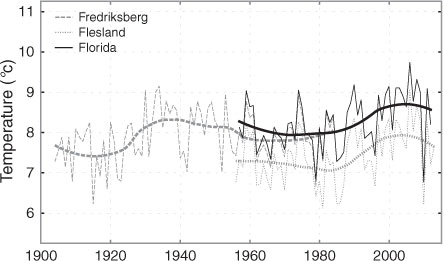
The correlation between the observed temperature at Flesland and Florida is high (R=0.97 for the annual mean time series) and a strong temperature increase is seen at both sites during the 1980s and 90s (). Nevertheless, the temperature at Flesland is consistently lower than the corresponding temperature at Florida (), possibly due to an urban heat island effect since Florida is located in Bergen city while Flesland is in a more rural setting. The Florida and Fredriksberg sites are located only 2 km apart, both in the centre of Bergen, and as expected, the temperature records from these two sites also agree well during the period of overlapping measurements (1957–1984) with a high correlation (R=0.99 for the annual mean time series) and a small bias (0.15°C warmer at Florida than at Fredriksberg on average). Based on the overlapping temperature records at Florida and Fredriksberg, the relative uncertainty (RMSD divided by the average) of the temperature records is estimated to be 4.4, 2.5, and 2.2% for the daily, monthly and annually averaged time series. The similarities among the temperature records show that the observed temperature trends are real and not merely measurement artefacts. To obtain a temperature time series of maximum length, we combine the temperature records from Florida (1957–2012) with the Fredriksberg measurements which extend further back in time (1904–1984), using the average temperature at the two sites during the overlapping period.
Fig. 3 Time series of temperature measured at the Florida (solid line), Flesland (dotted line) and Fredriksberg (dashed line) sites in Bergen. The thinner lines show the annual mean time series while the thicker lines are smoothed time series of the observational time series (shown only for the Florida site).
4. Methodology
4.1. Normalising solar observations
The sunshine duration is normalised by dividing the observed daily hours of bright sunshine by the theoretical maximum, that is, the number of hours that the sun is above the natural horizon. The normalised quantity is called the relative sunshine duration and is reported in units of %. The hourly global irradiance is normalised by calculating the atmospheric transmittance, that is, the global irradiance measured at the surface of the Earth divided by the concurrent SW irradiance at the top of the atmosphere. The SW irradiance at the top of the atmosphere is calculated based on the sun–earth distance and angle, with the time and location of the observational site as input (Iqbal, Citation1983). The atmospheric transmittance has a theoretical range from 0 (completely opaque atmosphere) to 1 (completely transparent atmosphere). Although the normalised solar quantities have a reduced seasonal cycle, seasonal variations of the atmospheric path length of the solar radiation are not fully accounted for by the normalisation procedures.
4.2. Daily, monthly and annually averaged time series
To reduce diurnal and seasonal cycles in the observations, the data are averaged over time. The cloud observations are averaged on a daily basis using the 6-hourly observations from 6, 12, and 18 UTC. Days missing one or more of these observations are excluded from the daily time series. Daily averages of global irradiance are similarly calculated using all hourly values and excluding any day with one or more missing observations. The atmospheric transmittance (normalised global irradiance), which is a measure of the transparency of the atmosphere to SW irradiance, has no meaningful values in the absence of direct sunlight. Daily averages of the atmospheric transmittance are therefore calculated using only hours when the Sun is above the natural horizon, which because of the surrounding mountains we estimate as sun heights above 10 degrees. Monthly averages are calculated based on the daily time series. Months with less than 10 available values are excluded. Annual means are calculated based on the monthly time series with missing monthly values replaced with a seasonal cycle based on the entire period of available data. If more than two monthly values are missing in a year, the annual mean value is also excluded. Out of the global irradiance observations, approximately 2.5% of the daily averaged data are missing. Of the cloud observations, 2% are missing at the Florida site, while 9% are missing at Flesland.
4.3. Aerosol optical depth
To explicitly evaluate the changing atmospheric turbidity in Bergen, we calculate the broadband AOD based on clear-sky direct irradiance measurements as described in Gueymard (Citation1998). Direct irradiance measurements are only available for 1991–2013, but an extended AOD time series is calculated for 1965–2013 using the global minus diffuse irradiance as an estimate of direct irradiance. We calculate the AOD for hours when the sun is not obscured by clouds (hours with 60 minutes of sunshine duration).
The AOD is calculated as in eq. (1).1
where E b and E 0 are the direct irradiance at the surface of the Earth and the extraterrestrial irradiance, respectively. The equation accounts for the effect of aerosols, water vapour, and tropospheric nitrogen dioxide (NO2) which are represented by the optical air masses, m a , m w , m nt and the broadband optical depths δ w , and δ nt . Constituents in the upper clean dry layers of the atmosphere are represented by δ R , δ O , δ ns , and δ g which are the broadband optical depth of Rayleigh scattering, ozone (O3), stratospheric NO2, and uniformly mixed gases. The optical air masses of these constituents are assumed to be approximately equal (m R ≈m O ≈m ns ≈m g ).
We let the time, direct irradiance, precipitable water and surface pressure vary but assume constant values of tropospheric NO2 (10×10−3 atm cm), stratospheric NO2 (0.2×10⁻³ atm cm), and O3 (0.35 atm cm). The varying precipitable water is calculated based on local measurements of relative humidity, surface temperature and pressure from the Florida station in Bergen. These measurements are only available digitally for the 6-hourly observations (0, 6, 12, 18 UTC) but the time series are interpolated to obtain hourly values of precipitable water and surface pressure. However, using constant values of pressure or precipitable water makes a negligibly small difference (not shown here), which indicates that variations in input parameters other than the direct irradiance have a small influence on the AOD.
Significantly lower O3 column values than 0.35 atm cm can occur in springtime during years of enhanced Arctic ozone loss (Manney et al. Citation2011). However, based on the AOD calculation described above [eq. (1)], even a complete removal of O3 changes the monthly mean AOD by a maximum of −0.008 (less than 10% of the average AOD). As we will show in Section 5.4, the AOD changes in Bergen are at least an order of magnitude larger and are therefore not likely due to ozone depletion.
5. Results and discussion
5.1. Decadal variability of solar radiation
The solar irradiance development in Bergen can be described as a dimming from the 1970s to around 1990, followed by a brightening in recent decades. By itself, the global irradiance time series provides weak evidence of significant decadal variations of the radiative climate, but more pronounced trends are seen in the atmospheric transmittance time series. On average, the global irradiance is lower during the 1980s and 1990s than during the 1960s and 2000s (a). The negative global irradiance trend from the 1960s to around 1990 and the positive trend following 1990 are of approximately the same magnitude, 2–3 Wm−2/decade. The global and diffuse+direct irradiance follow each other closely throughout the 1990s and 2000s, showing no indications that the increasing global irradiance during this period is related to measurement errors. However, only during two of the sliding 25-yr long periods (1968–1992 and 1986–2010) are the linear global irradiance trends statistically significant (a, lower panel). The atmospheric transmittance time series describes a similar development of negative trends from the 1960s to around 1990 followed by positive trends after 1990. For the atmospheric transmittance, the trends are statistically significant for multiple succeeding periods (c), indicating that there is an extended dimming period and following brightening, both stronger than the expected random variability.
Fig. 4 Time series of the (a) global irradiance, (b) sunshine duration, (c) atmospheric transmittance (normalised global irradiance), and (d) relative sunshine duration (normalised sunshine duration) measured at the Florida station in Bergen, Norway. The two lines in the atmospheric transmittance plot represent the atmospheric transmittance calculated from the global irradiance (black line) and using on the sum of diffuse and direct irradiance as an estimate of global irradiance (light blue line). Each observational parameter is shown in two panels, the upper showing the annual mean (thin lines) and smoothed (thick lines, local regression smoothed curves with a smoothing window of 30 yr) time series. In the lower panels, markers represent the magnitude of the linear trend of sliding 25-yr long periods centred at the year indicated at the abscissa. Large circle markers indicate that a trend is statistically significant at the 95%-level (based on the Mann-Kendall test) and smaller dots indicate that the trend is not statistically significant.
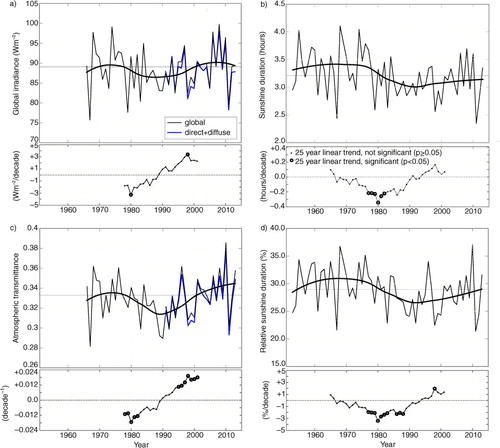
The dimming is also evident as a decrease of the sunshine duration from the late 1960s to the early 1990s of approximately 15 minutes per day per decade (b). The relative sunshine duration decreases by around 2% (percentage points) per decade during the same period. For both the sunshine duration and the relative sunshine duration, statistically significant negative trends are identified in multiple succeeding 25-yr long periods from the late 1960s to the early 1990s. The brightening after 1990 seen in the atmospheric transmittance time series (c) is not obvious in the sunshine duration or relative sunshine duration (b and d).
5.2. Decadal variability of clouds
During the dimming period (late 1960s to early 1990s) discussed in the previous section, the annual mean NN increases by approximately 0.1 oktas/decade while the average HL sinks, at Florida by only 40 m/decade but at Flesland by more than 100 m/decade (). The trends of the solar and cloud observations are compatible with a cloud induced dimming.
Fig. 5 As in . Time series of the a) cloud cover, b) cloud base, c) frequency of few or no clouds (NN<2 oktas), and d) frequency of low clouds with a cloud base height lower than 1000 m at the Florida (black lines) and Flesland (light blue lines) stations in Bergen, Norway.
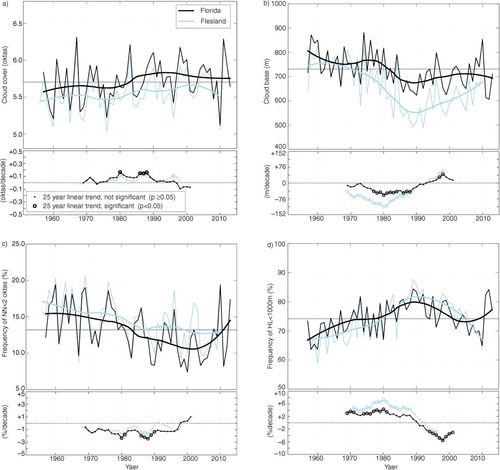
The NN change is associated with an increase in the frequency of cloudy occasions rather than of the amount of clouds when present. At Florida, the frequency of occasions with few or no clouds decreases from an average of over 17% in the 1960s to less than 13% in the 1990s (c). Although the cloud base decrease is smaller at Florida than at Flesland, the change of the frequency of low clouds with HLs lower than 1000 m is similar at the two sites (d). The cloud base change is stronger at Flesland than at Florida because the base height of the increasingly frequent low clouds tends to be even lower at Flesland than at Florida, as is also seen in the cloud base distributions in (see discussion in Section 3.2.1).
During the more recent brightening period (after 1990), the up till then increasing NN levels off, but the trend is not fully reversed (a and c). While the average NN does not change significantly after 1990, there is a trend reversal of the HL (b and d). The frequency of low clouds (HL<1000 m) decreases from around 80% in 1990 to less than 70% in 2010. Because low clouds tend to be warmer and therefore more optically thick than higher clouds (Olseth and Skartveit, Citation1993), the decreasing frequency of low clouds is a plausible explanation of the increasing atmospheric transmittance (normalised global irradiance) after 1990.
5.3. Seasonal solar and cloud changes
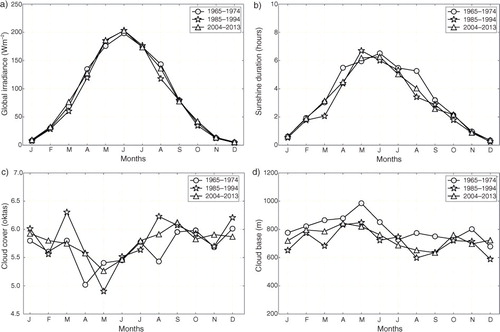
At high latitude sites such as Bergen, the global irradiance and sunshine duration have a large seasonal cycle due to variations of the angle and orbit of the Earth in relation to the Sun (a and b). The monthly average maximum sunshine duration ranges from approximately 2 hours (December) to over 16 hours (June) whereas the observed average sunshine duration ranges from less than 20 minutes (December) to just over 6 hours (May and June) because NN doesn't show a strong seasonality. Therefore, a change of the atmospheric turbidity or cloudiness can influence the annual mean solar climate more strongly if it occurs in summer than in winter. The NN and HL vary less than the SW irradiance during the year and their weak seasonal cycles are related to seasonally shifting atmospheric circulation (c and d). The difference between the relative weight of the seasons in the annual mean is potentially problematic when comparing time series of solar irradiance (e.g. global irradiance or sunshine duration) to measures of cloudiness (e.g. NN or cloud base). The normalisation procedure of the global irradiance and sunshine duration serves to reduce the seasonal cycle. The more pronounced trends in atmospheric transmittance compared to global irradiance (a and c) indicate that the brightening and dimming is strongest in seasons that are given more weight after the normalisation precedure, i.e. not summer.
Fig. 6 Climatology of the (a) sunshine duration and (b) global irradiance measured at the Florida station in Bergen, and the (c) cloud cover, and (d) cloud base height, observed at both Florida and a second station, Flesland. In the upper panels, monthly climatologies are shown for the three 10-yr long periods 1965–1974 (circles), 1985–1994 (stars) and 2004–2013 (triangles).
To study the seasonal variations of the changing radiative climate and cloudiness in Bergen, we look at the monthly climatologies of global irradiance, sunshine duration, NN, and HL during different periods. The statistical significance of the mean difference between two periods is evaluated by a two-tailed t-test. shows the climatological changes of cloud and solar observations in Bergen. Panels a, b, c, and d show the difference between the period 1965–1974 and 1985–1994, which corresponds to the dimming period identified in a and b. The seasonality of the recent brightening is evaluated based on e, f, g and h, which shows the change from 1985–1994 to 2004–2013.
Fig. 7 Climatological change from (a, b, c, d) 1965–1974 to 1985–1994 and (e, f, g, h) 1985–1994 to 2004–2013 of the (a, e) global irradiance, (b, f) sunshine duration, (c, g) cloud cover, and (d, h) cloud base height. The monthly climatologies are shown in . The climatological change is estimated as the difference between the mean value for each month calculated for two periods. The statistical significance of the difference in mean value is evaluated by two-tailed t-test. Large markers represent differences between monthly mean values that are significant at the 95%-level (p<0.05).
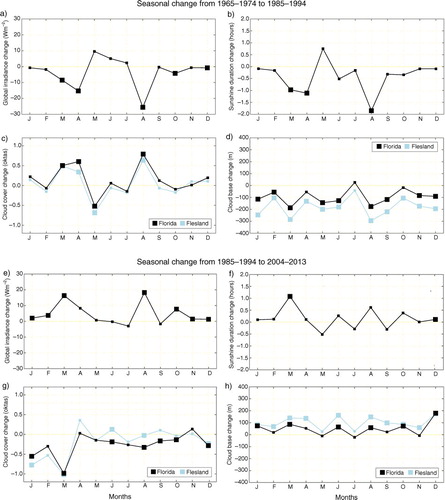
For the dimming period, the seasonal analysis confirms what was seen in the annual mean time series ( and ), that the decreasing solar irradiance is accompanied by an increasing cloudiness. The climatological changes depicted in a and b indicate that the dimming seen in the annual mean solar time series () occurs primarily in March, April and August. From the period 1965–1974 to 1985–1994, the global irradiance decreases by approximately 10 Wm−2 in March, 15 Wm−2 in April, and almost 30 Wm−2 in August (a). The corresponding decrease of daily average sunshine duration is approximately 1 hour in March and April and close to 2 hours in August (b). Significant reductions of global irradiance are also observed in October and December but of a much smaller magnitude (<2 Wm−2). The dimming is likely related to the NN which increases by over 0.5 oktas from 1965–1974 to 1985–1994 in March, April and August (c). In May, which is the only month with a NN decrease, both the global irradiance and sunshine duration increase, albeit not statistically significant. The HL is also reduced from 1965–1974 to 1985–1994, statistically significant in almost all months at both Flesland and Florida (d).
Although the annual mean time series ( and ) appear to be incompatible with a cloud driven brightening in recent decades, the seasonal analysis indicates that in the months when brightening occurs, the global irradiance increase is accompanied by a decreasing cloudiness. The climatological changes during the brightening period, from 1985–1994 to 2004–2013 (e), show that the strongest brightening, like the previous dimming, occur in early spring and late summer. The global irradiance increases by around 15 Wm−2 in March and 20 Wm−2 in August. Smaller but significant global irradiance changes also occur during parts of autumn and winter, from October to February. For the sunshine duration, a significant increase of around 1 hour per day is seen in March while the approximately 0.5 hour increase in August is not statistically significant (f). The NN decreases significantly, by almost 1 okta, during March, mirroring the changes in sunshine duration and global irradiance (g). Smaller but significant reductions of NN are observed in many other months at the Florida site, but only in December, January and March are the cloud changes corroborated by similar changes at Flesland. The HL increases during the brightening period in all seasons, more strongly and consistently at Flesland than at Florida (h).
5.4. Aerosol optical depth
Until now, we have focused on changes of the solar irradiance in relation to the cloud field. However, it is plausible that changing aerosol emissions, in Bergen as well as in other parts of Europe, have influenced the solar irradiance too. To explicitly evaluate the changing atmospheric turbidity in Bergen, we calculate the broadband AOD as described in Section 4.3 based on direct irradiance measurements that are unobscured by clouds from 1991 to 2013 as well as for the extended period 1965–2013 using the global minus diffuse irradiance as an estimate of direct irradiance (a). Another measure of atmospheric turbidity, the diffuse fraction (diffuse/global irradiance) is also calculated but based on all available hourly values, obscured and unobscured alike (b).
Fig. 8 Time series of (a) the aerosol optical depth, and (b) the diffuse fraction (diffuse/global irradiance). The AOD is calculated based only on hours when the sun is unobscured by clouds (sunshine duration=60 minutes), from diffuse and global irradiance (grey markers and lines) for the period 1965–2013, and from direct normal irradiance observations (blue markers and lines) for 1991–2013. The diffuse fraction is calculated based on diffuse and global irradiance for all hours, cloudy and clear. Small markers (in panel a) represent the monthly averaged AOD values, the solid lines (both panels) show the annual mean time series of AOD and diffuse fraction which is calculated based on the monthly values, and the dashed lines (in both panels) are local regression smoothed curves with a smoothing window of 30 yr. An increase in aerosol optical depth can be observed following the volcanic eruptions of El Chichón and Mount Pinatubo, which are marked in panel a.
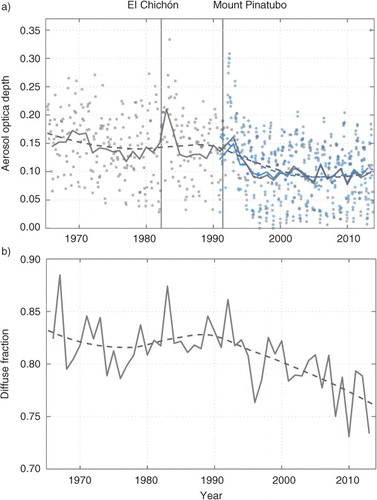
Following the volcanic eruptions of El Chichón (Mexico) in March–April 1982 and Mount Pintatubo (Philippines) in June 1991, temporary decreases are seen in the AOD in Bergen, more distinct in the monthly time series than in the annual mean (a). The El Chichón and Mount Pintatubo eruptions injected the stratosphere with 6 and 20 million metric tonnes of sulphur dioxide (SO2), respectively, which within months had spread across the globe (Michalsky et al., Citation1994). Through chemical reactions, the SO2 was transformed into sulphuric acid droplets (H2SO4 mixed with water), a highly SW reflective aerosol that is so small it can stay in the atmosphere for several years. Considerable reductions of SW irradiance have been detected at midlatitude sites as a result of the volcanic sulphur aerosols (Alados-Arboledas et al., Citation1997). The volcanic signal in Bergen lends credibility to the calculated AOD.
The average AOD in Bergen dropped in recent decades, from an average of approximately 0.15 before 1990 to around 0.10 after 2000. The decrease is seen in the AOD calculated from direct irradiance measurement as well as the estimate based on the global minus diffuse irradiance, showing that the AOD drop is not due to the possible measurement errors discussed in Section 3.3.1. The decreasing AOD could be a contribution factor in the observed brightening which starts around 1990. However, during the earlier dimming period from the 1960s to the late 1980s, there is no indication of an increasing AOD. We conclude that changing aerosol emissions are not a probable cause of the dimming in Bergen.
Using the Fu-Liou code of line-by-line radiative transfer (available via the web site http://www-cave.larc.nasa.gov/cgi-bin/fuliou/runfl.cgi), we estimate that the decrease in AOD in Bergen has a direct effect on the total SW irradiance of around +2–6 Wm−2 depending on the time of year (6 Wm−2 in June, 2 Wm−2 in December). However, compared to observations from cloud free days in Bergen, the model underestimates the direct irradiance and overestimates the diffuse irradiance, in summer by up to 200 Wm−2 when the sun is at its highest. This problem also occurs when calculating the SW irradiance with the libRadtran model (Mayer and Kylling, Citation2005), where we also try varying the single scattering albedo, asymmetry factor and atmospheric humidity without managing to get a direct and diffuse irradiance balance that is representative of clear sky conditions in Bergen (not shown here). The overestimated diffuse irradiance casts some doubt on the radiative transfer calculations, but it cannot be excluded that the AOD change has a non-negligible effect on the SW irradiance.
The diffuse fraction follows the AOD time series during the AOD decrease in the 1990s, but then continues to decrease during the 2000s (b). Since the diffuse fraction is estimated from all sky observations and the AOD represents the unobscured atmosphere, the difference between the variables in the last decade may be related to changes of the cloud optical depth or processes that are otherwise related to cloudy situations, e.g. precipitation.
The AOD drop around 1990 coincides with the industrial development in Bergen and Europe (Smith et al., Citation2004; Luftforurensning, Citation2009). As a result of stricter emission regulations, the AOD has decreased all over Europe since the 1980s. The collapse of the Soviet Union and following economic crisis brought about a dramatic decrease in aerosol emissions in eastern Europe after 1989 (Streets et al., Citation2006). The late 1980s was also a time of industrial dismantlement in Bergen, including the local shipbuilding yard located near the Florida measurement site. Also around the same time, Norway tightened the regulations on emissions from cars. Assuming that the 1990s AOD decrease was a response to reduced anthropogenic aerosol emissions, the pre-1990s AOD level is not a natural state in Bergen. At some point in time, there must have been a considerable increase in the atmospheric aerosol load, but based on the results presented here, the increase occurred before 1965, a period for which we have no irradiance observations.
6. Variations of the surface temperature in Bergen
Because clouds interact with both SW and longwave (LW) radiation, it is plausible that the observed cloud changes in Bergen have a notable influence on the surface energy budget and local surface temperature. Here, we discuss the relationship between the surface temperature and the locally observed variations of clouds and SW irradiance in Bergen, but also its connection to the North Atlantic SST.
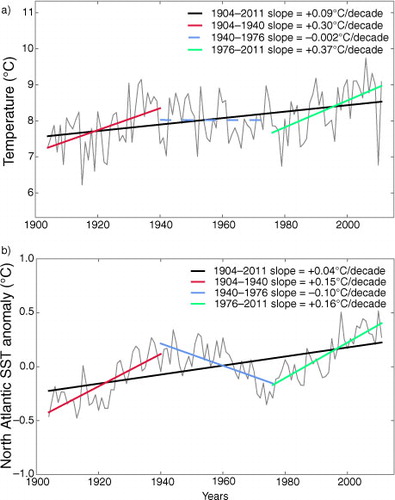
The temperature record for Bergen is characterised by a long-term warming of approximately +0.09°C/decade from 1904 to 2012 (a). The most rapid warming occurs in an early period during the 1920s and 1930s and again during recent decades, from the 1980s and onwards, both trends of approximately +0.3°C/decade and statistically significant. From the 1940s to the late 1970s, there is no significant change in the surface temperature. The timing of the temperature changes in Bergen, including the warming hiatus, is in line with reported temperature trends in Norway and reminiscent of the trends of the northern hemisphere (NH) mean temperature (Hanssen-Bauer et al., Citation2009). The similarity between the local and large-scale temperature trends suggests that both the warming and the hiatus are associated with factors that act on large spatial scales. Given the maritime climate of Bergen, it comes as no surprise that the local surface temperature in Bergen follow the long-term variability of the average North Atlantic SST (b). The decreasing SST from the 1940s to the late 1970s may explain the temporarily paused warming during this period. Greenhouse gases have been implicated as the driver of the long-term increase in SSTs. The cause of the multidecadal variability (i.e. the Atlantic Multidecadal Oscillation, AMO) of the North Atlantic SST is uncertain and the subject of debate. Some regard the AMO as a natural climate oscillation linked to variations in ocean heat uptake, while others argue that anthropogenic aerosol emissions and resulting changes in SW irradiance and evaporation is the prime driver of the AMO (Knudsen et al., Citation2011; Booth et al., Citation2012; Gulev et al., Citation2013).
Fig. 9 Time series of (a) the observed surface air temperature in Bergen (combined measurements from the Florida and Fredriksberg sites) and (b) the average sea surface temperature anomaly of the North Atlantic Ocean.
Next, we address the potential connection between the observed cloud changes and temperature in Bergen. The presence of clouds can have a positive or negative influence on the local surface temperature, warming by absorbing and reemitting outgoing LW radiation and cooling by reflecting SW irradiance back to space. During an extended summer period, from May to August, the cooling SW effect of the clouds is stronger than the warming LW effect, which is shown by the significant positive correlation between SW irradiance and temperature, and the anti-correlation between NN and temperature (). In the transitional months between winter and summer (March, April, September, October), the correlation between NN and temperature is lower and not statistically significant, indicating that the net effect of the clouds on the local surface temperature is more ambiguous than in summer because of the weaker SW irradiance and shorter day length. During the extended winter period, November–February, the air temperature and NN are positively correlated () which indicates that the warming LW effect of clouds is larger than the marginal cooling SW effect during the short day time in winter (). The cloud inducing conditions associated with warm air may also reinforce the positive correlation between NN and temperature in winter. Warm air tends to be more moist than cold air and associated with less stable boundary layers; both factors promote cloud formation. The correlation between SW irradiance and temperature is negative during the winter period () due to the clouds which reduce SW irradiance but have a net positive effect on air temperature.
Table 1. Correlation (R) between the observed temperature (T), cloud cover (NN) and global irradiance (SW) in Bergen, calculated based on monthly mean time series for January–December as well as the annual and seasonal mean time series
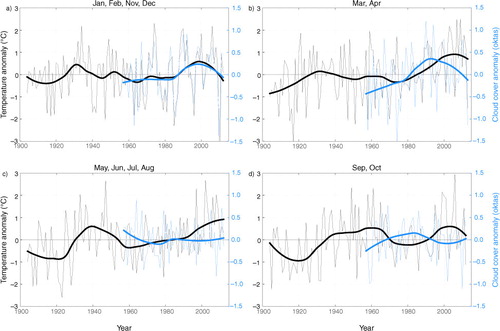
The seasonal analysis in show that the timing of the observed air temperature trends in Bergen correspond well with the multidecadal North Atlantic SST variability during summer and late spring (May–August) and quite well in early autumn (September–October), but not as convincingly in the extended winter period, and early spring (November–April). This implies that the local cloud variations have a dominant influence on the temperature during an extended winter period, while the influence of the SST may be more dominant in the sunny season. Sure enough, in winter, the observed local air temperature and NN follow each other closely, no significant trends occurring in the short or long term in either of the time series (). In summer, the NN is almost stable throughout the observational period, obviously not driving the observed local temperature increase in recent decades. There is, however, a period of slightly decreasing NN from the early 1960s to the late 1970s in summer which may be a contributing factor to the warming during this period. This is also the only period during which the summer air temperature departs from the SST trend. In spring and autumn, it is less obvious how the observed cloud and SW irradiance changes relate to the local temperature because of the unpredictable net effect of the clouds on the surface temperature. In conclusion, there is a close link between the temperature and NN in Bergen in the extended winter period. In other seasons, the local temperature trends are mostly in line with hemispheric trends and likely connected to the greenhouse gas induced warming and the North Atlantic multidecadal SST variability.
Fig. 10 Time series of observed air temperature in Bergen (black lines) and the average North Atlantic SST (blue lines). Thin lines represent the seasonal mean time series and thicker lines are smoothed Lowess curves. The panels show the seasonally averaged time series for (a) January, February, November and December, (b) March and April, (c) May, June, July and August, and (d) September and October. The seasons are defined based on the correlation between the temperature and cloud cover (), which is positive for November–February, negative for May–August, and for March, April, September and October, low and not statistically significant.
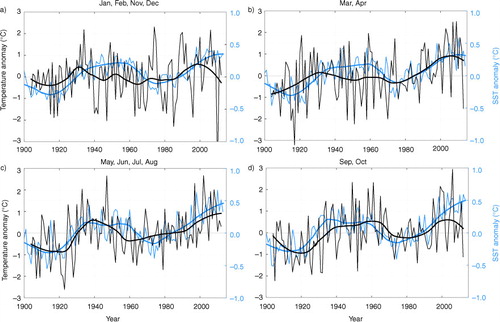
Fig. 11 Time series of temperature (black lines) and cloud cover (blue lines) measured at the Florida site in Bergen. Thin lines represent the seasonal mean time series and thicker lines are smoothed Lowess curves. The panels show the seasonally averaged time series for (a) January, February, November and December, (b) March and April, (c) May, June, July and August, and (d) September and October. The seasons are defined based on the correlation between the temperature and cloud cover (), which is positive for November–February, negative for May–August, and for March, April, September and October, low and not statistically significant.
7. Summary and conclusions
Cloud and solar observations from Bergen, Norway, are analysed with a focus on decadal to multidecadal variability. To evaluate the spatial representativity of the cloud observations, data from two neighbouring sites are compared to each other. Although there are notable differences between the cloud observations, most likely related to topographical differences, similar long-term cloud changes are observed at both stations.
During the 1970s and 80s, the total NN increases. The cloud change is characterised by an increase of the frequency of cloudy situations rather than of the amount of clouds when present. In particular, the frequency of low-level clouds increases which is also seen as a decrease of the HL. The increasing cloudiness is accompanied by a decrease of the global irradiance and sunshine duration, which can be described as a dimming. The seasonal analysis reveals that the dimming occurs primarily in April, March, and August, and that the NN increases in the same months. In conclusion, the cloud and solar observations in Bergen are consistent with a seasonal cloud driven dimming from the 1970s to the late 1980s.
After 1990, there is an increasing tendency in the global irradiance, a brightening. Based on the annual mean time series, the brightening is not accompanied by an increasing sunshine duration or decreasing NN. This suggests that the global irradiance increase is not caused by cloud changes. However, the seasonal analysis shows that in March and August when the strongest brightening occurs, there is also a decrease of the cloud cover, as expected. We conclude that the apparent mismatch between global irradiance, sunshine duration and NN is at least partially due the influence of seasonal cycles when calculating annual mean time series. In the most strongly brightening months, the observations are compatible with a cloud driven increase of global irradiance.
The changes in HL, decreasing during the dimming period and increasing during the brightening, may also be of importance to the surface solar irradiance changes. First of all, low clouds tend to be optically thicker than high clouds and therefore, their presence has a direct negative influence on global irradiance (Olseth and Skartveit, Citation1993). Secondly, low clouds are associated with heavily cloudy and rainy situations. The increasing frequency of cloudy situations in general and low clouds in particular suggest that the cloud induced dimming is related to an increasing frequency of ‘bad weather’ situations, possibly an increased frequency of storms. This topic will be assessed in a follow-up study.
To explicitly address the turbidity changes in Bergen, we estimate the AOD for hours when the sun is unobscured by clouds, based on measurements of direct irradiance and of global minus diffuse irradiance. After 1990, the AOD decreased from an average of over 0.15 before 1990 to almost 0.10 after 2000. The AOD decrease may have contributed to the brightening which occurs during the same period. Aerosols affect solar irradiance by scattering and absorbing SW radiation, and indirectly by acting as cloud condensation nuclei, thus influencing cloud albedos and life times (Wild, Citation2009a). Given the perpetual cloudiness and precipitation in Bergen, there may not be much room for a strong aerosol effect. The indirect effect of aerosols is difficult to separate from cloud changes associated with atmospheric circulation. Based on the results presented here, we cannot exactly tell to what proportion the global irradiance increase in recent decades is caused by changes in aerosols, clouds, and cloud–aerosol interactions. However, the stable AOD level from 1965 to 1990 demonstrates that aerosols changes cannot be responsible for the observed dimming.
Finally, we study the observed surface air temperature in Bergen, which increased significantly during the observational period 1904–2012. The local temperature changes are in line with observed trends in Norway and have features similar of the average NH temperature: a strong warming in the 1920s and 30s and again from the 1980s to the present day, and in between, a reduced or paused warming from the 1940s to 1970s. We find that the temperature trends are smallest in winter, which is also the season when the observed NN and temperature appears to be most tightly linked. In spring, summer and autumn, greenhouse gas induced warming and the multidecadal variability of the North Atlantic SST appear to be the more dominant influence on local temperature compared to local cloud and SW irradiance variability. Although the air temperature in Bergen appears not to have a close connection to the local dimming and brightening, we cannot exclude that SW irradiance variations on larger spatial scales may have influenced the SST and thus affected the air temperature in the North Atlantic region.
In Bergen, the timing of the dimming and subsequent brightening is similar to trends reported in other northern European sites (Stjern et al., Citation2009; Chiacchio and Wild, Citation2010). Assuming that the observed cloud changes during the dimming period are driven by large-scale atmospheric circulation, an increasing cloudiness may be expected in a larger region. The underlying cause and spatial range of the observed cloud changes are beyond the scope of this study. This issue will be addressed in a follow-up study of the connection between the large-scale atmospheric and ocean circulation, and local cloud and solar irradiance conditions in northern Europe.
8. Acknowledgements
The present study was partially funded by the U.S. National Science Foundation grant 1108502. The authors would like to thank Dag Kvamme for valuable discussions during the course of this work.
Related Research Data
References
- Alados-Arboledas L. , Olmo F. J. , Ohvril H. O. , Teral H. , Arak M . Evolution of solar radiative effects of Mount Pinatubo at ground level. Tellus B. 1997; 49: 190–198.
- Booth B. B. B. , Dunstone N. J. , Halloran P. R. , Andrews T. , Bellouin N . Aerosols implicated as a prime driver of twentieth century North Atlantic climate variability. Nature. 2012; 484: 228–232.
- Chiacchio M. , Wild M . Influence of NAO and clouds on long-term seasonal variations of surface solar radiation in Europe. J. Geophys. Res. 2010; 115: 00D22.
- Enfield D . The Atlantic Multidecadal Oscillation and its relation to rainfall and river flows in the continental US. Geophys. Res. Lett. 2001; 28: 2077–2080.
- Finsterle W . WMO International Pyrheliometer Comparison IPC-XI. 2011; Technical Report 108, PMOD/WRC, Davos.
- Fröhlich C . Evidence of a long-term trend in total solar irradiance. Astron. Astrophys. 2009; 501: L27–L30.
- Gilgen H. , Wild M. , Ohmura A . Means and trends of shortwave irradiance at the surface estimated from global energy balance archive data. J. Clim. 1998; 11: 2042–2061.
- Gilgen H. , Roesch A. , Wild M. , Ohmura A . Decadal changes in shortwave irradiance at the surface in the period from 1960 to 2000 estimated from global energy balance archive data. J. Geophys. Res. 2009; 114: 00D08.
- Gueymard C. A . Turbidity determination from broadband irradiance measurements: a detailed multicoefficient approach. J. Appl. Meteorol. 1998; 37: 414–435.
- Gulev S. K. , Latif M. , Keenlyside N. S. , Park W. , Koltermann K. P . North Atlantic Ocean control on surface heat flux on multidecadal timescales. Nature. 2013; 499: 464–467.
- Hanssen-Bauer I . A simple model for diffusion of SO2 in Bergen. Atmos. Environ. 1985; 19: 415–422.
- Hanssen-Bauer I. , Drange H. , Førland E. J. , Roald L. A. , Børsheim K. Y. , co-authors . Klima i Norge 2100. Bakgrundsmateriale til NOU Klimatilpassing (Climate in Norway 2100. Background material for Norwegian Committee on Climate Change Adaptation). 2009; Oslo: Norsk klimasenter.
- Iqbal M . An Introduction to Solar Radiation. 1983; 1st ed, Academic Press, Ontario, Canada.
- Kaplan A. , Cane M. A. , Kushnir Y. , Clement A. C. , Blumenthal M. B. , co-authors . Analyses of global sea surface temperature 1856–1991. J. Geophys. Res. 1998; 103: 18567–18589.
- Knudsen M. F. , Seidenkrantz M.-S. , Jacobsen B. H. , Kuijpers A . Tracking the Atlantic Multidecadal Oscillation through the last 8,000 years. Nat. Commun. 2011; 2: 178.
- Liepert B. G . Observed reductions of surface solar radiation at sites in the United States and worldwide from 1961 to 1990. Geophys. Res. Lett. 2002; 29(10): 61-1–61-4.
- Liley J. B . New Zealand dimming and brightening. J. Geophys. Res. 2009; 114: 00D10.
- Luftforurensning. In Store norske leksikon (Norwegian Encyclopedia). 2009. Online at: http://snl.no/luftforurensning .
- Manney G. L. , Santee M. L. , Rex M. , Livesey N. J. , Pitts M. C. , co-authors . Unprecedented Arctic ozone loss in 2011. Nature. 2011; 478: 469–475.
- Mayer B. , Kylling A . Technical note: the libRadtran software package for radiative transfer calculations-description and examples of use. Atmos. Chem. Phys. 2005; 5: 1855–1877.
- Michalsky J. , Perez R. , Seals R. , Ineichen P . Degradation of solar concentration in the aftermath of Mount Pinatubo. Sol. Energ. 1994; 52: 205–213.
- Norris J. R. , Wild M . Trends in aerosol radiative effects over Europe inferred from observed cloud cover, solar dimming and solar brightening. J. Geophys. Res. 2007; 112: 08214.
- Olseth J. A. , Skartveit A . Characteristics of hourly global irradiance modelled from cloud data. Sol. Energ. 1993; 51: 197–204.
- Reda I. , Stoffel T. , Myers D . A method to calibrate a solar pyranometer for measuring reference diffuse irradiance. Sol. Energ. 2003; 74(2): 103–112.
- Russak V . Changes in solar radiation and their influence on temperature trend in Estonia (1955–2007). J. Geophys. Res. 2009; 114: 00D01.
- Smith S. J. , Conception E. , Andres R. , Lurz J . Historical Sulfur Dioxide Emissions 1850–2000: Methods and Results. 2004; Pacific Northwest National Laboratory, Richland, WA: PNNL-14537.
- Stanhill G . Through a glass brightly: some new light on the Campbell Stokes sunshine recorder. Weather. 2003; 58: 3–11.
- Stanhill G. , Cohen S . Global dimming: a review of the evidence for a widespread and significant reduction in global radiation with discussion of its probable causes and possible agricultural consequences. Agr. Forest Meteorol. 2001; 107(4): 255–278.
- Stjern C. W. , Kristjánsson J. E. , Hansen A. W . Global dimming and global brightening – an analysis of surface radiation and cloud cover data in northern Europe. Int. J. Clim. 2009; 29: 643–653.
- Streets D. G. , Wu Y. , Chin M . Two-decadal aerosol trends as a likely explanation of the global dimming/brightening transition. Geophys. Res. Lett. 2006; 33(15):
- Wild M . Global dimming and brightening: a review. J. Geophys. Res. 2009a; 114: 00D16.
- Wild M . How well do IPCC-AR4/CMIP3 climate models simulate global dimming/brightening and twentieth-century daytime and nighttime warming?. J. Geophys. Res. 2009b; 114: 00D11.
- Wild M . Enlightening global dimming and brightening. Bull. Am. Meteorol. Soc. 2012; 93(1): 27–37.
- Wild M. , Gilgen H. , Roesch A. , Ohmura A. , Long C. N. , co-authors . From dimming to brightening: decadal changes in solar radiation at Earth's surface. Science. 2005; 308: 847–850.
- World Meteorological Organization. Observations of clouds. WMO Guide to Meteorological Instruments and Methods of Observations. Part I. Measurements of Meteorological Variables. 2008; World Meteorological Organization. WMO-NO.8, Geneva. 15-1–15-11..