
Abstract
The objective of this work is to examine the impacts of additional HONO sources on the chemical interaction between ozone (O3) and particulate matter with a diameter≤2.5 µm (PM2.5). Three additional HONO sources, i.e. HONO emissions, the reaction of photo-excited nitrogen dioxide (NO2
*) with water vapour (H2O), and NO2 heterogeneous reaction on aerosol surfaces, were inserted into the fully coupled Weather Research and Forecasting-Chemistry model to evaluate O3 and PM2.5 concentration enhancements in the Beijing–Tianjin–Hebei (BTH) region during August 2007. Results show that the additional HONO sources significantly increase O3 and PM2.5 concentrations during daytime. Up to 9 ppb enhancements of O3 and 32 µg m−3 increases in PM2.5 are found at seven urban sites over the BTH region. O3 increases are closely connected to PM2.5 increases over urban areas during daytime when the additional HONO sources are taken into account. PM2.5 inorganic components of ,
and
are increased by 5–18, 10–58 and 10–40%, respectively, over urban areas during daytime. The simultaneous increment of O3 and PM2.5 during daytime due to the additional HONO sources is related to the increasing oxidants (OH, H2O2 and O3) that enhance the atmospheric oxidising capacity. The concentration variations of O3 and PM2.5 under a variety of NOx, volatile organic compound and ammonia (NH3) emission control scenarios show that the additional HONO sources increase the sensitivity of O3 and PM2.5 concentrations to the changes of NOx emissions. An increase of the PM2.5 sensitivity to changes in NH3 emissions is also found. This indicates that without considering the additional HONO sources, the effectiveness of emission control strategies in reducing O3 and PM2.5 concentrations would be significantly underestimated.
To access the supplementary material to this article, please see Supplementary files under ‘Article Tools’.
1. Introduction
Nitrous acid (HONO) plays an important role in enhancing O3 and particulate matter (PM) concentrations in the polluted atmospheric boundary layer due to its photolysis into the hydroxyl radical (OH), which is a primary daytime oxidant (Alicke et al., Citation2002; Kleffmann et al., Citation2005). Jenkin et al. (Citation2008) showed that increasing HONO emissions by 5% resulted in O3 enhancements of 11 ppb in the southern UK during a heat-wave period of August 2003. Besides direct emissions, HONO can also be formed through gas-phase or heterogeneous reactions. The homogeneous gas-phase reaction between excited nitrogen dioxide (NO2 *) and H2O (NO2 *+H2O→HONO +OH, hereafter referred to as NO2 * chemistry) has gained interest since its reaction rate has been found at an order of magnitude faster than the previously estimated upper limit (Crowley and Carl, Citation1997), thus can substantially enhance OH production (Li et al., Citation2008). However, the atmospheric significance of this new mechanism is highly controversial. Carr et al. (Citation2009) argued that the NO2 * chemistry would not be important under normal atmospheric conditions and they estimated the reaction rate similar to the result of Crowley and Carl (Citation1997) (1.2×10⁻¹⁴ cm3 molecule−1 s−1). Amedro et al. (Citation2011) claimed that no OH radicals were observed using an unfocused excitation laser beam at 565 nm, but OH formation was observed by focusing the laser beam. Recently, Wu and Chen (Citation2012) concluded that the reaction of two photon absorbed NO2 with H2O makes negligible contributions to the formation of OH radicals while single photon absorption at <554 nm is a possible process.
The uncertainties in the NO2 * chemistry did not prevent the evaluation of its potential impact on tropospheric air quality using chemical transport models. Simulations conducted in the South Coast Air Basin of California during the summer of 1987 showed that the NO2 * chemistry increased O3 and PM2.5 (PM with a diameter≤2.5 µm) concentrations by as much as 55 ppb and 20 µg m−3, respectively (Wennberg and Dabdub, Citation2008). However, due to the lower ambient NOx and volatile organic compound (VOC) levels, the impact of the NO2 * chemistry on O3 enhancement was found to be smaller in the U.S. after the year of 2000. The maximum increases of O3 concentrations in urban areas in the U.S. less than 10 ppb (Sarwar et al., Citation2009; Ensberg et al., Citation2010) suggest that the effect of the NO2 * chemistry on pollution levels may be more significant in some industrialised regions with elevated levels of ambient NOx and VOCs, such as mega-cities in China. Thereafter studies reported that O3 enhancements were more than 30 ppb in Beijing (Li et al., Citation2011) and Taiwan (Jorba et al., Citation2012), and 10 ppb over the urban areas of the Pearl River Delta region of China (Zhang et al., Citation2013).
Along with the direct emissions and the homogeneous formation of HONO, NO2 heterogeneous reaction on wet surfaces (2NO2+H2O→HNO3+HONO) is commonly considered as one of the major HONO heterogeneous sources (Jenkin et al., Citation1988; Kleffmann et al., Citation1998; Finlayson-Pitts et al., Citation2003). The NO2 heterogeneous reaction has been included previously in the Community Multiscale Air Quality (CMAQ) modelling system (Foley et al., Citation2010). The CMAQ simulations showed that the NO2 heterogeneous reaction was found to be the most significant source of nocturnal HONO formation during the project of the Northeast Oxidant and Particle Study in the U.S. (Sarwar et al., Citation2008). The simulations conducted over the Beijing–Tianjin–Hebei region (referred as BTH region), as the most polluted areas in China, suggested that the largest enhancements of the monthly mean daytime O3 and PM2.5 during August 2007 were about 12 and 16%, respectively, and this was mostly due to the NO2 heterogeneous reaction on aerosol surfaces (An et al., Citation2013).
In addition to direct emissions, homogeneous gas-phase formation and heterogeneous reactions, a recent study has demonstrated that ammonia-oxidising bacteria in soil can directly release HONO (Oswald et al., Citation2013). The soil HONO emissions may play an important role in the biogeochemical and atmospheric nitrogen cycles. This finding helps understand how the biosphere affects the atmosphere and global climate. Before this new mechanism can be incorporated into chemical transport models, continuous and comprehensive field measurements are needed, including simultaneous monitoring of soil, ecosystem and atmospheric processes.
Previous studies mainly focused on the impacts of HONO sources on O3 and PM2.5 concentrations but rarely considered the relationship between O3 and PM2.5 enhancements due to HONO sources. Meng et al. (Citation1997) pointed out that there was a complex chemical coupling between O3 and PM2.5 components because they shared the same precursors as NOx and VOCs. In-situ observations also proved that severe PM pollution was often accompanied with high O3 concentrations. Positive correlation between the daily PM2.5 and maximum 8-h O3 (O3_8h;max) concentrations was also observed over the BTH region during the Beijing 2008 Olympic Games (Xin et al., Citation2010). When additional HONO sources were considered in the O3 and PM2.5 interaction, another level of complexity was added into the chemical coupling system (Wennberg and Dabdub, Citation2008) and this impacted O3 and PM2.5 emission control strategies (Meng et al., Citation1997). Ensberg et al. (Citation2010) studied the impacts of the NO2 * chemistry on O3 and PM control strategies over the South Coast Air Basin of California during two emission episodes that occurred for 1987 and 2005. They showed that the NO2 * chemistry increased the sensitivity of O3 and secondary PM concentrations with respect to changes in NOx emissions (Ensberg et al., Citation2010). Notable changes in O3 responses to NOx and VOC emission controls were also found in the Pearl River Delta of China due to the NO2 * chemistry (Zhang et al., Citation2013). These studies suggested that the additional HONO sources had significant implications for polluted areas to achieve ozone and PM air quality standards.
In spite of considerable improvements in air quality indexes over the last decade, the BTH region continues to suffer from severe O3 and PM pollution as well as haze (Chan and Yao, Citation2008; Sun et al., Citation2013; Zhao et al., Citation2013). Significant O3 and PM2.5 enhancements over the BTH region during August 2007 due to three additional HONO sources (including HONO emissions, the NO2 * chemistry and NO2 heterogeneous reaction on aerosol surfaces) were also reported by Li et al. (Citation2011) and An et al. (Citation2013). These works suggested that more strict conditions on O3 and PM concentration standards were needed to be set up. Presently, the China's Grade-2 Standard listFootnote1 includes the daily O3_8h;max at 160 µg m−3 and 24-h average PM2.5 at 75 µg m−3.
There are two main objectives in this study: (1) to analyse the relationship between the enhancements of daytime O3 and PM2.5 as a function of the additional HONO sources and (2) examine the reductions of daily O3_8h;max and 24-h averaged PM2.5 concentrations as functions of NOx, VOC and NH3 emission reductions when the additional HONO sources are considered. Section 2 is introduced for the numerical experiments conducted in this study. Section 3 describes observation data used in the model evaluation. The effects of the additional HONO sources on O3 and PM2.5 chemical coupling and control strategies are discussed in Section 4 and the conclusions are presented in Section 5.
2. Model description
2.1. WRF-Chem model and new parameterisation of HONO
This study utilised a fully coupled Weather Research and Forecasting-Chemistry (WRF-Chem) model (Grell et al., Citation2005; Fast et al., Citation2006) with the gas phase chemical Carbon-Bond Mechanism Z (CBM-Z; Zaveri and Peters, Citation1999) and aerosol module of the Model for Simulating Aerosol Interactions and Chemistry (MOSAIC; Zaveri et al., Citation2008). The physical schemes for simulations were identical to those chosen by Li et al. (Citation2011).
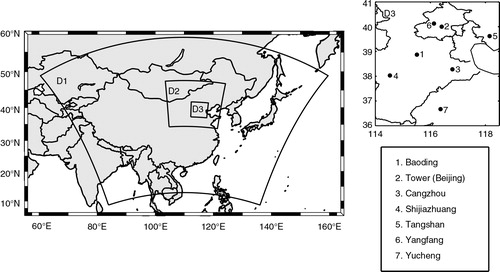
shows the domains of the simulations. Domain 1, 2 and 3 primarily cover the Eastern Asia, Northern China and BTH region, respectively. Domain 3 contains 54×54 grids with a grid resolution of 9 km and centres at 40°N, 116°E. The 28 vertical layers extend from the surface to 50 hPa with the first level at 28 m above the ground. Meteorological initial and boundary conditions were obtained from the US National Centers for Environmental Prediction (NCEP; 6-h, 1°×1°) final operation global analysis dataset. Chemical initial and boundary conditions were interpolated from the Model for OZone And Related chemical Tracers version 4 (MOZART-4; Emmons et al., Citation2010) outputs at every 6 h. Monthly anthropogenic emissions covering East Asia with a grid resolution of 0.5°×0.5° were adopted from Zhang et al. (Citation2009). Future emission inventory over this region requires a finer grid resolution to help air quality models better capture the localised photochemistry in the atmosphere. Biogenic emissions were calculated based on Guenther et al. (Citation1993) and Simpson et al. (Citation1995).
Fig. 1 Modelling domains and the monitoring sites over the BTH region.
The following input for model reference simulation and test runs was considered. Besides HONO gas-phase production from OH and NO, three additional HONO sources (i.e. HONO emissions, the NO2 * chemistry and NO2 heterogeneous reaction on aerosol surfaces) were coupled into the WRF-Chem model. Li et al. (Citation2011, Citation2014) and An et al. (Citation2013) have described the parameterisation schemes in detail. Briefly, HONO emissions included direct emissions estimated as 0.8% of NOx emissions (Kurtenbach et al., Citation2001) and 2.3% of the NOx emitted in diesel exhaust gases converted to HONO via heterogeneous reaction with semi-volatile organics (Gutzwiller et al., Citation2002). The ratio of HONO/NOx used in the model set up was about 1.18% in the urban centre of Beijing (Li et al., Citation2011; An et al., Citation2013). The rate constant for the reaction of NO2 * with H2O was estimated as 9.1×10⁻¹⁴ cm3 molecule−1 s−1 which was similar to the mean values of Li et al. (Citation2008) and Crowley and Carl (Citation1997). The NO2 heterogeneous reaction on aerosol surfaces followed Jacob (Citation2000) recommendations. To compute the reaction rate, the total aerosol surface area (S a) per unit volume of air is derived from aerosol mass concentrations and number density in eight size bins set by the MOSAIC aerosol module. The mean calculated S a was 1367 µm2 cm−3 in Beijing during August 2007, within the observed range of 1000–2500 µm2 cm−3 (Spataro et al., Citation2013).
2.2. Experimental design
Five simulations given in were conducted in this study. The first one was a reference case (Case R) that was performed using the standard CBM-Z mechanism and the MOSAIC module. Case Emis, Case NO2 * and Case Het were extensions of Case R by inclusion of HONO emissions, the NO2 * chemistry and the NO2 heterogeneous reaction, respectively. The last simulation referred as an enhanced case (Case E) contained all the three additional HONO sources. The simulation period was August 2007, during which an extensive observed dataset was obtained, including highly time-resolved ambient gas phase species and aerosols (shown in Section 3).
Table 1. Design of WRF–Chem simulations to evaluate the effects of the additional HONO sources
Additional sensitivity runs for the impacts of the three additional HONO sources on O3 and PM2.5 control strategies were conducted on 17 August 2007 when the BTH region experienced exceedingly high ozone and PM levels. The daily O3_8h;max in Beijing violated China's Grade-2 Standard values. In order to save the computational time, four emission scaling factors, i.e. 1, 0.75, 0.5 and 0.25, are employed. The reference case emissions (Zhang et al., Citation2009) of NOx, VOCs and NH3 were multiplied by the scaling factors individually, leading to 64 emission scenarios. The 128 (64×2) sensitivity simulations were conducted for Domain 3. The first 64 scenarios employed the standard CBM-Z and MOSAIC modules and the remaining 64 scenarios included the three additional HONO sources. All of the simulations started with the initial conditions at 00:00/16/8/2007 (UTC) using the standard CBM-Z and MOSAIC modules for the reference case emissions, then they were integrated from 00:00/16/8/2007 to 00:00/18/8/2007 (UTC) under different emission scenarios.
3. Observations and data
The HONO concentrations were measured on a 24-h basis by the annular denuder system at the campus of Peking University (39.99°N, 116.28°E) from 2 to 31 August 2007 as part of the CAREBeijing-2007 Experiment (2007 Campaigns of Air Quality Research in Beijing; Spataro et al., Citation2013). Measurements of NO2, nitrate () and ammonium (
) were also used in this study (Ianniello et al., Citation2011). Hourly HONO concentrations were taken from Differential Optical Absorption Spectroscopy (DOAS) measurements in Beijing from 13 to 25 August 2007 (Zhu et al., Citation2009). The retroreflector array was placed on a platform at 15 m of the 325 m Meteorological Tower located at the Institute of Atmospheric Physics (IAP; 39.97°N, 116.37°E). The fixed light path was 470 m (one way) across an expressway (Li et al., Citation2011). Hourly measurements of meteorological parameters including air temperature (T), relative humidity (RH), wind speed (WS) and direction (WD) from 13 to 20 August were adopted from the Olympic Village (40.00°N, 116.37°E) site close to IAP because the observed meteorological data at the tower site were unavailable within the studied period. There was no precipitation happening during this period. Observations of the surface NO2, O3 and PM2.5 concentrations over the BTH region were obtained from the Beijing Atmospheric Environmental Monitoring Action which was supported by the Beijing Olympic Technological Project (Xin et al., Citation2010; Gao et al., Citation2011). Hourly measurements of NO2, O3 and PM2.5 at seven urban sites shown in (Li et al., Citation2011) were used in the analysis.
4. Results and discussion
4.1. Model validation
Previously, the comprehensive model evaluations have been conducted for Case Emis, Case NO2
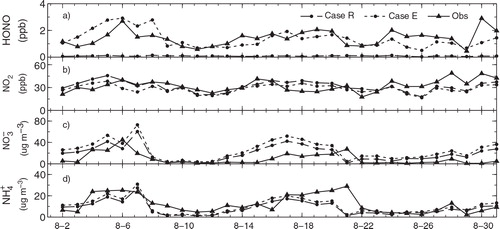
* and Case Het (Li et al.,Citation2011; An et al., Citation2013; Tang et al., Citation2014). In this section, the simulation results for Case R and Case E are evaluated to examine the performance of the extended WRF-Chem model with the three additional HONO sources. shows the simulations of 24-h average concentrations of HONO, NO2, and
compared to the measurements conducted at Peking University in Beijing during August 2007. The mean simulated HONO concentration is only 0.08 ppb in Case R. When the additional HONO sources are considered for Case E, the mean HONO concentration is improved up to 1.36 ppb. This value is very close to the observed mean of 1.43 ppb (a). The NO2 concentrations in Case E are approximately 2–10 ppb lower than those in Case R (b), which is mostly due to the NO2 heterogeneous reaction on aerosol surfaces. Although the simulated NO2 agrees reasonably well with most of the observations (b), the simulated
overestimates the observations by 5–20% (c) for both Case R and Case E. This
overestimation was found in the whole Northeast Asian region (Kajino et al., Citation2012, Citation2013) and further investigation with additional observations is required. Both Case R and Case E well reproduce
variations and quantities (d). The correlation coefficient (R) is found as 0.59. The simulated mean
in Cases R and E are 8.55 and 10.27 µg m−3, respectively. The observed mean is 12.27 µg m−3. The additional HONO sources significantly enhanced
and
concentrations (c, d), and this resulted in an increase for PM2.5 concentrations (An et al., Citation2013).
Fig. 2 Comparison of simulated 24-h average (a) HONO, (b) NO2, (c) and (d)
concentrations with observations at Peking University during August 2007 (Ianniello et al., Citation2011; Spataro et al., Citation2013). Case R is a reference case; Case E includes the HONO emissions, NO2
* chemistry and NO2 heterogeneous reaction on aerosol surfaces.
The comparison between the simulated and observed hourly concentrations of HONO and OH at the Meteorological Tower in Beijing, NO2, O3 and PM2.5 at the seven urban sites over the BTH region are shown in the Supplementary file and our previous studies (Li et al., Citation2011; An et al., Citation2013; Tang et al., Citation2014). The simulations generally captured the diurnal variations of pollutants at different sites of the BTH region. The comparative statistics for Case E are given in . The variations of T, RH, WS and WD near the Meteorological Tower site are generally simulated well. During 13–20 August 2007 the high temperature and humidity values during low speed of southerly wind existed in Beijing. The meteorological conditions as well as the large emissions of NOx from the heavy traffic (An et al., Citation2009) nearby the sampling site resulted in the high HONO concentrations. The Case E average predicted HONO concentrations of 1.69 ppb agreed reasonably with the measured concentration of 1.27 ppb. The simulations of Case E also generally captured the hourly variations of NO2, O3 and PM2.5 at the seven urban sites over the BTH region, with the correlation coefficients being 0.52, 0.87 and 0.51, respectively. The FAC2 (fractions of simulated values within a factor of two of the observed values) for NO2, O3 and PM2.5 are 0.50, 0.62 and 0.64, respectively ().
Table 2. Statistics for comparison of the observed (Obs.) and simulated (Sim.) hourly data during August 13–20, 2007
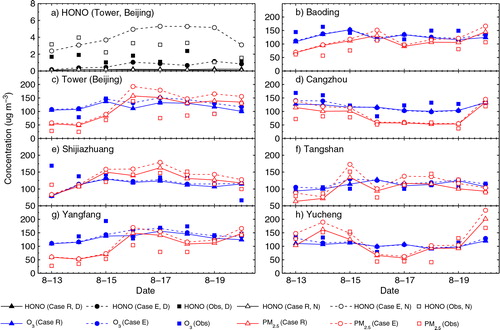
For daytime (7:00–19:00, LT) and night−time (20:00–6:00, LT) conditions, HONO simulations for Case R and Case E are compared with the observations for the Meteorological Tower (a). The additional HONO sources significantly improved HONO simulations for both daytime and night-time. The simulated mean concentration of HONO for daytime increased from 0.10 ppb in Case R to 0.51 ppb in Case E, and for night-time, it increased from 0.06 ppb to 2.05 ppb. b–h shows the daytime simulations of O3 and PM2.5 at the seven urban sites over the BTH region. Both Cases R and E performed well for predicting O3 and PM2.5 daytime concentrations. The observed and simulated means, the mean bias (MB), the normal mean bias (NMB), the root mean square error (RMSE) and FAC2 of O3 for Case E are 64.97 ppb, 63.05 ppb, −1.92 ppb, −2.95%, 12.48 ppb, and 0.98, respectively; corresponding PM2.5 values for Case E are 94.01 µg m−3, 119.24 µg m−3, 25.23 µg m−3, 26.83%, 36.05 µg m−3 and 0.91, respectively.
Fig. 3 Observed and simulated (a) daytime (D, 7:00–19:00) and night-time (N, 20:00–6:00) mean concentrations of HONO at the Beijing Meteorological Tower site and (b–h) daytime mean concentrations of O3 and PM2.5 at the seven urban sites over the BTH region during 13–20 August, 2007. The unit used is µg m−3 (at 1.01325×10⁵ Pa and 25°C, 1 µg m−3 is ~0.52 ppb for HONO and ~0.51 ppb for O3).
4.2. Daytime enhancements of O3 and PM2.5 due to the additional HONO sources
4.2.1. The chemical coupling between O3 and PM2.5
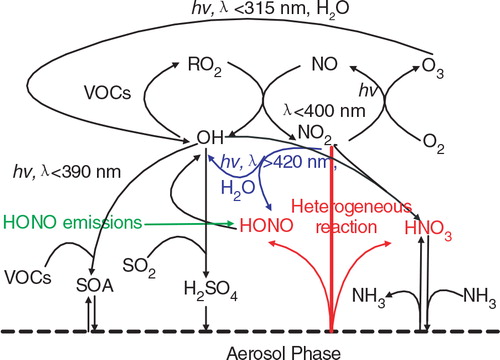
The chemical coupling between O3 and PM2.5 was emphasised in previous studies (Meng et al., Citation1997; Nguyen and Dabdub, Citation2002; Wennberg and Dabdub, Citation2008). This is of profound importance in understanding processes that control the concentrations of both O3 and PM2.5. As shown in , OH is the essential oxidant during daytime. The OH oxidises VOC to produce O3 in presence of NOx and oxidises SO2 and NOx to produce secondary inorganic particulate in presence of NH3. OH and O3 attack on organic molecules can generate semivolatile secondary organic aerosol (SOA). HONO sources add another level of complexity to this mechanism. When the HONO emissions, NO2 * chemistry and NO2 heterogeneous reaction on aerosol surfaces are considered, the OH formation is increased via the HONO photolysis and reaction of NO2 * with H2O. The increases in OH concentrations simultaneously enhance O3 and PM2.5 production. In addition, increasing O3 concentration further increases the daytime formation of OH. The OH in turn reacts with NO2 to form gas nitric acid (HNO3). The NO2 heterogeneous reaction on aerosol surfaces also contributes to HNO3 enhancement, which eventually increases nitrate concentrations.
Fig. 4 Impacts of the additional HONO sources on the chemical coupling between ozone and particulate matter. HONO sources increase OH concentrations and subsequently promote O3 and PM production. HNO3 produced from the NO2 heterogeneous reaction on aerosol surfaces enhances nitrate concentrations in presence of NH3.
Although O3 and PM2.5 are subjected to a complex series of common emissions and photochemical production pathways, the coupling between O3 and PM2.5 is in a non-linear manner. O3 production is related mainly to the VOCs and NOx gas-phase chemistry while PM2.5 production is contributed mostly to the gas-to-particle conversion processes, involving chemical reactions and mass transport in the gas and particle phases (Shiraiwa et al., Citation2014). The impacts of the additional HONO sources on O3 and PM enhancements are found to be more significant over urban and coastal areas with high NOx emissions. On the other hand, the impacts are small in rural and background areas where NOx emissions are relatively low (Wennberg and Dabdub, Citation2008; Sarwar et al., Citation2009; An et al., Citation2011; Li et al., Citation2011; Elshorbany et al., Citation2012, Citation2014; Jorba et al., Citation2012; Zhang et al., Citation2013). In the regions with high VOCs to NOx ratios (e.g. rural areas), O3 production is sensitive to NOx concentrations. The NO2 reductions due to the NO2 heterogeneous reaction can decrease O3 production in rural areas. Therefore, the additional HONO sources are more likely to enhance O3 and PM2.5 simultaneously in urban areas with a low ratio of VOCs to NOx. In those areas, decreasing NO2 alone likely leads to increasing O3 concentrations (Wennberg and Dabdub, Citation2008; Ensberg et al., Citation2010).
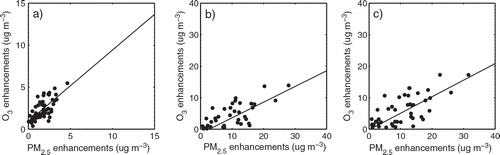
In order to investigate the impacts of the additional HONO sources on O3 and PM2.5 chemical interactions, the enhancements of daytime mean concentrations of O3 and PM2.5 at the seven urban sites during 13–20 August 2007 shown in are demonstrated in scatter diagrams (). Both O3 and PM2.5 daytime enhancements (a) due to the NO2 * chemistry are mostly less than 5 µg m−3 (for O3, 1 µg m−3=0.51 ppb at 1.01325×10⁵ Pa and 25°C). Among the three additional HONO sources, the NO2 heterogeneous reaction is the largest contributor to O3 and PM2.5 enhancements. Up to 14 µg m−3 (7 ppb) and 28 µg m−3 increases are found for O3 and PM2.5, respectively (b).The contributions of HONO emissions to O3 and PM2.5 enhancements are relatively small (<2 µg m−3; not shown).The largest enhancements of daytime concentrations of O3 and PM2.5 due to all the three additional HONO sources are estimated to be 17.27 µg m−3 (8.79 ppb) for O3 and 31.54 µg m−3 for PM2.5 (c). also clearly shows that the daytime O3 increases are closely related to the daytime PM2.5 increases. The correlation coefficients between O3 and PM2.5 enhancements are 0.71 and 0.75, respectively, when the NO2 * chemistry and NO2 heterogeneous reaction are individually included in the WRF-Chem model.
Fig. 5 Enhancements of daytime mean concentrations of O3 and PM2.5 due to (a) the NO2 * chemistry (b) the NO2 heterogeneous reaction on aerosols and (c) all the three additional HONO sources at the seven urban sites demonstrated in during 13–20 August, 2007.
The correlation coefficient between the daytime enhancement of O3 and PM2.5 over the BTH region for the whole month was estimated. As shown in a, the correlation coefficients between O3 and PM2.5 daytime enhancements due to the additional HONO sources are greater than 0.6 in many urban areas and greater than 0.8 over Beijing and Tianjin areas. The high correlation is found mainly over the urban areas where the values of the linear-fitting slope for O3 and PM2.5 enhancements are above zero (b), indicating that the additional HONO sources increase O3 and PM2.5 concentrations simultaneously. The increases in both O3 and PM2.5 are because of the enhanced OH concentrations as demonstrated in . The significant increases in O3 concentrations occur in urban areas also because O3 production is mainly sensitive to VOC concentrations in those areas, where the NO2 decreases due to the NO2 heterogeneous reaction increase O3. As shown in c, 2–5 ppb increases in the monthly mean daytime O3 concentrations are found in Beijing, Tianjin and south of Hebei Province.
Fig. 6 Values of (a) the correlation coefficient and (b) the linear-fitting slope for O3 and PM2.5 daytime enhancements due to the three additional HONO sources during August 2007; monthly mean daytime (c) O3 enhancements due to the three additional HONO sources and (d) H2O2/HNO3 ratio over the BTH region.
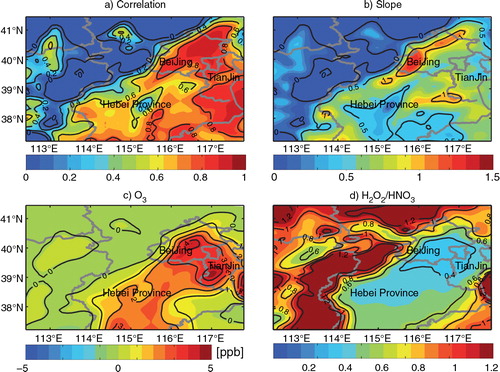
The ratio of H2O2/HNO3 is often used as an indicator to identify VOC-sensitive or NOx-sensitive regimes (Sillman, Citation1995; Lam et al., Citation2005). The transition value of 0.4–0.8 is adopted in this study according to the field measurements conducted in Beijing (He et al., Citation2010): a value<0.4 indicates a VOC-sensitive regime, a value>0.8 indicates a NOx-sensitive regime, and otherwise it indicates an intermediate regime (d). Comparing a and d, it is found that the low correlation (<0.2) between O3 and PM2.5 daytime enhancements occurs mainly over the rural areas, such as Taihang Mountains to the west of Hebei Province, and Yan Mountains to the north of Beijing. Those rural areas are within the NOx-sensitive regimes where NO2 decreases due to the NO2 heterogeneous reaction (see b and Li et al., Citation2011) will reduce O3 (c). Daytime enhancements of O3 and PM2.5 for all the simulated grids within the BTH region during August 2007 are presented in Supplementary Fig. 5. The correlation coefficients between O3 and PM2.5 daytime enhancements are estimated as 0.83, 0.91 and 0.90, for the NO2 * chemistry, NO2 heterogeneous reaction and the three additional HONO sources included in the simulations, respectively.
4.2.2. Impacts on concentrations of PM2.5 and its major components
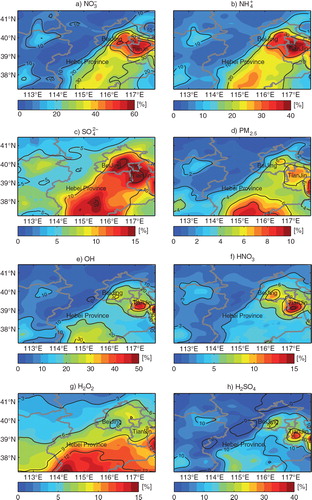
The additional HONO sources enhance O3 production mainly through increasing OH concentrations which will enhance PM2.5 production as well. However, the coupling between O3 and PM2.5 production is in a non-linear way. As stated in , PM2.5 production also involves complex gas precursors that go through multiphase chemical evolution. shows that the impacts of the additional HONO sources on individual PM2.5 components during daytime. has the largest enhancements (10–58%, 4–9 µg m−3), followed by
(10–40%, 1–3 µg m−3) and
(5–18%, 0.5–1.5 µg m−3). The large increment is found mainly in areas with high NOx levels, e.g. Beijing, Tianjin and south of Hebei Province. The HONO-related enhancement of
is due to the enhanced OH level (10–40%, e) and the NO2 heterogeneous reaction that produces more HNO3 (f). The reason for the enhancement of
is that the increasing OH can oxidise SO2 to produce gas-phase H2SO4 and enhance H2O2 (g) and O3 (c), which can oxidise dissolved SO2 to produce
through aqueous phase reactions. The increases in HNO3 and H2SO4 can be neutralised by NH3 to form
. The NO2 heterogeneous reaction and H2O2 enhancements are major reasons for night-time enhancements of PM2.5 and its major components (Supplementary Fig. 6) and the contributions of the individual HONO sources to PM2.5 and its major inorganic components can be found in An et al. (Citation2013).
Fig. 7 Percentage increases of monthly-mean daytime (a) , (b)
and (c)
in PM2.5 and (d) PM2.5, (e) OH, (f) HNO3, (g) H2O2 and (h) H2SO4 concentrations over the BTH region during August 2007 due to the three additional HONO sources.
Monthly-mean concentrations of PM2.5 and its major components characterised by the MOSAIC aerosol module in the WRF-Chem are shown in Supplementary Fig. 7. It should be noted that the formation of SOA is not taken into account in this study. Organic aerosol, especially SOA could contribute significantly to PM2.5. In-situ observations showed that OA on average accounted for approximate 40% of submicron aerosols in Beijing during summertime, and SOA dominated OA, contributing 64% (Sun et al., Citation2012 and references therein). However, the complexity involved in SOA formation makes SOA difficult to be simulated well. Current air quality models have generally underpredicted observed SOA concentrations, with model-measurement discrepancies of a factor of two or more. More recent modelling efforts incorporating a number of additional factors such as new SOA precursors and particle phase chemistry, have begun to close the gap between predicted and measured SOA concentrations. But even for cases when simulations show reasonable agreement with measurements, the agreement may not be for the right reasons (Hallquist et al., Citation2009). The impacts of the additional HONO sources on SOA concentrations will be considered in following studies since the enhancement of the oxidants augments the production of semi-VOCs, which are apt to partition more to particle phase and further escalates the SOA concentrations (Li et al., Citation2010).
4.3. Sensitivity of O3 and PM2.5 to the additional HONO sources
Impacts of the additional HONO sources on the O3 and PM2.5 chemical coupling require rethinking of their control strategies. Meng et al. (Citation1997) suggested that attempts to reduce PM levels required control of the NOx and VOC emissions that are also precursors to O3 formation. The O3 control strategies rely primarily on NOx and VOC emission variations. The urban areas of Beijing are often in a VOC-sensitive regime for ozone chemistry (see d and Wang et al., Citation2006). This section mainly presents the simulation results for Beijing Meteorological Tower, where the traffic emissions are large (An et al., Citation2009).
The resulting peak 8-h average ozone isopleths are shown in . a shows that with decreased VOC emissions, O3_8h;max concentrations are reduced steadily, whereas a decrease in NOx emissions over 50% is necessary to obtain the O3 reduction. b shows the differences in O3_8h;max concentrations between Cases E and R. The additional HONO sources increase O3_8h;max concentrations but the enhancements decline as NOx emissions decrease, indicating that the impacts of the additional HONO sources on O3 are significant in areas with high NOx emissions (Sarwar et al., Citation2009; Ensberg et al., Citation2010).
Fig. 8 Impacts of the additional HONO sources on O3_8h;max concentrations resulting from the control of NOx, VOC and NH3 emissions. (a) O3_8h;max concentrations for Case R in Beijing on 17 August 2007; (b) O3_8h;max concentrations for Case E minus those for Case R; (c) ratio of Relative Reduction Factors (RRF) for Case E divided by RRF for Case R.
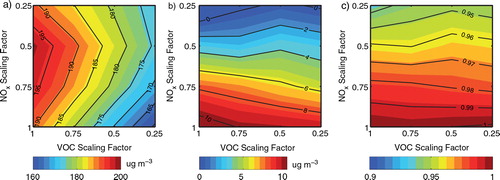
In regulatory applications, the relative reduction factors (RRF) can be used to reflect control strategy effectiveness. RRF for a given pair of VOCs and NOx reduction factors, RRF (f VOC, f NOx), are calculated as the ratio of O3_8h;max resulting from that particular pair (f VOC, f NOx) divided by O3_8h;max from f VOC=1.0 and f NOx=1.0 (Hogrefe et al., Citation2008). c presents the ratio of the RRF obtained in Case E divided by that obtained in Case R. The RRF ratios are below one under nearly all control scenarios, illustrating that the enhanced HONO sources increase the effectiveness of the control strategies in reducing O3 concentrations, especially through NOx emission decreases. For example, when the additional HONO sources are considered, a reduction of 75% in emitted NOx leads to an O3 reduction of 6.5% more than the O3 reduction obtained in a case without the additional HONO sources. The RRF in Case E is up to 7% lower than that in Case R, similar to the results obtained in Los Angeles where the NO2 * chemistry produced RRF 5% lower than that in the reference case (Ensberg et al., Citation2010).
The additional HONO sources also affect PM2.5 control strategies. shows isopleths of the 24-h average concentrations of PM2.5 for Cases R and E. Although PM2.5 decreases with any reductions of NOx, VOCs or NH3 emissions in both cases, the additional HONO sources induce more reductions of PM2.5 in Case E than those in Case R. For example, when the NOx reduction factor declines from 1 to 0.25, PM2.5 is decreased from 143.1 µg m−3to 123.8 µg m−3, with a reduction of 13.5% in Case R (a), whereas PM2.5 is decreased from 163.1 µg m−3 to 128.6 µg m−3, with a reduction of 21.1% in Case E (d).
Fig. 9 Twenty four-hour average PM2.5 concentrations for Case R (a–c) and for Case E (d–f) in Beijing on 17 August 2007.
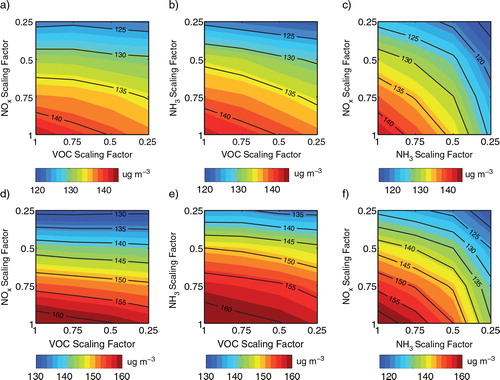
The present results are found to be in agreement with previous studies. Ensberg et al. (Citation2010) showed that the NO2 * chemistry increases the sensitivity of particle formation to changes in NOx emissions. In addition, the results in this study show that the three additional HONO sources also increase the sensitivity of PM2.5 formation to changes in NH3 emissions. Comparing b and e, the number of isopleths in Case E is more than that in Case R as NH3 emissions are reduced, indicating that a decrease in NH3 emissions leads to more PM2.5 reduction in Case E than that in Case R. c and f show that reducing NOx and NH3 emissions simultaneously results in significant decreases in PM2.5 concentrations. When NOx and NH3 reduction factors decrease from 1 to 0.25, the PM2.5 reduction in Case E is found to be 8% larger than that in Case R.
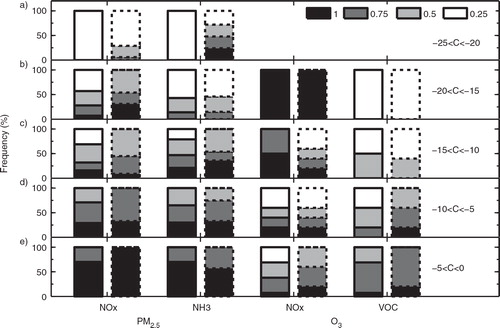
To better understand the effects of the additional HONO sources on PM2.5 and O3 control strategies, illustrates how many times the concentration reductions of PM2.5 and O3 fall in a certain range due to the emission reductions of NOx, VOCs and NH3. Among the 64 sensitivity simulations (see Section 2.2), the number of large reductions of PM2.5 or O3 in Case E is more than that in Case R. For example, the number of PM2.5 reductions in the range of −25 to −20% is 17 in Case E, whereas that in Case R is 4. The number of O3 reductions in the range of −15 to −10% is 20 in Case E, much larger than that of 8 in Case R. further shows that within the same range of PM2.5 or O3 reductions in Cases R and E, the frequency of large decreases in pollutant emissions is much less in Case E than that in Case R. For example, the frequency of NOx, VOC and NH3 reduction factors of 0.25 is less in Case E than that in Case R in a certain range of PM2.5 or O3 concentration reductions. The frequency of 50%decreases in NOx and NH3 emissions in Case E for the PM2.5 reductions between −10 and −5% is also much smaller than that in Case R (d). These results further indicate that the additional HONO sources enhance the effectiveness of control strategies for reducing PM2.5 and O3 concentrations.
Fig. 10 The number of concentration reductions (C, with unit of %) of (a) PM2.5 in Case R, (b) PM2.5 in Case E, (c) O3 in Case R, and (d) O3 in Case E in a certain reduction range among the sensitivity simulations using the 64 emission scenarios (see Section 2.2).
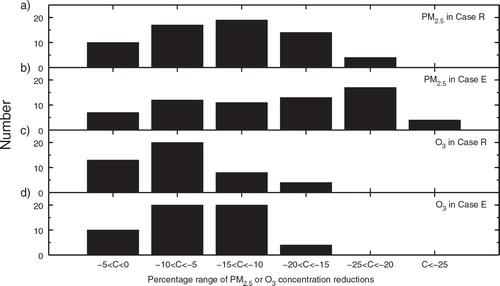
Fig. 11 Comparison of NOx, VOC and NH3 emission reductions between Case R (bars with solid baselines) and Case E (bars with dotted baselines) to gain the same range of PM2.5 or O3 concentration reductions (C, in unit of %) of (a) −25%<C<−20%; (b) −20%<C<−15%; (c) −15%<C< −10%; (d) −10%<C<−5%; and (e) −5%<C<0. The frequency for each scaling factor is computed by T i/T, where T is the total times for PM2.5 or O3 concentration reductions falling in a certain reduction range; T i is the occurrence times within T for a specific scaling factor (1, 0.75, 0.5 or 0.25 shown in Section 2.2).
5. Conclusions
Three additional HONO sources, i.e. the HONO emissions, NO2 * chemistry and NO2 heterogeneous reaction on aerosol surfaces, were added into a fully coupled meteorology–chemistry model called WRF-Chem to examine how the additional HONO sources influence O3 and PM2.5 chemical coupling and their control strategies. The following main conclusions are obtained from the current study:
The three additional HONO sources significantly increased daytime O3 and PM2.5 concentrations over the urban areas of the BTH region. The enhancements of up to 9 ppb for O3 and 32 µg m−3 for PM2.5 are found at the seven urban sites during August 2007. The NO2 heterogeneous reaction on aerosol surfaces is the largest contributor to the enhancements of O3 and PM2.5 during daytime.
The O3 increases are found to be closely associated with PM2.5 increases over VOC-sensitive regimes during daytime when the additional HONO sources are considered. The correlation coefficient between O3 and PM2.5 daytime enhancements is estimated to be greater than 0.6 in many urban areas of the BTH region and>0.8 over Beijing and Tianjin areas.
The additional HONO sources enhance PM2.5 components of
,
The changes in O3 and PM2.5 concentrations under a variety of NOx, VOC and NH3 emission reduction scenarios revealed that the additional HONO sources enhanced the effectiveness of control strategies for reducing O3 and PM2.5 concentrations.
A decrease in NOx emissions produced more decreases in O3 concentrations when the additional HONO sources were included. The additional HONO sources resulted in the O3 RRF 7% lower than that in the reference case and this is consistent with the recent study conducted for the South Coast Air Basin of California (Ensberg et al., Citation2010).
The additional HONO sources significantly increased PM2.5 sensitivity to the changes in NOx and NH3 emissions.
The results presented in this study suggest that the complex chemical interactions between O3 and PM2.5 need better explanations when the additional HONO sources are considered. Without considering the additional HONO sources, the effectiveness of emission control strategies in reducing O3 and PM2.5 concentrations would be underestimated significantly. The effects of HONO sources on SOA concentrations will be evaluated in the following studies.
Supplementary Figures
Download PDF (2.3 MB)6. Acknowledgements
The research was partly supported by the National Natural Science Foundation of China (Grant No. 41405121 and 41175105), the Beijing Municipal Natural Science Foundation (Grant No. 8144054), the Key Project of Chinese Academy of Sciences (XDB05030301), and the Carbon and Nitrogen Cycle project of Institute of Atmospheric Physics, Chinese Academy of Sciences. Special thanks are given to Prof. Pinhua Xie from Anhui Institute of Optics and Fine Mechanics, Chinese Academy of Sciences for providing hourly HONO observations in Beijing and Dr. Bo Hu and Dongsheng Ji from the Chinese Ecosystem Research Network (CERN). NO2, O3 and PM2.5 observed data at seven sites over the BTH region were obtained from the CERN.
Notes
To access the supplementary material to this article, please see Supplementary files under ‘Article Tools’.
References
- Alicke B. , Platt U. , Stutz J . Impact of nitrous acid photolysis on the total hydroxyl radical budget during the Limitation of Oxidant Production/Pianura Padana Produzione di Ozono study in Milan. J. Geophys. Res. 2002; 107(D22): 8196.
- Amedro D. , Parker A. E. , Schoemaecker C. , Fittschen C . Direct observation of OH radicals after 565 nm multi-photon excitation of NO2 in the presence of H2O. Chem. Phys. Lett. 2011; 513: 12–16.
- An J. , Li Y. , Chen Y. , Li J. , Qu Y. , co-author . Enhancements of major aerosol components due to three HONO sources in the North China Plain (NCP) and implications for visibility and haze. Adv. Atmos. Sci. 2013; 30(1): 57–66.
- An J. , Li Y. , Wang F. , Xie P . Mazzeo N . Impacts of photoexcited NO2 chemistry and heterogeneous reactions on concentrations of O3 and NOy in Beijing, Tianjin and Hebei Province of China. Air Quality-Models and Applications. 2011; Rijeka: InTech. 197–210.
- An J. , Zhang W. , Qu Y . Impacts of a strong cold front on concentrations of HONO, HCHO, O3, and NO2 in the heavy traffic urban area of Beijing. Atmos. Environ. 2009; 43: 3454–3459.
- Carr S. , Heard D. , Blitz M . Comment on “Atmospheric hydroxyl radical production from electronically excited NO2 and H2O”. Science. 2009; 324(5925): 336.
- Chan C. K. , Yao X . Air pollution in mega cities in China. Atmos. Environ. 2008; 42(1): 1–42.
- Crowley J. N. , Carl S. A . OH formation in the photoexcitation of NO2 beyond the dissociation threshold in the presence of water vapor. J. Phys. Chem. A. 1997; 101(23): 4178–4184.
- Elshorbany Y. F. , Crutzen P. J. , Steil B. , Pozzer A. , Tost H. , co-author . Global and regional impacts of HONO on the chemical composition of clouds and aerosols. Atmos. Chem. Phys. 2014; 14: 1167–1184.
- Elshorbany Y. F. , Steil B. , Brühl C. , Lelieveld J . Impact of HONO on global atmospheric chemistry calculated with an empirical parameterization in the EMAC model. Atmos. Chem. Phys. 2012; 12: 9977–10000.
- Emmons L. , Walters S. , Hess P. , Lamarque J. , Pfister G. , co-authors . Description and evaluation of the Model for Ozone and Related chemical Tracers, version 4 (MOZART-4). Geosci. Model Dev. 2010; 3: 43–67.
- Ensberg J. J. , Carreras-Sospedra M. , Dabdub D . Impacts of electronically photo-excited NO2 on air pollution in the South Coast Air Basin of California. Atmos. Chem. Phys. 2010; 10: 1171–1181.
- Fast J. D. , Gustafson W. I. Jr. , Easter R. C. , Zaveri R. A. , Barnard J. C. , co-authors . Evolution of ozone, particulates, and aerosol direct radiative forcing in the vicinity of Houston using a fully coupled meteorology-chemistry-aerosol model. J. Geophys. Res. 2006; 111: 21305.
- Finlayson-Pitts B. , Wingen L. , Sumner A. , Syomin D. , Ramazan K . The heterogeneous hydrolysis of NO2 in laboratory systems and in outdoor and indoor atmospheres: an integrated mechanism. Phys. Chem. Chem. Phys. 2003; 5(2): 223–242.
- Foley K. , Roselle S. , Appel K. , Bhave P. , Pleim J. , co-authors . Incremental testing of the Community Multiscale Air Quality (CMAQ) modeling system version 4.7. Geosci. Model Dev. 2010; 3(1): 205–226.
- Gao Y. , Liu X. , Zhao C. , Zhang M . Emission controls versus meteorological conditions in determining aerosol concentrations in Beijing during the 2008 Olympic Games. Atmos. Chem. Phys. 2011; 11: 12437–12451.
- Grell G. A. , Peckham S. E. , Schmitz R. , McKeen S. A. , Frost G. , co-authors . Fully coupled “online” chemistry within the WRF model. Atmos. Environ. 2005; 39: 6957–6975.
- Guenther A. B. , Zimmerman P. R. , Harley P. C. , Monson R. K. , Fall R . Isoprene and monoterpene emission rate variability: model evaluations and sensitivity analyses. J. Geophys. Res. 1993; 98(D7): 12609–12617.
- Gutzwiller L. , Arens F. , Baltensperger U. , Gaggeler H. W. , Ammann M . Significance of semivolatile diesel exhaust organics for secondary HONO formation. Environ. Sci. Technol. 2002; 36(4): 677–682.
- Hallquist M. , Wenger J. , Baltensperger U. , Rudich Y. , Simpson D. , co-authors . The formation, properties and impact of secondary organic aerosol: current and emerging issues. Atmos. Chem. Phys. 2009; 9: 5155–5236.
- He S. Z. , Chen Z. M. , Zhang X. , Zhao Y. , Huang D. M. , co-authors . Measurement of atmospheric hydrogen peroxide and organic peroxides in Beijing before and during the 2008 Olympic Games: chemical and physical factors influencing their concentrations. J. Geophys. Res. 2010; 115: 17307.
- Hogrefe C. , Civerolo K. L. , Hao W. , Ku J. Y. , Zalewsky E. E. , co-author . Rethinking the assessment of photochemical modeling systems in air quality planning applications. J. Air Waste Manage. Assoc. 2008; 58(8): 1086–1099.
- Ianniello A. , Spataro F. , Esposito G. , Allegrini I. , Hu M. , co-author . Chemical characteristics of inorganic ammonium salts in PM2.5 in the atmosphere of Beijing (China). Atmos. Chem. Phys. 2011; 11: 10803–10822.
- Jacob D. J . Heterogeneous chemistry and tropospheric ozone. Atmos. Environ. 2000; 34: 2131–2159.
- Jenkin M. , Utembe S. , Derwent R . Modelling the impact of elevated primary NO2 and HONO emissions on regional scale oxidant formation in the UK. Atmos. Environ. 2008; 42(2): 323–336.
- Jenkin M. E. , Cox R. A. , Williams D. J . Laboratory studies of the kinetics of formation of nitrous acid from the thermal reaction of nitrogen dioxide and water vapour. Atmos. Environ. (1967) . 1988; 22(3): 487–498.
- Jorba O. , Dabdub D. , Blaszczak-Boxe C. , Pérez C. , Janjic Z. , co-authors . Potential significance of photoexcited NO2 on global air quality with the NMMB/BSC chemical transport model. J. Geophys. Res. 2012; 117: 13301.
- Kajino M. , Inomata Y. , Sato K. , Ueda H. , Han Z. , co-authors . Development of an aerosol chemical transport model RAQM2 and predications of Northeast Asian aerosol mass, size, chemistry, and missing type. Atmos. Chem. Phys. 2012; 12: 11833–11856.
- Kajino M. , Sato K. , Inomata Y. , Ueda H . Source-receptor relationships of nitrate in Northeast Asia and influence of sea salt on the long-range transport of nitrate. Atmos. Environ. 2013; 79: 67–78.
- Kleffmann J. , Becker K. , Wiesen P . Heterogeneous NO2 conversion processes on acid surfaces: possible atmospheric implications. Atmos. Environ. 1998; 32(16): 2721–2729.
- Kleffmann J. , Gavriloaiei T. , Hofzumahaus A. , Holland F. , Koppmann R. , co-authors . Daytime formation of nitrous acid: a major source of OH radicals in a forest. Geophys. Res. Lett. 2005; 32: 05818.
- Kurtenbach R. , Becker K. H. , Gomes J. A. G. , Kleffmann J. , Lörzer J. C. , co-authors . Investigations of emissions and heterogeneous formation of HONO in a road traffic tunnel. Atmos. Environ. 2001; 35: 3385–3394.
- Lam K. S. , Wang T. J. , Wu C. L. , Li Y. S . Study on an ozone episode in hot season in Hong Kong and transboundary air pollution over Pearl River Delta region of China. Atmos. Environ. 2005; 39: 1967–1977.
- Li G. , Lei W. , Zavala M. , Volkamer R. , Dusanter S. , co-authors . Impacts of HONO sources on the photochemistry in Mexico City during the MCMA-2006/MILAGO Campaign. Atmos. Chem. Phys. 2010; 10: 6551–6567.
- Li S. , Matthews J. , Sinha A . Atmospheric hydroxyl radical production from electronically excited NO2 and H2O. Science. 2008; 319: 1657–1660.
- Li Y. , An J. , Gultepe I . Effects of additional HONO sources on visibility over the North China Plain. Adv. Atmos. Sci. 2014; 31(5): 1221–1232.
- Li Y. , An J. , Min M. , Zhang W. , Wang F. , co-author . Impacts of HONO sources on the air quality in Beijing, Tianjin and Hebei Province of China. Atmos. Environ. 2011; 45(27): 4735–4744.
- Meng Z. , Dabdub D. , Seinfeld J. H . Chemical coupling between atmospheric ozone and particulate matter. Science. 1997; 277: 116–119.
- Nguyen K. , Dabdub D . NOx and VOC control and its effects on the formation of aerosols. Aerosol Sci. Tech. 2002; 36(5): 560–572.
- Oswald R. , Behrendt T. , Ermel M. , Wu D. , Su H. , co-author . HONO emissions from soil bacteria as a major source of atmospheric reactive nitrogen. Science. 2013; 341: 1233–1235. [PubMed Abstract].
- Sarwar G. , Pinder R. W. , Appel K. W. , Mathur R. , Carlton A. G . Examination of the impact of photoexcited NO2 chemistry on regional air quality. Atmos. Environ. 2009; 43: 6383–6387.
- Sarwar G. , Roselle S. J. , Mathur R. , Appel W. , Dennis R. L. , co-author . A comparison of CMAQ HONO predictions with observations from the Northeast Oxidant and Particle Study. Atmos. Environ. 2008; 42(23): 5760–5770.
- Shiraiwa M. , Berkemeier T. , Schilling-Fahnestock K.A. , Seinfeld J.H. , Pöschl U . Molecular corridors and kinetic regimes in the multiphase chemical evolution of secondary organic aerosol. Atmos. Chem. Phys. 2014; 14: 1–19.
- Sillman S . The use of NOy, H2O2, and HNO3 as indicators for ozone-NOx-hydrocarbon sensitivity in urban locations. J. Geophys. Res. 1995; 100(D7): 14175–14188.
- Simpson D. , Guenther A. , Hewitt C. N. , Steinbrecher R . Biogenic emissions in Europe: 1. Estimates and uncertainties. J. Geophys. Res. 1995; 100(D11): 22875–22890.
- Spataro F. , Ianniello A. , Esposito G. , Allegrini I. , Zhu T. , co-author . Occurrence of atmospheric nitrous acid in the urban area of Beijing (China). Sci. Total Environ. 2013; 447: 210–224. [PubMed Abstract].
- Sun Y. , Wang Z. , Dong H. , Yang T. , Li J. , co-authors . Characterization of summer organic and inorganic aerosols in Beijing, China with an aerosol chemical speciation monitor. Atmos. Environ. 2012; 51: 250–259.
- Sun Y. , Wang Z. , Fu P. , Yang T. , Jiang Q. , co-authors . Aerosol composition, sources and processes during wintertime in Beijing, China. Atmos. Chem. Phys. 2013; 13(9): 4577–4592.
- Tang Y. , An J. , Li Y. , Wang F . Uncertainty in the uptake coefficient for HONO formation on soot and its impacts on concentrations of major chemical components in the Beijing-Tianjin-Hebei region. Atmos. Environ. 2014; 84: 163–171.
- Wang T. , Ding A. , Gao J. , Wu W. S . Strong ozone production in urban plumes from Beijing, China. Geophys. Res. Lett. 2006; 33: 21806.
- Wennberg P. O. , Dabdub D . Rethinking ozone production. Science. 2008; 319: 1624–1625.
- Wu N. , Chen X . Two photon dissociation dynamics of NO2 and NO2+H2O. J. Phys. Chem. C. 2012; 116(25): 6894–6900.
- Xin J. , Wang Y. , Tang G. , Wang L. , Sun Y. , co-author . Variability and reduction of atmospheric pollutants in Beijing and its surrounding area during the Beijing 2008 Olympic Games. Chinese Sci. Bull. 2010; 55(18): 1937–1944.
- Zaveri R. A. , Easter R. C. , Fast J. D. , Peters L. K . Model for simulating aerosol interactions and chemistry (MOSAIC). J. Geophys. Res. 2008; 113: 13204.
- Zaveri R. A. , Peters L. K . A new lumped structure photochemical mechanism for large-scale applications. J. Geophys. Res. 1999; 104(D23): 30387–30415.
- Zhang Q. , Streets D. G. , Carmichael G. R. , He K. B. , Huo H. , co-authors . Asian emissions in 2006 for the NASA INTEX-B mission. Atmos. Chem. Phys. 2009; 9: 5131–5153.
- Zhang R. , Sarwar G. , Fung J. C. H. , Lau A. K. H . Role of photoexcited nitrogen dioxide chemistry on ozone formation and emission control strategy over the Pearl River Delta, China. Atmos. Res. 2013; 132–133: 332–344.
- Zhao X. , Zhao P. , Xu J. , Meng W. , Pu W. , co-authors . Analysis of a winter regional haze event and its formation mechanism in the North China Plain. Atmos. Chem. Phys. 2013; 13(11): 5685–5696.
- Zhu Y. , Hiu W. , Xie P. , Dou K. , Liu S. , co-authors . Observational study of atmospheric HONO in summer of Beijing. Environ. Sc. 2009; 30(6): 1567–1573. (in Chinese).