
Abstract
Using the regional climate model (RegCM4), optical depth and shortwave (SW) direct radiative forcing (DRF) of secondary organic aerosol (SOA) are investigated over China during the summer period. The biogenic emission and gas phase chemistry modules are updated to investigate α-pinene and limonene emissions and their reactions with atmosphere oxidants. The VBS (volatility basis set) model is implemented into RegCM4 to illustrate gas-particle partition process. During the study period (July 2006), the mean surface concentration and column burden of anthropogenic SOA (ASOA) over China are 1.90 µg m−3 and 4.50 mg m−3, respectively. The ones of biogenic SOA (BSOA) are 2.00 and 3.35 mg m−3, respectively. Monthly mean calculated optical depths (at 550 nm) are 0.020 and 0.013 for ASOA and BSOA. The domain averaged simulated ASOA direct SW radiative forcing at surface and at the top of atmosphere (TOA) are −1.21 and −0.66 W m−2. For BSOA, the surface and TOA SW DRF are −0.75 and −0.46 W m−2. The errors induced by applying optical parameters of primary organic aerosol for SOA DRF modelling are also accessed. For DRF at TOA, it will increase by 156 and 161% for ASOA and BSOA. Though the optical parameters applied in this study are still rough, especially for intermediate SOA, this is a first step to apply explicit optical parameters for both ASOA and BSOA in DRF estimation.
1. Introduction
Organic aerosol (OA) is one of the main components of fine particles (Hildemann et al., Citation1991; Zheng et al., Citation2005; Yang et al., Citation2011), and consists of primary organic aerosol (POA) and secondary organic aerosol (SOA). SOA is the oxidation product, which transfers to aerosol phase, of volatile organic compounds (VOC) and atmosphere oxidants. Observation results indicate that most organic matters (OM) are of secondary origin (Crosier et al., Citation2007). According to top-down estimates, best estimate of global SOA production from VOC oxidation is about 115 TgC yr−1 (Hallquist et al., Citation2009). Spracklen et al. (Citation2011) suggested a best estimate of 140 Tg (SOA) yr−1 for the global SOA source with aerosol mass spectrometer (AMS) observations and mentioned that in general, global models cannot explain the observed OA budget without somewhat artificial OA sources. Since fine aerosols have potentially a large climate effect (Shindell et al., Citation2013), the representations of SOA concentration, optical properties and their radiative forcing are necessary for regional and global climate modelling (Kanakidou et al., Citation2005). Here and due to the size of secondary organic particles (mostly observed in the fraction mode of aerosols), we focus our study on the SOA direct radiative effect in the shortwave (SW) region.
The complexity of VOC prevents explicit treatment of organic compounds in climate chemistry models, considering the computation expenses. Owing to Odum et al. (Citation1996), SOA formation from precursors can be accounted for by using two-product approach to describe organic gas/particle partition, which is implemented in air quality or climate-chemistry models (Schell et al., Citation2001; Chung and Seinfeld, Citation2002; Grell et al., Citation2005). The two-product thermodynamic partitioning cannot usually explain the observed growth rates due to organic vapours, but a parallel kinetic approach can lead to significant improvements in SOA formation (Riipinen et al., Citation2011). Depending on the aerosol microphysical representation, the thermodynamic partitioning generally leads to SOA mass in larger particles.
Although the semi-direct forcing may result in positive direct radiative forcing (DRF) in limited areas (Athanasopoulou et al., Citation2013), SOA mainly induces negative DRF at the surface due to light scattering properties. Global top of atmosphere (TOA) (surface) SW DRF of OM including SOA is estimated to be −0.018 W m−2 (−1.142 W m−2) by Seland et al. (Citation2008). Recently, more works discuss SOA versus POA DRF. Lihavainen et al. (Citation2009) first used observation data to calculate SOA DRF, which is in the range of –0.37 to −0.74 W m−2 at TOA at a remote continental site in Northern Finland. According to Myhre et al. (Citation2009), SOA represents a large fraction of OM, and contributes about −0.1 W m−2 DRF at TOA. Skeie et al. (Citation2011) pointed out that the fossil fuel and biofuel SOA direct and indirect radiative forcing (RF) are comparable to POA RF. Hoyle et al. (Citation2009) found that the SOA DRF is even stronger than the best estimation for POA in the IPCC assessment. Airborne measurements in North-Western Europe also indicate that semi-volatile OM and associated water uptake are responsible for the increase in aerosol optical depth (AOD) (Morgan et al., Citation2010). In addition, the anthropogenic and biogenic organic vapours can participate in nucleation of new particles, hence increasing atmospheric particle number. A large amount of biogenic organic vapours can lead to the formation of Extremely Low-Volatility Organic Compounds (ELVOCs), which can condense irreversibly to aerosol phase and enhance formation of cloud condensation nuclei (CCN) (Ehn et al., Citation2014). Several studies indicate that the biogenic SOA indirect radiative effect might be stronger than the direct effect in forecast areas (Spracklen et al., Citation2008; Scott et al., Citation2014). As observed, different simulations show a large variability in term of SOA RF estimations. This may be due to a large variability of SOA burden prediction (Myhre et al., Citation2013), and to different optical properties applied in models.
Among all the studies above, the optical properties of SOA are set equal to POA, and some models use similar refractive indices (RI) to sulphate in calculation of organic carbon optical properties (Myhre et al., Citation2007). Few have discussed the sensitivity of these properties to DRF. Zhang et al. (Citation2012a) discussed the error induced by using sulphate optical properties in nitrate aerosols DRF assessment, and the DRF can be underestimated by up to 6.2%. Similarly, we can expect errors induced by using POA optical properties for SOA.
Since photooxidation of toluene is one of the most important sources of urban SOA, and ozonolysis of α-pinene is one of the main source of biogenic SOA (Nakayama et al., Citation2010), many studies focusing on optical properties of SOA derived from toluene and α-pinene have been conducted. Nakayama et al. (Citation2010) suggested that nitrated and aromatic OAs can absorb solar radiation at shorter visible and UV wavelengths, thus contributing to ‘brown carbon’. As oxidation level increases, both real and imaginary RI decrease (Lambe et al., Citation2013). The laboratory-derived RI is in large range, due to different experiment environments, such as wavelengths (Nakayama et al., Citation2012, Citation2013), NOx levels (Yu et al., Citation2008; Zelenyuk et al., Citation2010; Kim et al., Citation2012; Nakayama et al., Citation2013), existence of seed aerosols (Schnaiter et al., Citation2005; Zelenyuk et al., Citation2010; Trainic et al., Citation2011; Zhong and Jang, Citation2011) and aqueous phase reactions (Zarzana et al., Citation2012). Variability should be added to SOA optical parameters within radiative transfer modelling (Kim et al., Citation2010; Cappa et al., Citation2011). Many works have been done to calculate optical parameters through model, for example, Barkey et al. (Citation2007) used a Genetic Algorithm search method to calculate the real part of SOA RI, and Redmond and Thompson (Citation2011) established a structure-property relationship for mid-visible RI of SOA.
China is a region of variable emissions, and has potentially high climate impact, but this region lacks existing assessments of SOA DRF. The regional climate model (RegCM4) couples chemistry/aerosol models, but lacks of SOA model. In this study, we introduce and evaluate a parameterisation of SOA and their optical properties in RegCM4. Also, we perform a regional estimation of SOA DRF over China and study its sensitivity to the choice of SOA optical properties. In section 2, we first introduce the simulation setups and the SOA parameterisation. Meteorology condition, simulated precursors’ emission and SOA concentrations are discussed in sections 3.1, 3.2 and 3.3, respectively. Simulated AOD and radiative forcing are discussed in section 3.4. The sensitivity studies to the choices of optical, hygroscopicity and size distribution parameters are discussed in section 3.5. The acronyms used in this study are described in for reference.
Table 1. Acronyms used in the texts
2. Material and methods
2.1. Model description and simulation domain
Our study is based on RegCM4, which is developed by Abdus Salam Internal Centre for Theoretical Physics (ICTP). This version and the versions before are widely applied in various regional climate research (Giorgi and Mearns, Citation1999; Giorgi et al., Citation2006; Solmon et al., Citation2012). The detailed description and evaluation of the model can be found in Giorgi et al. (Citation2012). Here we give a brief introduction to the model. RegCM4 is a hydrostatic, compressible, sigma vertical coordinate model, the dynamics of which are the same as the ones of hydrostatic version of meso-scale model MM5. The choices of physical parameterisation settings follow Solmon et al. (Citation2006), except that we use MIT-Emanuel cumulus parameterisation to describe moist convection, based on a sensitivity study by Singh et al. (Citation2006), which shows better performance over East Asia. The latest version of RegCM includes online biogenic emission (MEGAN) (Tawfik et al., Citation2012) and online gas-phase chemistry (CBMZ) (Shalaby et al., Citation2012), which are essential to SOA modelling. As for aerosols, we use a bulk aerosol scheme as described in Solmon et al. (Citation2006). However, to investigate SOA SW DRF, a SOA scheme is implemented into this model and described in section 2.2.
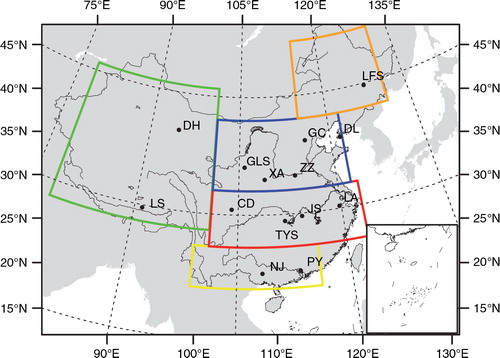
The simulation domain is centred in the middle of China (). The horizontal resolution is 50 km, and there are 18 vertical levels following σ coordinate system with a model top of 50 hPa. As the emissions of biogenic VOC are strong in summer time, and considering the computational efficiency, simulations are carried out for July in 2006 with a spin-up time of 15 d to better compare the difference between anthropogenic secondary organic aerosol (ASOA) and biogenic secondary organic aerosol (BSOA). The summer climate over China is mainly influenced by monsoon. According to Li and Zeng (Citation2002), the normalised 2006 East Asian summer monsoon index for the period of 1948–2012 is 0.625, which is close to climatological mean, indicating that the simulation time is a ‘normal’ July. NCEP (National Center for Environmental Prediction) re-analyses data (Kalnay et al., Citation1996) is used for dynamical initial and boundary conditions. The anthropogenic and biomass burning emissions are from ACCMIP emissions, detailed descriptions can be found in Shalaby et al. (Citation2012) and references therein. The climatological chemical boundary conditions are from global chemical transport model (MOZART), which are monthly averaged (Horowitz et al., Citation2003; Emmons et al., Citation2010) over the period 2000–2007.
Fig. 1 Research domain setting and geographical locations of the sites selected for model evaluation as well as five defined sub-regions of China (green box for West China, yellow box for South China, red box for Middle China, blue box for North China and orange box for Northeast China).
2.2. SOA formation
In this study, we use a four-bin volatility basis set (VBS), which is based on smog chamber studies (Murphy and Pandis, Citation2009), to describe OA partitioning process; the volatility bins have effective saturation concentrations of 1, 10, 100, and 1000 µg m−3 at 300 K. VBS approach, which is proposed by Donahue et al. (Citation2006) to better describe chemical evolutions of both primary and secondary organic materials, has been evaluated in different models over different regions, and proved to have improved performance especially in urban areas (Lane et al., Citation2008). The detailed description of VBS can be referred to in Ahmadov et al. (Citation2012). Alkanes with high OH reactivity and sesquiterpene are not included in our work, since their emissions are relatively low compared to other VOCs and their reactions with atmosphere oxidant are not explicitly described in CBMZ. Four additional gas phase and four additional aerosol phase tracers with four different volatilities are introduced to describe anthropogenic and biogenic semi-volatile oxidation products of VOC precursors in RegCM4. Those oxidation products may be further oxidised by hydroxyl radical. For example, the aging processes of anthropogenic semi-volatile oxidation products can be described as follows:1
Here GAORi denotes gas phase semi-volatile oxidation products of anthropogenic VOC precursors for bin i. The aging processes of biogenic ones are similar. All these reactions are implemented in CBMZ, applying a constant oxidation rate of 4×10⁻¹¹ cm3 molec−1s−1 (Shrivastava et al., Citation2008, Citation2011). According to Shrivastava et al. (Citation2011), primary organic vapour emission and chemical evolution for ‘2-species’ VBS are also implemented in RegCM, and the emission of the vapour is set at 6.5 times the POC emission.
2.3. SOA optical parameters
Radiative transfer physics are described through the CCM3 radiative transfer package (Kiehl et al., Citation1998), which includes scattering and absorption of solar radiation by aerosols. The coupling of SOA radiative effects and the meteorology is not considered in this study to better compare the results of different experiments in section 2.4. To reduce computation expenses, the calculation of optical properties is simplified. The extinction cross-section, the single scattering albedo, the asymmetry parameter and forward scattered fraction in 18 spectral intervals from 0.2 to 5 µm are pre-calculated through Mie theory and stored in a database.
The Mie code needs RI and particle size distribution parameters for input. As SOA is divided into two main categories in the model, anthropogenic aerosols and biogenic aerosols, the RI of anthropogenic and biogenic aerosols are set the same as the ones of toluene and α-pinene SOA, respectively. According to the results reported in the literatures (as shown in Table and 3 ), toluene and α-pinene SOA have different optical properties for both real and imaginary parts of RI. α-Pinene SOA has little absorbing effect in all wavelengths and a refractive index of 1.44 at 532 nm is recommended by Kim and Paulson (Citation2013). Wavelength dependence of RI is studied by Nakayama et al. (Citation2012) and Yu et al. (Citation2008), and both results come to a conclusion that RI will decrease with increasing wavelength. Linear polynomial fitting is done for the data listed in , and 1.48 and 1.42 are recommended for 350 and 700 nm BSOA refractive index, respectively. Toluene SOA is more dependent on NOX level for both real and imaginary part of RI (Nakayama et al., Citation2013). Since optical parameters need to be calculated ahead to save computation time, the NOX dependence of RI is not considered in this work. Same as α-pinene SOA, 1.53–0.0043 i and 1.43–0.0 i are used as RI of ASOA for 350 and 700 nm, respectively, through linear polynomial fitting of data in . The near-ultraviolet RI is achieved through linear interpolation, and the near-infrared optical parameters are set the same as the original parameters of OAs in RegCM; 1.5 g cm−3, 0.0212 µm, and 0.35 are adopted for mass density, modal radius and modal width of SOA, respectively (Kirkevåg et al., Citation2005).
Table 2. The refractive indices of α-pinene SOA under different wavelengths in literature
Table 3. The toluene refractive indices under different wavelengths in literature
2.4. Experiments
To investigate the sensitivity of RF by the choice of individual optical parameters for biogenic, anthropogenic, and intermediate SOA (ISOA), a series of experiments are designed, which are summarised in . Each experiment takes one category of SOA at a time in the radiative transfer calculation. The names of the experiments include ASOA (BSOA, ISOA) start with A (B, I). The size distribution of SOA is modified as bimodal log-normal (B in the experiment name) or unimodal log-normal (U in the experiment name) to study the RF sensitivity to particle size distribution. The optical parameters are set the same as the ones of mildly absorbing POA (P in the experiment name), non-absorbing POA (PN in the experiment name), or the ones of α-pinene and toluene SOA mentioned in section 2.3 (L in the experiment name). Since how the aerosols interact with water remains unclear, the RF differences between hydrophobic aerosols (D in the experiment name) and hydrophilic aerosols are discussed. As mentioned above, since the SOA radiative effects are not coupled with the meteorology, the corresponding VOC and SOA concentrations in each experiment are the same.
Table 4. Experiment settings including size distribution parameters, optical properties (at 550 nm) and category of SOA
3. Results and discussion
3.1. Mean meteorological conditions
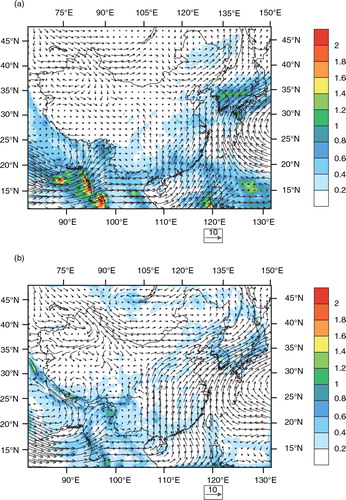
The cyclonic circulation over Northeast China simulated by RegCM (b) is in the same place as the NCEP reanalysis (a). RegCM 840 mb wind averaged over July is stronger over East China. The Eastward wind over the Bay of Bengal and the Westward wind over the Pacific Ocean are weaker in the model. The stronger 840 mb East wind of the model over North China tends to transport the tracers and particles to the regions over Eastern China seas. The model wind over South China is stronger than NCEP wind. Thus, the biogenic VOCs and particles may be transported to Northern parts. The precipitation of the model is generally weaker than the satellite observation, especially over the Bay of Bengal and the South Japan Sea. The precipitation is not well captured by the model over North China, where there are strong anthropogenic emissions. Thus, the wet removal of anthropogenic particles may be underestimated over this region. TRMM Precipitations are slightly heavier than the model over South China and Northeast China, where biogenic emissions are dominant. Wet removal of particles formed in these two regions may be slightly underestimated. Over Sichuan Basin, the model precipitation is heavier compared to TRMM. The wet removal may be overestimated accordingly.
Fig. 2 (a) NCEP Reanalysis 840 mb wind (m s−1) and TRMM precipitation (mm hr−1) field averaged over July 2006. (b) RegCM 840 mb wind field (m s−1) and precipitation (mm hr−1) averaged over July 2006.
3.2. SOA precursors emission
Online emissions of isoprene and monoterpene are calculated using MEGAN (Guenther et al., Citation2006; Tawfik et al., Citation2012). Due to the relatively high temperature in July, the simulated summer emission of isoprene over China is 2.52 Tg month−1, which is higher than results from other studies, such as 15.0 TgC yr−1 (Guenther et al., Citation1995), 4.1 TgC yr−1 (Klinger et al., Citation2002), 7.7 TgC yr−1 (Tie et al.,Citation2006) and 9.6 TgC yr−1 (Fu and Liao, Citation2012) in literature. Long-time simulation is required to assess more robust results and discuss interannual variability, which is beyond the scope of this study. The sum of α-pinene and limonene emission is 0.64 Tg month−1 over China, compared to 4.3 TgC yr−1, 3.5 TgC yr−1, 7.7 TgC yr−1 and 2.83 TgC yr−1 of monoterpene emission mentioned in the same literatures as isoprene emission, respectively. The spatial distributions of biogenic precursor emissions are similar between isoprene and monoterpene. Considering the land cover and the temperature, the emission mainly happens in South China and Northeast China (). Monthly anthropogenic and biomass burning emissions inventories are employed, according to Lamarque et al. (Citation2010). As illustrated on , North China and Sichuan Basin are the main anthropogenic emission contributors. The total anthropogenic emissions are 0.52 times larger than the Street and Zhang emission employed in Jiang et al. (Citation2012). Detailed emission statistics of SOA precursors can be referred to in .
Fig. 3 (a) Isoprene, (b) α-pinene, and (c) limonene emission (mg m−2 day−1) averaged over July 2006.
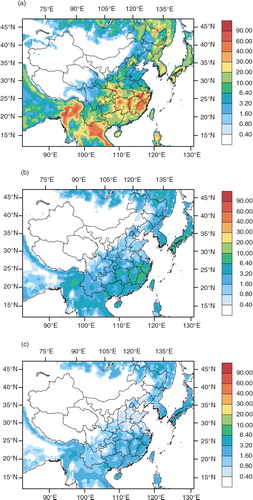
Fig. 4 (a) OC and (b) xylene emission (mg m−2 day−1) averaged over July 2006.
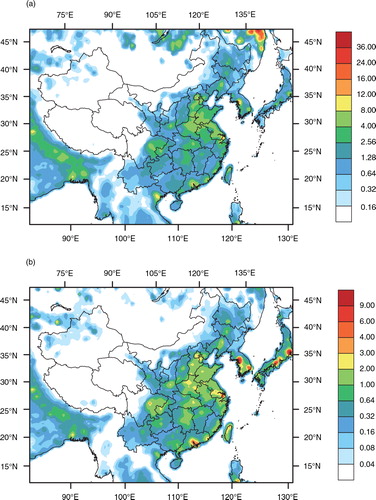
Table 5. Precursors’ simulated emission statistics over Chinaa
3.3. SOA concentration and evaluation
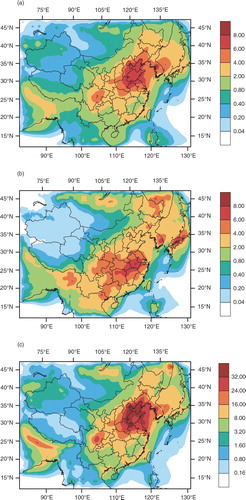
displays the simulated anthropogenic and biogenic SOA concentration at the lowest level of the model which is about 40 m. The anthropogenic SOA has a high concentration in North area (mainly to the North of 25°N) of China. For biogenic SOA, the concentration is high in Middle China and Northeast China. These patterns are consistent with precursor emission. As primary OM can absorb semi-VOC, both ASOA and BSOA concentrations are high over the Sichuan Basin.
Fig. 5 (a) ASOA, (b) BSOA, and (c) ISOA concentration (µg m−3) at model surface averaged over July 2006.
Vertical profile of SOA is a key factor to the understanding of column burden distribution. Observation results indicate the appearance of OA in free troposphere (2–6 km) (Heald et al., Citation2006) which can only be explained by the formation of SOA. Though aqueous phase reactions of VOC in cloud water are not included in the model, the SOA concentration is high in the upper level (), where SOA precursors and gas phase semi-VOC are transported by convection and vertical turbulence (), and the temperature is favoured by particle phase partitioning. Because of the Southward upper wind, the maximum concentration moves from North to South as altitude increases. Due to the oxidation of gas phase semi-VOC from high volatility to low volatility, the AOR1 and BOR1 SOA are the most abundant.
Fig. 6 Vertical distribution (µg m−3) of ASOA with effective saturation concentrations of (a) 1, (b) 10, (c) 100, (d) 1000 µg m−3 at 300 K and BSOA with effective saturation concentrations of (e) 1, (f) 10, (g) 100, (h) 1000 µg m−3 at 300 K averaged along longitude over July 2006.
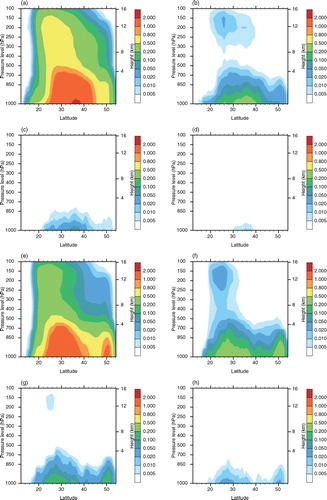
Table 6. Tendencies for tracer transport and chemistry at model surfacea
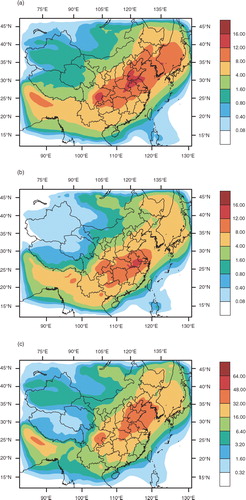
The column burdens are about 4.50 and 3.35 mg m−2 over China for ASOA and BSOA, which are much higher than the year-averaged total SOA of 2.58 mg m−2 by Jiang et al. (Citation2012). The two-product approach used in Jiang et al. (Citation2012) tends to underestimate SOA production against VBS approach. The distributions of ASOA and BSOA column burdens () are similar to the surface concentration distribution, except that the high values of ASOA column burden expand to Japan Sea. This shift is caused by the high concentration and Eastward wind in the model upper layer.
Fig. 7 (a) ASOA, (b) BSOA, and (c) ISOA column burden (mg m−2) averaged over July 2006.
shows different tendencies linked to tracer transport and chemistry. There is a higher production of SOA with lower volatility through chemical reactions. The model boundary layer scheme tends to produce quite strong vertical turbulence transport, which is the most important transport process. Nair et al. (Citation2012) also indicated that the aerosols would be underestimated because of the excessive vertical transport. As mentioned before, the uncaptured precipitation over North China by model leads to an underestimation of ASOA wet removal, thus the rainout and washout tendencies of ASOA should be in larger numbers. But the wet removal of the aerosols is apparently less important compared to other processes. The positive horizontal advection indicates a net aerosol transportation to China from outside. Since the winds in July are northward over South China, aerosols over Southeast Asia may be transported to China. The chemical reactions, turbulence transport, and convective transport processes are important for both ASOA and BSOA. Thus, more research should be conducted to improve the chemical evolution of SOA, and applicability of the boundary layer scheme and cumulus convection parameterisation over China should be tested.
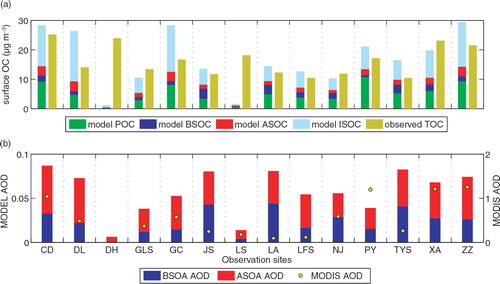
Because the observation of SOA concentration at surface is limited in the research region, the modelled OA concentration is evaluated. The observation data of OC in 14 various sites in China is from Zhang et al. (Citation2012b), and detailed information about the categories and geographic locations of the sites can be found there. There are six urban stations, including Chengdu (CD), Dalian (DL), Nanning (NJ), Panyu (PY), Xian (XA), and Zhengzhou (ZZ), which are usually 50–100 m above the city average elevation. The rural stations, including Dunhuang (DH), Gaolanshan (GLS), Gucheng (GC), Jinsha (JS), Lhasa (LS), LinAn (LA), Longfengshan (LFS), and Taiyangshan (TYS), are located distantly away from local sources. To be consistent with the observation data, the simulated OA and SOA concentrations are converted to OC and SOC concentrations. Here, we adopt ratios of 1.4 and 2.0 which are also used in Ahmadov et al. (Citation2012) and Murphy and Pandis (Citation2009), for ratios of OM to OC and SOM to SOC, respectively. Although a constant value is not suitable to describe all SOM with different oxidation level, the value represents a moderately oxygenated SOM (Aiken et al., Citation2008). As shown in a, since the VOC and POA emissions in the model are weak in both DH and LS, the simulated concentrations are considerably lower than observed. Compared to the observed total OC, the surface concentrations of traditional SOA (ASOA plus BSOA) are underestimated by 34.2% on average for the rest 12 sites. The surface zonal concentrations are distributed similar to the anthropogenic SOA (). ISOA production reduces the gap between observed and simulated OM, and the OC concentrations are even overestimated for most sites. Therefore, the emission factors of primary organic vapours may not be appropriate for China, and more experiments need to be conducted in the future for the emission quantification. As mentioned above, atmospheric SOA formation cannot be explained purely with thermodynamic partitioning models, and that a fraction of the simulated VOC oxidation products could actually be involved in new particle formation. The existed gap may also come from the limitations of the current SOA model approach.
Fig. 8 (a) Observed OM and simulated OC concentration (µg m−3) averaged over July 2006 for 14 sites. (b) AOD averaged over July 2006 for 14 sites. The bars are simulated ASOA and BSOA AOD, and the dots are monthly-averaged MODIS AOD.
The analysis of surface air temperature from 726 stations shows that the warming rate is about 0.15 °C/10a in summer for the last 54 yr over the Mainland China (GuoYu et al., Citation2005). According to Ren et al. (Citation2005), there are no significant long-term changes for the average precipitation over China in the past 50 yr. Since the isoprene and monoterpene emissions are favoured by high temperature, the BSOA concentrations are lower in the past and will be higher in the future than the concentrations in 2006 (Liao et al., Citation2007; Jiang et al., Citation2010). The ASOA concentrations are influenced by the anthropogenic VOC and OC emissions. Heald et al. (Citation2008) suggested that SOA production in Asia by 2100 grows significantly because of the large increase in anthropogenic aromatic emissions.
3.4. AOD and radiative forcing
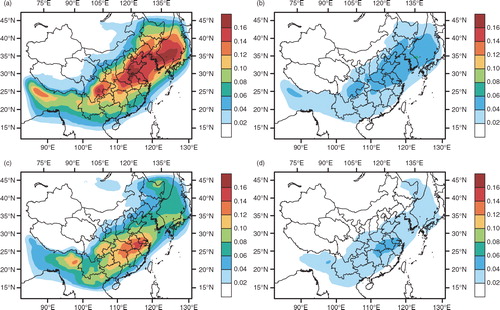
As shown in , AOD distribution is consistent with SOA column burden with higher values (greater than 0.16) centred in Japan Sea and North China for ASOA, and in the Middle China for BSOA. Model AOD is evaluated against Terra-MODIS AOD (b). Monthly mean data of MODIS Level 3 AOD in a resolution of 1×1 degree on July is used (http://gdata1.sci.gsfc.nasa.gov/daac-bin/G3/gui.cgi?instance_id=MODIS_MONTHLY_L3). Because of the pollutants (particles and secondary aerosols’ precursors) emission intensity, MODIS AOD in urban sites is relatively higher than those in rural sites. Since the differences between the extinction coefficients of ASOA and BSOA are small, the sum of ASOA and BSOA AOD is treated approximately as SOA AOD. Modelled SOA AOD is about 0.08 of total MODIS AOD for the urban sites, and 0.36 for the rural sites except DH and LS. The biogenic contribution of SOA is larger in rural than in the urban environment.
Fig. 9 Aerosol optical depth of ASOA and BSOA averaged over July 2006 for experiment (a) ABP, (b) AUL, (c) BBP, and (d) BUL.
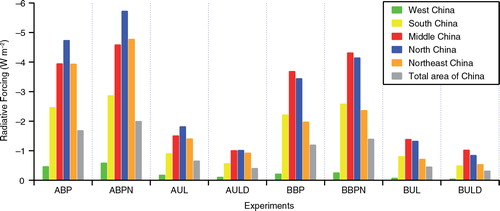
Because of the high SOA concentration in the model upper layers, the surface RF is much stronger than the TOA RF, both exerting cooling effects. Due to the column burden distribution, ASOA TOA RF is strongest in North and Middle China (experiment AUL in ), and BSOA TOA RF is strongest in both Middle China and South China (experiment BUL in ). Finally and due to the weak SOA precursor emission in Western China, both ASOA and BSOA RF in this area are the lowest.
Fig. 10 TOA RF (W m−2) averaged over six regions (West China, South China, Middle China, North China, Northeast China and the total area of China) in China over July 2006 for eight experiments (ABP, ABPN, AUL, AULD, BBP, BBPN, BUL and BULD).
According to Qian et al. (Citation2003), the summer TOA DRF of aerosols, including sulphate, organic carbon, black carbon, mineral dust, sea salt, and methane sulfonic acid particles, is −5.97 W m−2 averaged over Sichuan Basin, and −5.11 W m−2 averaged over East China. As the pollutant emission and aerosol extinction coefficient increase significantly in Sichuan Basin, the radiative forcing is estimated to increase negatively by 2.5 W m−2 during recent decades (Qian and Giorgi, Citation2000). Giorgi et al. (Citation2003) indicated that TOA DRF of sulphate aerosols is in the range of −1 to −15 W m−2 in summer over East Asia. Based on the work of Qian et al. (Citation2001), Giorgi et al. (Citation2003) suggested that summer sulphate aerosols induced TOA DRF is −4.85 W m−2 over Sichuan Basin, and −2.65 W m−2 over East China region. Observation results show that sulphate aerosol consists 16% of total aerosols, and organic carbon is about 15% of total aerosols, of which about 55–60% can be attributed to secondary organic carbon (Zhang et al., Citation2012b). According to the model results and ratios mentioned above, SOA DRF is presumed to be in the range of −1.03 to −16.88 W m−2. The sum of averaged ASOA DRF and BSOA DRF over China from our results is −1.12 W m−2, which is in the lower end of this rough estimation.
3.5. RF sensitivity study to different optical parameters
For primary OAs, the RI are always based on GADS database (Köpke et al., Citation1997). The real and imaginary parts of POA RI in visible wavelength are 1.53 and 0.006. The size distribution settings of POA follow Ming et al. (Citation2005) and references therein. Compared to experiment AUL, if the GADS database is used, the TRF will increase by 156 and 161% for ASOA and BSOA, respectively, and if the imaginary part in visible wavelength is 1.0×10⁻⁷, that is, SOA is treated like non-absorbing, the TRF will increase by 203% for ASOA, and increase by 204% for BSOA. Also, both ASOA and BSOA AOD () will increase in most China regions when applying POC RI and size distribution in Mie theory.
As SOA ages, the hygroscopic growth becomes stronger (Massoli et al., Citation2010), whose effect on the extinction coefficient can be expressed as , where
denotes the extinction coefficient for dry particle and σ is a parameter describing the solubility of the particle. When the SOA is treated as hydrophobic, that is σ=0, the induced RF will become weaker than those SOA which are treated as hydrophilic. The differences of RF between experiment AUL and AULD are small, compared to those between experiment AUL and ABP, thus the usage of one value for all SOA solubility will not induce much error. Since experiments about the solubility of SOA with different oxidation levels are few, the solubility of POA is recommended for SOA in the model. Recent study indicates that submicron atmospheric aerosols, which are presumed to be low-volatile organics, in a boreal forest are hygroscopic and can serve as CCN (Hong et al., Citation2014). If the particles are more hygroscopic, the CCN activity will be higher and will induce stronger first indirect radiative forcing (Haywood and Boucher, Citation2000). The importance of hygroscopicity should be re-evaluated in indirect radiative forcing estimation.
As discussed in section 3.2, ISOA constitutes a large fraction of total OM in the model results. But few studies about the optical parameters of ISOA are conducted, so in experiment IUP and IBP, the RI of ISOA are set same as the ones of POA. The differences between these two experiments are the particle size distribution and particle density. For experiment IUP, TRF and SRF are −1.20 W m−2 and −2.01 W m−2 over China. In parallel for experiment IBP, TRF and SRF are −1.94 W m−2 and −3.00 W m−2, respectively. For the column burden of ISOA is higher than ASOA and BSOA, the corresponding RF is stronger. Compared to SOA, adopting the POA physical properties will increase the TRF and SRF by 62 and 49%, respectively. Future work about fresh and aged SOA physical properties is in need.
4. Conclusions
To investigate the direct SW radiative forcing of SOA at a regional scale, a SOA module (VBS) has been implemented in the regional climate model RegCM4-Chem. Simulations conducted over China for a one month period indicate that the surface ASOA concentration is high in North China, and the surface BSOA concentration is high in Middle China. ASOA (BSOA) surface concentration averaged over the interior of China on July is 1.9 µg m−3 (2.0 µg m−3). The column burden is consistent with surface concentration distribution, and the centre of high concentration will shift from North China to Japanese Sea, because of the favoured low temperature for gas-particle partition and Eastward wind in the upper layers of the atmosphere. Traditionally, the optical parameters applied in radiative transfer module are adopted from the ones of primary OAs. In this study, we use α-pinene and limonene SOA RI for anthropogenic and biogenic SOA optical parameters calculation. Compared to the results using these RI, if the adopted POA optical properties are mildly absorbing, the SRF and TRF will increase for both ASOA and BSOA, and when the POA optical properties are non-absorbing, the SRF and TRF will increase too. If the SOA is treated like hydrophobic, the RF will decrease. As for ISOA, the RF is stronger than both ASOA and BSOA.
5. Acknowledgements
This work was supported by the National Key Basic Research Program of China (2011CB403406, 2014CB441203, and 2010CB428503), FP7 project: REQUA (PIRSES–GA–2013–612671), the Young Scientist Fund of the National Natural Science Foundation of China (41205111), the Fundamental Research Funds for the Key Universities (1127020701), and the fund for Priority Academic Program Development of Jiangsu Higher Education Institutions (PAPD). The authors thank Xiaoye Zhang at the Chinese Academy of Meteorological Sciences for providing OC observation data of 14 sites over China.
References
- Ahmadov R. , McKeen S. , Robinson A. , Bahreini R. , Middlebrook A. , co-authors . A volatility basis set model for summertime secondary organic aerosols over the Eastern United States in 2006. J. Geophys. Res. Atmos. 2012; 117: D06301.
- Aiken A. C. , Decarlo P. F. , Kroll J. H. , Worsnop D. R. , Huffman J. A. , co-authors . O/C and OM/OC ratios of primary, secondary, and ambient organic aerosols with high-resolution time-of-flight aerosol mass spectrometry. Environ. Sci. Technol. 2008; 42: 4478–4485.
- Athanasopoulou E. , Vogel H. , Vogel B. , Tsimpidi A. , Pandis S. , co-authors . Modeling the meteorological and chemical effects of secondary organic aerosols during an EUCAARI campaign. Atmos. Chem. Phys. 2013; 13: 625–645.
- Barkey B. , Paulson S. , Chung A . Genetic algorithm inversion of dual polarization polar nephelometer data to determine aerosol refractive index. Aerosol. Sci. Tech. 2007; 41: 751–760.
- Cappa C. , Che D. , Kessler S. , Kroll J. , Wilson K . Variations in organic aerosol optical and hygroscopic properties upon heterogeneous OH oxidation. J. Geophys. Res. Atmos. 2011; 116: D15204.
- Chung S. H. , Seinfeld J. H . Global distribution and climate forcing of carbonaceous aerosols. J. Geophys. Res. Atmos. 2002; 107: AAC 14-1-AAC 14-33.
- Crosier J. , Allan J. , Coe H. , Bower K. , Formenti P. , co-authors . Chemical composition of summertime aerosol in the Po Valley (Italy), northern Adriatic and Black Sea. Q. J. Roy. Meteorol. Soc. 2007; 133: 61–75.
- Donahue N. , Robinson A. , Stanier C. , Pandis S . Coupled partitioning, dilution, and chemical aging of semivolatile organics. Environ. Sci. Technol. 2006; 40: 2635–2643.
- Ehn M. , Thornton J. A. , Kleist E. , Sipila M. , Junninen H. , co-authors . A large source of low-volatility secondary organic aerosol. Nature. 2014; 506: 476–479.
- Emmons L. K. , Walters S. , Hess P. G. , Lamarque J. F. , Pfister G. G. , co-authors . Description and evaluation of the Model for Ozone and Related chemical Tracers, version 4 (MOZART-4). Geosci. Model. Dev. 2010; 3: 43–67.
- Fu Y. , Liao H . Simulation of the interannual variations of biogenic emissions of volatile organic compounds in China: impacts on tropospheric ozone and secondary organic aerosol. Atmos. Environ. 2012; 59: 170–185.
- Giorgi F. , Bi X. Q. , Qian Y . Indirect vs. direct effects of anthropogenic sulfate on the climate of East Asia as simulated with a regional coupled climate-chemistry/aerosol model. Clim. Change. 2003; 58: 345–376.
- Giorgi F. , Coppola E. , Solmon F. , Mariotti L. , Sylla M. , co-authors . RegCM4: model description and preliminary tests over multiple CORDEX domains. Clim. Res. 2012; 52: 7–29.
- Giorgi F. , Mearns L. O . Introduction to special section: regional climate modeling revisited. J. Geophys. Res. Atmos. 1999; 104: 6335–6352.
- Giorgi F. , Pal J. S. , Bi X. , Sloan L. , Elguindi N. , co-authors . Introduction to the TAC special issue: the RegCNET network. Theor. Appl. Climatol. 2006; 86: 1–4.
- Grell G. A. , Peckham S. E. , Schmitz R. , McKeen S. A. , Frost G. , co-authors . Fully coupled “online” chemistry within the WRF model. Atmos. Environ. 2005; 39: 6957–6975.
- Guenther A. , Hewitt C. N. , Erickson D. , Fall R. , Geron C. , co-authors . A global model of natural volatile organic compound emissions. J. Geophys. Res. Atmos. 1995; 100: 8873–8892.
- Guenther A. , Karl T. , Harley P. , Wiedinmyer C. , Palmer P. , co-authors . Estimates of global terrestrial isoprene emissions using MEGAN (Model of Emissions of Gases and Aerosols from Nature). Atmos. Chem. Phys. 2006; 6: 3181–3210.
- GuoYu R. E. N. , MingZhi X. U. , ZiYing C. H. U. , Jun G. U. O. , QingXiang L. I. , co-authors . Changes of surface air temperature in China during 1951–2004. Clim. Environ. Res. 2005; 10: 717–727.
- Hallquist M. , Wenger J. , Baltensperger U. , Rudich Y. , Simpson D. , co-authors . The formation, properties and impact of secondary organic aerosol: current and emerging issues. Atmospheric Chemistry and Physics. 2009; 9: 5155–5236.
- Haywood J. , Boucher O . Estimates of the direct and indirect radiative forcing due to tropospheric aerosols: a review. Rev. Geophys. 2000; 38: 513–543.
- Heald C. L. , Henze D. K. , Horowitz L. W. , Feddema J. , Lamarque J. F. , co-authors . Predicted change in global secondary organic aerosol concentrations in response to future climate, emissions, and land use change. J. Geophys. Res. Atmos. 2008; 113: D05211.
- Heald C. L. , Jacob D. J. , Turquety S. , Hudman R. C. , Weber R. J. , co-authors . Concentrations and sources of organic carbon aerosols in the free troposphere over North America. J. Geophys. Res. Atmos. 2006; 111: D23S47.
- Hildemann L. M. , Markowski G. R. , Cass G. R . Chemical composition of emissions from urban sources of fine organic aerosol. Environ. Sci. Technol. 1991; 25: 744–759.
- Hong J. , Hakkinen S. A. K. , Paramonov M. , Aijala M. , Hakala J. , co-authors . Hygroscopicity, CCN and volatility properties of submicron atmospheric aerosol in a boreal forest environment during the summer of 2010. Atmos. Chem. Phys. 2014; 14: 4733–4748.
- Horowitz L. W. , Walters S. , Mauzerall D. L. , Emmons L. K. , Rasch P. J. , co-authors . A global simulation of tropospheric ozone and related tracers: description and evaluation of MOZART, version 2. J. Geophys. Res. Atmos. 2003; 108: ACH 16-1-ACH 16-18.
- Hoyle C. , Myhre G. , Berntsen T. , Isaksen I . Anthropogenic influence on SOA and the resulting radiative forcing. Atmos. Chem. Phys. 2009; 9: 2715–2728.
- Jiang F. , Liu Q. , Huang X. , Wang T. , Zhuang B. , co-authors . Regional modeling of secondary organic aerosol over China using WRF/Chem. J. Aerosol. Sci. 2012; 43: 57–73.
- Jiang X. , Yang Z. L. , Liao H. , Wiedinmyer C . Sensitivity of biogenic secondary organic aerosols to future climate change at regional scales: an online coupled simulation. Atmos. Environ. 2010; 44: 4891–4907.
- Kalnay E. , Kanamitsu M. , Kistler R. , Collins W. , Deaven D. , co-authors . The NCEP/NCAR 40-year reanalysis project. Bull. Am. Meteorol. Soc. 1996; 77: 437–471.
- Kanakidou M. , Seinfeld J. , Pandis S. , Barnes I. , Dentener F. , co-authors . Organic aerosol and global climate modelling: a review. Atmos. Chem. Phys. 2005; 5: 1053–1123.
- Kiehl J. , Hack J. , Bonan G. , Boville B. , Williamson D. , co-authors . The national center for atmospheric research community climate model: CCM3. J. Clim. 1998; 11: 1131–1149.
- Kim H. , Barkey B. , Paulson S . Real refractive indices of alpha- and beta-pinene and toluene secondary organic aerosols generated from ozonolysis and photo-oxidation. J. Geophys. Res. Atmos. 2010; 115: D24212.
- Kim H. , Barkey B. , Paulson S . Real refractive indices and formation yields of secondary organic aerosol generated from photooxidation of limonene and alpha-pinene: the effect of the HC/NOx ratio. J. Phys Chem. A. 2012; 116: 6059–6067.
- Kim H. , Paulson S . Real refractive indices and volatility of secondary organic aerosol generated from photooxidation and ozonolysis of limonene, alpha-pinene and toluene. Atmos. Chem. Phys. 2013; 13: 7711–7723.
- Kirkevåg A. , Iversen T. , Seland Ø. , Kristjánsson J. E . Revised Schemes for Aerosol Optical Parameters and Cloud Condensation Nuclei in CCM-Oslo.
- Klinger L. , Li Q. , Guenther A. , Greenberg J. , Baker B. , co-authors . Assessment of volatile organic compound emissions from ecosystems of China. J. Geophys. Res. Atmos. 2002; 107: ACH 16-1-ACH 16-18.
- Köpke P. , Hess M. , Schult I. , Shettle E . Global Aerosol Data Set. 1997; Max-Planck-Institut für Meteorologie Hamburg, Germany.
- Lamarque J. , Bond T. , Eyring V. , Granier C. , Heil A. , co-authors . Historical (1850–2000) gridded anthropogenic and biomass burning emissions of reactive gases and aerosols: methodology and application. Atmos. Chem. Phys. 2010; 10: 7017–7039.
- Lambe A. , Cappa C. , Massoli P. , Onasch T. , Forestieri S. , co-authors . Relationship between oxidation level and optical properties of secondary organic aerosol. Environ. Sci. Technol. 2013; 47: 6349–6357.
- Lane T. , Donahue N. , Pandis S . Simulating secondary organic aerosol formation using the volatility basis-set approach in a chemical transport model. Atmos. Environ. 2008; 42: 7439–7451.
- Li J. P. , Zeng Q. C . A unified monsoon index. Geophys. Res. Lett. 2002; 29: 115-1-115-4.
- Liao H. , Henze D. K. , Seinfeld J. H. , Wu S. , Mickley L. J . Biogenic secondary organic aerosol over the United States: comparison of climatological simulations with observations. J. Geophys. Res. Atmos. 2007; 112: D06201.
- Lihavainen H. , Kerminen V. , Tunved P. , Aaltonen V. , Arola A. , co-authors . Observational signature of the direct radiative effect by natural boreal forest aerosols and its relation to the corresponding first indirect effect. J. Geophys. Res. Atmos. 2009; 114: D20206.
- Ma L. , Thompson J . Optical properties of dispersed aerosols in the near ultraviolet (355 nm): measurement approach and initial data. Anal. Chem. 2012; 84: 5611–5617.
- Massoli P. , Lambe A. , Ahern A. , Williams L. , Ehn M. , co-authors . Relationship between aerosol oxidation level and hygroscopic properties of laboratory generated secondary organic aerosol (SOA) particles. Geophys. Res. Lett. 2010; 37: L24801.
- Ming Y. , Ramaswamy V. , Ginoux P. , Horowitz L . Direct radiative forcing of anthropogenic organic aerosol. J. Geophys. Res. Atmos. 2005; 110: D20208.
- Morgan W. , Allan J. , Bower K. , Esselborn M. , Harris B. , co-authors . Enhancement of the aerosol direct radiative effect by semi-volatile aerosol components: airborne measurements in North-Western Europe. Atmos. Chem. Phys. 2010; 10: 8151–8171.
- Murphy B. , Pandis S . Simulating the formation of semivolatile primary and secondary organic aerosol in a regional chemical transport model. Environ. Sci. Tech. 2009; 43: 4722–4728.
- Myhre G. , Bellouin N. , Berglen T. , Berntsen T. , Boucher O. , co-authors . Comparison of the radiative properties and direct radiative effect of aerosols from a global aerosol model and remote sensing data over ocean. Tellus B. 2007; 59: 115–129.
- Myhre G. , Berglen T. , Johnsrud M. , Hoyle C. , Berntsen T. , co-authors . Modelled radiative forcing of the direct aerosol effect with multi-observation evaluation. Atmos. Chem. Phys. 2009; 9: 1365–1392.
- Myhre G. , Samset B. , Schulz M. , Balkanski Y. , Bauer S. , co-authors . Radiative forcing of the direct aerosol effect from AeroCom Phase II simulations. Atmos. Chem. Phys. 2013; 13: 1853–1877.
- Nair V. S. , Solmon F. , Giorgi F. , Mariotti L. , Babu S. S. , co-authors . Simulation of south Asian aerosols for regional climate studies. J. Geophys. Res. Atmos. 2012; 117: D04209.
- Nakayama T. , Matsumi Y. , Sato K. , Imamura T. , Yamazaki A. , co-authors . Laboratory studies on optical properties of secondary organic aerosols generated during the photooxidation of toluene and the ozonolysis of alpha-pinene. J. Geophys. Res. Atmos. 2010; 115: D24204.
- Nakayama T. , Sato K. , Matsumi Y. , Imamura T. , Yamazaki A. , co-authors . Wavelength dependence of refractive index of secondary organic aerosols generated during the ozonolysis and photooxidation of alpha-pinene. SOLA. 2012; 8: 119–123.
- Nakayama T. , Sato K. , Matsumi Y. , Imamura T. , Yamazaki A. , co-authors . Wavelength and NOx dependent complex refractive index of SOAs generated from the photooxidation of toluene. Atmos. Chem. Phys. 2013; 13: 531–545.
- Odum J. R. , Hoffmann T. , Bowman F. , Collins D. , Flagan R. C. , co-authors . Gas/particle partitioning and secondary organic aerosol yields. Environ. Sci. Tech. 1996; 30: 2580–2585.
- Qian Y. , Giorgi F . Regional climatic effects of anthropogenic aerosols? The case of Southwestern China. Geophys. Res. Lett. 2000; 27: 3521–3524.
- Qian Y. , Giorgi F. , Huang Y. , Chameides W. , Luo C . Regional simulation of anthropogenic sulfur over East Asia and its sensitivity to model parameters. Tellus B. 2001; 53: 171–191.
- Qian Y. , Leung L. R. , Ghan S. J. , Giorgi F . Regional climate effects of aerosols over China: modeling and observation. Tellus B. 2003; 55: 914–934.
- Redmond H. , Thompson J . Evaluation of a quantitative structure-property relationship (QSPR) for predicting mid-visible refractive index of secondary organic aerosol (SOA). Phys. Chem. Chem. Phys. 2011; 13: 6872–6882.
- Ren G. , Guo J. , Xu M. , Chu Z. , Zhang L. , co-authors . Climate changes of China's mainland over the past half century. Acta. Meteorol. Sin. 2005; 63: 942–956.
- Riipinen I. , Pierce J. R. , Yli-Juuti T. , Nieminen T. , Hakkinen S. , co-authors . Organic condensation: a vital link connecting aerosol formation to cloud condensation nuclei (CCN) concentrations. Atmos. Chem. Phys. 2011; 11: 3865–3878.
- Robinson A. L. , Donahue N. M. , Shrivastava M. K. , Weitkamp E. A. , Sage A. M. , co-authors . Rethinking organic aerosols: semivolatile emissions and photochemical aging. Science. 2007; 315: 1259–1262.
- Schell B. , Ackermann I. J. , Hass H. , Binkowski F. S. , Ebel A . Modeling the formation of secondary organic aerosol within a comprehensive air quality model system. J. Geophys. Res. Atmos. 2001; 106: 28275–28293.
- Schnaiter M. , Horvath H. , Mohler O. , Naumann K. , Saathoff H. , co-authors . UV-VIS-NIR spectral optical properties of soot and soot-containing aerosols. J. Aerosol. Sci. 2003; 34: 1421–1444.
- Schnaiter M. , Linke C. , Mohler O. , Naumann K. , Saathoff H. , co-authors . Absorption amplification of black carbon internally mixed with secondary organic aerosol. J. Geophys. Res. Atmos. 2005; 110: D19204.
- Scott C. E. , Rap A. , Spracklen D. V. , Forster P. M. , Carslaw K. S. , co-authors . The direct and indirect radiative effects of biogenic secondary organic aerosol. Atmos. Chem. Phys. 2014; 14: 447–470.
- Seland O. , Iversen T. , Kirkevag A. , Storelvmo T . Aerosol-climate interactions in the CAM-Oslo atmospheric GCM and investigation of associated basic shortcomings. Tellus A. 2008; 60: 459–491.
- Shalaby A. , Zakey A. , Tawfik A. , Solmon F. , Giorgi F. , co-authors . Implementation and evaluation of online gas-phase chemistry within a regional climate model (RegCM-CHEM4). Geosci. Model. Dev. 2012; 5: 741–760.
- Shindell D. T. , Lamarque J. F. , Schulz M. , Flanner M. , Jiao C. , co-authors . Radiative forcing in the ACCMIP historical and future climate simulations. Atmos. Chem. Phys. 2013; 13: 2939–2974.
- Shrivastava M. , Fast J. , Easter R. , Gustafson W. , Zaveri R. , co-authors . Modeling organic aerosols in a megacity: comparison of simple and complex representations of the volatility basis set approach. Atmos. Chem. Phys. 2011; 11: 6639–6662.
- Shrivastava M. , Lane T. , Donahue N. , Pandis S. , Robinson A . Effects of gas particle partitioning and aging of primary emissions on urban and regional organic aerosol concentrations. J. Geophys. Res. Atmos. 2008; 113: D18301.
- Singh G. , Oh J. , Kim J. , Kim O . Sensitivity of summer monsoon precipitation over east Asia to convective parameterization schemes in RegCM3. SOLA. 2006; 2: 29–32.
- Skeie R. , Berntsen T. , Myhre G. , Tanaka K. , Kvalevag M. , co-authors . Anthropogenic radiative forcing time series from pre-industrial times until 2010. Atmos. Chem. Phys. 2011; 11: 11827–11857.
- Solmon F. , Elguindi N. , Mallet M . Radiative and climatic effects of dust over West Africa, as simulated by a regional climate model. Clim. Res. 2012; 52: 97–113.
- Solmon F. , Giorgi F. , Liousse C . Aerosol modelling for regional climate studies: application to anthropogenic particles and evaluation over a European/African domain. Tellus B. 2006; 58: 51–72.
- Spracklen D. V. , Bonn B. , Carslaw K. S . Boreal forests, aerosols and the impacts on clouds and climate. Phil. Trans. Math. Phys. Eng. Sci. 2008; 366: 4613–4626.
- Spracklen D. V. , Jimenez J. L. , Carslaw K. S. , Worsnop D. R. , Evans M. J. , co-authors . Aerosol mass spectrometer constraint on the global secondary organic aerosol budget. Atmos. Chem. Phys. 2011; 11: 12109–12136.
- Tawfik A. , Stockli R. , Goldstein A. , Pressley S. , Steiner A . Quantifying the contribution of environmental factors to isoprene flux interannual variability. Atmos. Environ. 2012; 54: 216–224.
- Tie X. , Li G. , Ying Z. , Guenther A. , Madronich S . Biogenic emissions of isoprenoids and NO in China and comparison to anthropogenic emissions. Sci. Total. Environ. 2006; 371: 238–251.
- Trainic M. , Riziq A. , Lavi A. , Flores J. , Rudich Y . The optical, physical and chemical properties of the products of glyoxal uptake on ammonium sulfate seed aerosols. Atmos. Chem. Phys. 2011; 11: 9697–9707.
- Wex H. , Petters M. , Carrico C. , Hallbauer E. , Massling A. , co-authors . Towards closing the gap between hygroscopic growth and activation for secondary organic aerosol: part 1-evidence from measurements. Atmos. Chem. Phys. 2009; 9: 3987–3997.
- Yang F. , Tan J. , Zhao Q. , Du Z. , He K. , co-authors . Characteristics of PM2.5 speciation in representative megacities and across China. Atmos. Chem. Phys. 2011; 11: 5207–5219.
- Yu Y. , Ezell M. , Zelenyuk A. , Imre D. , Alexander L. , co-authors . Photooxidation of alpha-pinene at high relative humidity in the presence of increasing concentrations of NOx. Atmos. Environ. 2008; 42: 5044–5060.
- Zarzana K. , De Haan D. , Freedman M. , Hasenkopf C. , Tolbert M . Optical properties of the products of alpha-dicarbonyl and amine reactions in simulated cloud droplets. Environ. Sci. Tech. 2012; 46: 4845–4851.
- Zelenyuk A. , Ezell M. , Perraud V. , Johnson S. , Bruns E. , co-authors . Characterization of organic coatings on hygroscopic salt particles and their atmospheric impacts. Atmos. Environ. 2010; 44: 1209–1218.
- Zhang H. , Shen Z. , Wei X. , Zhang M. , Li Z . Comparison of optical properties of nitrate and sulfate aerosol and the direct radiative forcing due to nitrate in China. Atmos. Res. 2012a; 113: 113–125.
- Zhang X. , Wang Y. , Niu T. , Zhang X. , Gong S. , co-authors . Atmospheric aerosol compositions in China: spatial/temporal variability, chemical signature, regional haze distribution and comparisons with global aerosols. Atmos. Chem. Phys. 2012b; 12: 779–799.
- Zheng M. , Salmon L. G. , Schauer J. J. , Zeng L. M. , Kiang C. S. , co-authors . Seasonal trends in PM2.5 source contributions in Beijing, China. Atmos. Environ. 2005; 39: 3967–3976.
- Zhong M. , Jang M . Light absorption coefficient measurement of SOA using a UV-visible spectrometer connected with an integrating sphere. Atmos. Environ. 2011; 45: 4263–4271.