
Abstract
Ultrafine particles (UFP) in the atmosphere may have significant impacts on the regional water and radiation budgets through secondary effects on cloud microphysics. Yet, as these particles are invisible for current remote sensing techniques, knowledge about their three-dimensional distribution, source strengths and budgets is limited. Building on a 40-yr-old Australia-wide airborne survey which provides a reference case study of aerosol sources and budgets, this study presents results from a new airborne survey over Eastern Australia, northern New South Wales and Queensland. Observations identified apparent changes in the number and distribution of major anthropogenic aerosol sources since the early 1970s, which might relate to the simultaneously observed changes in rainfall patterns over eastern Queensland. Coal-fired power stations in the inland areas between Brisbane and Rockhampton were clearly identified as the major sources for ultrafine particulate matter. Sugar mills, smelters and shipping along the coast close to the Ports of Townsville and Rockhampton were comparable minor sources. Airborne Lagrangian plume studies were applied to investigate source strength and ageing properties within power station plumes. Significant changes observed, compared to the measurements in the 1970s, included a significant increase in the number concentration of UFP related to coal-fired power station emissions in the sparsely populated Queensland hinterland coincident with the area with the most pronounced reduction in rainfall.
1. Introduction
There is clear evidence that the distribution of ultrafine aerosols (<100 nm) in the planetary boundary layer (PBL) is highly heterogeneous as a consequence of their comparatively short lifetime and the high spatial, temporal and intensity variability of their sources. While fine (100 nm to 2.5 µm) and coarse (2.5–10 µm) particles are detectable from satellites under cloud-free conditions and therefore allow an estimation of the regional to global distribution, the distribution of ultrafine particles (UFP) (<100 nm) is more uncertain because they are not directly measurable using remote sensing techniques (Rosenfeld et al., 2014b). However, in situ techniques are robust. After Aitken (Citation1888) developed the first particle counter, a large number of observations are now available to define typical concentration levels for remote (background) and polluted continental and maritime air masses. However, the local and regional variability is high due to local sources or long range transport (Bigg and Turvey, Citation1978; O'Dowd et al., Citation2009). Particles in a size range from a few nm to 100 nm have lifetimes of a few hours to about a week in the atmosphere before they are removed by dry or wet deposition (Jaenicke, Citation1978; Heintzenberg, Citation1989). Within this time they can be transported over hundreds of kilometres. Thus linking UFP to climate processes requires coupling observations with transport models and understanding of particle–cloud interaction processes.
Although too small to be visible and thus not directly interacting with shortwave radiation, UFP can have important implications within the climate system. Produced either from gas-to-particle conversion in the atmosphere, or directly emitted from various sources, they rapidly grow from an initial nm-size at rates in the range of ~2–10 nm/h (Kulmala and Kerminen, Citation2008; Suni et al., Citation2008; Andreae, Citation2013; Kulmala et al., Citation2013). Within the first hours of growth, they do not interact with radiation but might play a role for heterogenic chemical reactions affecting for example the budget of nitrogen oxides (Heikes and Thompson, Citation1983). Particles in size ranges larger than ~40 nm can act as cloud condensation nuclei (CCN) (Twomey, Citation1977; Andreae, Citation2009; Kerminen et al., Citation2012). Ageing and growth to CCN sizes normally requires less than 10 hours (Laaksonen et al., Citation2005). As such they have the potential to modify the regional water cycle. A larger number of CCN competing for the available condensable water leads to smaller droplet sizes and increases the brightness of clouds (Twomey, Citation1974). Moreover, as smaller droplets need more time to coagulate to raindrops, cloud lifetime can also be affected (Albrecht, Citation1998). Slowing down raindrop production may significantly delay or even suppress precipitation from certain cloud types (Lee et al., Citation1980; Givati and Rosenfeld, Citation2004; Teller and Levin, Citation2006; Konwar et al., Citation2010). As a result the temporal, spatial and intensity of rainfall and its redistribution might change. In case the minimum droplet diameter for raindrop formation is not reached, an initial local reduction of rainfall can be expected within and downwind of the source areas of UFP, but as the water remains in the atmosphere – either as water vapour or as sub-raindrop size cloud droplets – rain will be formed elsewhere under more favourable conditions potentially leading to an increase of vigorous rain (Li et al., Citation2011; Rosenfeld et al., 2014a).
Due to the importance of rainfall variability for ecosystem functioning and agricultural food and feed production, the interaction between aerosols and clouds has been a matter of interest for many decades. Detailed investigations of aerosols (CCN) and clouds and their interaction in the natural atmosphere were already performed by Twomey and co-workers (Twomey, Citation1960, Citation1974; Twomey and Warner, Citation1967; Warner, Citation1968). Yet, many questions still remain unclear – in some cases even whether certain aerosol effects lead regionally to more or to less precipitation. Individual process studies sometimes revealed contradictory results (Hobbs et al., Citation1970; Rosenfeld, Citation2000; Rosenfeld et al., Citation2006, Citation2008; Bigg, Citation2008; Qian et al., Citation2009). But, the majority of the studies report a delayed raindrop production and subsequent regional reduction of rainfall with increasing particle numbers. It is clear, though, that despite the high importance for the local to regional water cycle, even our current knowledge about source strengths of UFP, their contribution to CCN budgets, and their three-dimensional distribution is still rather limited (Kerminen et al., Citation2012; Andreae, Citation2013).
As aerosol size and number distributions, clouds and precipitation are all highly variable, the interaction of aerosols, clouds and rainfall is difficult to investigate using observational data from short term field or process studies. To derive statistical significant trends and possible correlations would require time series covering several, at least three, decades. Such long time series for aerosols are available for the South Pole, Samoa and for Cape Grim (since 1957), with a few shorter data sets for European and US locations, but not for continental Australia (Gras, Citation1995; Bigg, Citation2008; Asmi et al., Citation2013).
Most of the current aerosol (CCN) – cloud interaction studies are thus based on numerical simulations (Lohmann and Feichter, Citation2005; Teller and Levin, Citation2006; Spracklen et al., Citation2008, Citation2011; Merikanto et al., Citation2009; Khain, Citation2009). In these simulations, the major uncertainties in estimating the effects on CCN availability are the unknown size and number size distribution of regional scale particulate emissions, their historic development and the partitioning between primary emissions and secondary production (Lee et al., Citation2013). Another still challenging aspect of such simulations is how to include local point sources into the model grid cells (Stevens and Pierce, Citation2013).
In this study, we evaluate current and historical detailed airborne observations of UFP and source identification with transport models over a region in Australia, to consider how they might be associated with significant temporal trends in precipitation distribution. In previous investigations over Western Australia (WA), the authors found observational evidence that locally emitted UFP are able to influence regional CCN number concentrations, cloud microphysics and rainfall patterns, but were not able to quantitatively separate aerosol-related processes from those caused by land use changes (Junkermann et al., Citation2009; Nair et al., Citation2011). In WA negative rainfall trends have been observed since about 1970 despite a concurrent increase in absolute water vapour content (dewpoint) in the atmosphere (Lucas, Citation2010; BOM, Citation2014). In this case, the increase of available total water in the atmosphere did not lead to more rainfall as may be expected by a higher turnover rate of water in a warmer atmosphere. The observed reduction in rainfall may instead be caused by a more local physical effect such as a regional-scale suppression of rainfall by enhanced CCN. To come to a firm conclusion, though, would require considerably more observations, analysis and modelling. The timing of the rainfall decline, however, coincides with the initiation of increased ultrafine particle production related to anthropogenic activities, which might therefore be a significant factor for regional climate change.
The Australian Bureau of Meteorology (BOM, Citation2014) is reporting similar trends in water vapour and rainfall patterns for both, the Western Australian (WA) wheat belt and an area about 300 km wide along the North-Eastern Australian (Queensland) coast extending from Brisbane for about 1000 km to the north towards Townsville. In both regions, temperature and dewpoint have increased since about 1970 while precipitation and the number of rainfall days have decreased. In Queensland, this trend is even more pronounced than in WA. In contrast to Western Australia, however, the area affected by rainfall change in Queensland is not subject to large-scale changes in land use and surface roughness. Therefore, the apparent rainfall changes are less likely explainable by such land surface changes. It is thus interesting to investigate whether anthropogenic regional ultrafine aerosol emissions may also have significantly increased over Queensland within the 40 yr of rainfall decline since ~1970, which would then strengthen the hypothesis, initially raised by Bigg (Citation2008), that changes in rainfall distribution are indeed linked to a change in aerosol abundance.
Sources of cloud-active particles over Queensland could be gas to particle conversion (nucleation) from local emissions over the forest systems or over the Great Barrier Reef (GBR) both related to biogenic activity, anthropogenic emissions such as vehicle traffic, shipping or industry or rather a combination of both (Kulmala et al., Citation2013). As no major land-use changes have occurred in these areas since the 1970s, a change in the former two possible contributions is unlikely whereas there were substantial changes to be expected in the latter ones. For example fossil fuel burning industries as they are installed in the area have been identified previously to be strong emitters of primary UFP which may then grow into CCNs (Bigg and Turvey, Citation1978; Ayers et al., 1979; Junkermann et al., Citation2011a, Citation2011b). Results from satellite remote sensing analyses of cloud properties over Australia by Rosenfeld (2000), Rosenfeld et al. (2006) indicate smaller cloud droplets in clouds affected by the plumes of such anthropogenic sources in South Australia (SA), Victoria and New South Wales (NSW), which means that they are indeed sources for cloud-active particles and that these emissions are then transported on a regional scale.
A further direct observation of coal-fired power stations in Queensland emitting UFP was made by one of the authors in 2011. High number concentrations of UFP in the vicinity of Stanwell and Callide power stations (see and ) were found using a single condensation nucleus counter (TSI, model 3670) mounted on the back seat of a personal car (for details see below). With south–south-westerly winds of ~2 m s−1, derived from Hybrid Single-Particle Lagrangian Integrated Trajectory Model (HYSPLIT) (Draxler and Rolph, 2013), ~8000–9000 particles were measured directly upwind, >50 000 particles cm−3 at the lookout close to emission height of the Callide smoke stack and ~2 km downwind, and 35 000 particles cm−3 on the ground ~15 km downwind of the power station.
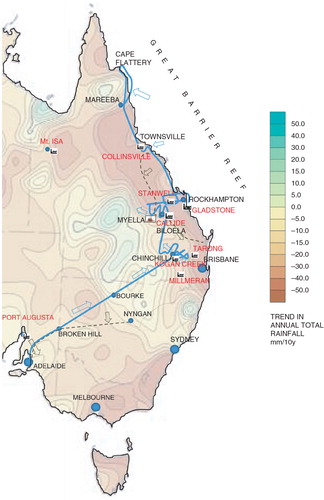
Fig. 1 Map of Eastern Australia showing the airborne (blue) flight patterns and ground vehicle-based measurements (brown, dotted). Coal-fired power stations are marked with a symbol and red text, the daily flight sections and airfields are identified by black text. The arrows show the main wind direction during the survey days. Background colour contours show the decadal trend of rainfall between 1970 and 2010, brown decreasing, green increasing annual rainfall (data provided by the Australian Bureau of Meteorology).
Based on these initial results and further observations of high ultrafine particle concentrations downwind of other coal-fired power stations (Junkermann et al., Citation2011b) we performed an airborne study along the Queensland coast and over the coal mining area of the Queensland hinterland to investigate (1) the source strength of individual major sources of ultrafine aerosols and (2) their possible importance to the overall ultrafine particle budget. The remote Queensland outback serves in our study as a natural laboratory with low background concentrations and a rather limited number of anthropogenic sources. For the current study, we compared our observations to an airborne survey of aerosol sources over Australia in the early 1970s, documenting aerosol sources and typical concentration levels all over Australia within the first years of acceleration of anthropogenic climate change (Bigg and Turvey, Citation1978).
2. Flight strategy and instrumentation
From 24 to 30 August 2012, UFP and related meteorological parameters were surveyed along a flight track from Adelaide, SA via Broken Hill and Bourke in NSW to Chinchilla in Queensland (Qld) (). From Chinchilla to Rockhampton, several Lagrangian flight patterns were flown in the plumes of coal-fired power stations for a more detailed regional investigation measuring particle numbers, size distributions and in-situ winds in several cross-sections up to 200 km downwind from the sources. A long-distance flight followed along the Queensland coast and hinterland up to Cape Flattery about 40 km north of Cooktown in Far North Queensland (FNQ). The complete aerosol instrumentation on-board of the research aircraft consisting of scanning mobility particle sizer (SMPS), condensation particle counter (CPC) and OPC (see below) was then relocated into a vehicle, and ground-based mobile measurements were made along a similar route in the opposite direction starting in Mareeba (Qld) on 31 August and finishing in Adelaide on 12 September 2012. These measurements mainly focused on background particle numbers and size distributions along the transect but also included several days of measurements at fixed locations (Myella Farm in the Queensland outback and coastal locations at Townsville and Lennox Head, both affected by shipping emissions). The data from the coast are not presented here.
and give an overview of the flight/road tracks and patterns and regional survey locations. The background colours of the map in indicate the rainfall trends for the time interval from 1970 to 2010 with brown colours showing negative, green colours positive trends (source: Australian Bureau of Meteorology, BOM, Citation2014).
Table 1. Overview of flight- and vehicle-based measurements
The airborne platform used was a motorglider, one of Flinders University's two ECO-Dimonas (www.airborneresearch.org.au). This aircraft is specifically suited to fly at low altitudes in the PBL with a cruising speed of about 90 kts (~45 m/s) and is also able to climb within a few minutes to higher levels into the free troposphere. The ability to cruise at low airspeed yields high spatial resolution data in spite of the given low time resolution of some of the instruments (see below).
The flight sections from Adelaide to Chinchilla across inland NSW and Queensland (Qld), as well as along the coast north of Cairns were planned to quantify background conditions and possible natural production of ultrafine particulate matter, including nucleation mode aerosols from biogenic emissions from the coastal rainforest, the eucalyptus forests of the inland areas or from the GBR. Based on the findings by Kulmala et al. (2004) that biogenic nucleation typically takes place in the late morning hours and continues for several hours, all flights with the exception of one evening flight at Kogan Creek were scheduled for take-off between 10 AM and 11 AM local time and flight-times of about 4 hours. This is also the time of day when airborne measurements in the mixed boundary layer are comparable to ground-based measurements. For four days, the flight route basically followed the coastline north of Rockhampton, either on-shore and a few km further inland over the forests or off-shore over the sea, to investigate background concentrations and size distributions over different possible source regions.
Lagrangian flight patterns for emission rate estimates were flown downwind of several Queensland power stations supported by real-time readouts from the sensors serving for flight guidance. Air mass origin and history was derived from HYSPLIT back trajectories (Draxler and Rolph, Citation2013) and compared and supported by the in-situ wind measurements from the aircraft. To determine the vertical extent of the PBL, as well as its vertical mixing state, occasional short profiles into the free troposphere were flown. The top of the PBL can be identified from a rapid change in total particle (>10 nm) count rates, temperature and dewpoint (Bigg and Turvey, Citation1978; Junkermann et al., Citation2009, Citation2011a).
The depth of the mixed layer can be derived in-situ with an accuracy of ~50 m or about 5% with a PBL height of 1000 m. Although this depth usually still increases during the earlier part of the day, it becomes near constant from about noon onwards (O'Dowd et al., Citation2009). The accuracy of the wind measurements is about ±0.3 m/s (Hacker and Crawford, 1999; Metzger et al., Citation2011). Optimum meteorological conditions for flying budget studies are usually occurring around the hours of solar noon (11:00–14:00) and with mean wind speeds of about 5–10 m/s. Under these conditions the uncertainty for emission rate estimates is in the order of ±20 to ±40%, mainly depending on the accuracy of the transport velocity measurement, the estimation of the average concentration within the plume cross-section and the PBL height (Lelieveld et al., Citation1987).
Based on particle size distributions and HYSPLIT back-trajectories it was possible to identify individual sources of particles by inspecting the modes of the ultrafine particle size distribution (Junkermann et al., Citation2011a). This is different to the approach of Bigg and Turvey (Citation1978), who used the width of particle plumes (from total number concentration) to identify strong sources in larger distances based on an independent study of plume dispersion (Bigg et al., Citation1978) and were further limited by using a single Pollack particle counter only without size information. The size resolving technology now available (fast SMPS, GRIMM, Ainring, Germany) allows a far more detailed direct source identification and allocation on a regional scale especially in the first few hours after emission.
The aircraft was equipped with a combination of meteorological sensors and particle instrumentation, consisting of a BAT-probe (Hacker and Crawford, Citation1999) for high-resolution wind and 3D-turbulence, air temperature, humidity, and pressure measurements, a GRIMM (Ainring, Germany) Wide Range Aerosol Spectrometer (WRAS) for size distribution measurements from 4.5 nm to 20 µm and an additional totally independent fast (1 s) condensation particle counter (CPC) with a 10 nm counting threshold (TSI 3010). The WRAS SMPS consists of a Vienna DMA and a GRIMM CPC3 (model 5403) measuring the ultrafine particle size distribution from 4.5 nm to 350 nm within 2 min, giving approximately 2.5 km horizontal resolution. The WRAS-Optical Particle Spectrometer (OPS, GRIMM, model 1.108) which measures from 300 nm to 20 µm has a time resolution of 6 s. The instruments were mounted on the aircraft in underwing pods, allowing installation of very short air intake lines. Forward pointing stainless steel tips with a diameter in accordance with isokinetic sampling requirements at the nominal cruise speed of the aircraft were fitted at the tip of the intakes. (Junkermann et al., Citation2011a). Particle numbers agree within 5% measured with the CPC and the SMPS as long as concentrations are constant during the 2 min required for an SMPS scan and the majority of the particles is larger than the lower cut-off size (10 nm) of the CPC. The CPC thus serves also as an online high time resolution reference instrument for the SMPS (Wiedensohler et al., Citation2012). SMPS data were analysed according to ISO 15900:2009 (ISO, Citation2009) including multiple charge correction. All aerosol and selected meteorological data are displayed on an online display in the aircraft.
In the vehicle, a personal car, the aerosol instruments taken from the aircraft were installed on the back seat and powered from the car generator. Air was drawn to the instruments via a 120 cm long stainless steel tubing with 2.5 mm inner diameter extending 10–12 cm above the car roof. Residence time in the inlet line was <0.15 s. This inlet is not isokinetic for fine particles; however, it works well for ultrafines as confirmed by direct comparison of the SMPS total particle count with inlet line to the CPC counts without inlet line.
Using a vehicle for ground based surveys is possible with the very low traffic intensity on many of the Australian back-country roads. Interference from other cars is limited and can easily be omitted from the data set. Possible disturbances from other cars or from the own exhaust would be directly visible from enhanced particle numbers in the CPC and OPC and the typical size distribution of fresh car emissions, resembling a characteristic increase in the lowest SMPS size bins below 10 nm.
The aerosol and meteorological instrumentation was previously used for airborne ultrafine aerosol measurements over Western Australia in 2006/2007 (Junkermann et al., Citation2009) and 2011. Since 2007 it is also standard instrumentation on the KIT microlight aircraft (Junkermann, 2005; Junkermann, Citation2011a, Citation2011b).
3. Results
3.1. Flight sector Broken Hill to Chinchilla (SA/NSW/QLD)
Although initially planned as a clean continental air background reference section the ferry flight from Adelaide via Broken Hill and Bourke to Chinchilla encountered a continuous moderate tailwind with unanticipated coincidental tracking of pollution from sources of UFP near Port Augusta (power station) and Port Pirie (industrial complex with copper, lead and zinc smelters) in SA. These particle sources had been identified earlier by Rosenfeld (Citation2000) as sources of cloud relevant particles and a detailed survey would have been useful, but time and weather constraints did not allow for more sophisticated flight patterns. The emissions from these sources were transported by south-westerly winds over ~1200 km within 24 hours more or less along the flight track as confirmed by HYSPLIT trajectories. Airborne measurements were only taken from Broken Hill onwards because occasional rain showers prevented earlier instrument operation. Particle numbers reached about 6000/cm3 during the first day on the track from Broken Hill to Bourke with fairly constant size distributions and number concentrations within±30% (a). During the flight on the second day between Bourke and Chinchilla concentrations varied from 2500/cm3 within the first 2 hours to 9000/cm3 within the last 2 hours with variable size distributions, featuring a significant number of fresh nucleation mode aerosol, far above the typical concentrations for an Australian background aerosol of 700–1000 cm−3 (Bigg and Turvey, Citation1978; Suni et al., Citation2008) (b). No local sources for UFP upwind of the aircraft position in the sparsely inhabited area could be identified, neither visually nor from HYSPLIT back trajectories or in situ wind measurements. Also the Australian National Pollution Inventory (NPI, 2015) does not indicate any significant sulphur emissions in the area. The measured concentrations were therefore most likely related to long-range transport from the two large sources in SA with primary emissions (Rosenfeld, Citation2000; Junkermann et al., Citation2011b) and additional photochemical secondary aerosol production of UFP from remaining sulphur emissions (Lonsdale et al., Citation2012) – even on the second day of transport and more than 800 km downwind. Sulphur dioxide to sulphuric acid conversion in the atmosphere is not fast enough to convert more than an upper limit of ~20% of the SO2 in a power station plume within 1 d (Cantrell and Whitby, Citation1978). Even during one or two consecutive days of transport sulphuric acid can thus be expected to be produced from remaining SO2, leading to additional gas to particle formation within the plume. Plume dispersion rapidly reduces the SO2 mixing ratios during the transport. After ~800 km a plume width of about 200 km could be expected (Bigg, 1978). The Australian National Pollution Inventory now published the data for the 2012 SO2 and H2SO4 annual emissions for Port Augusta (~750 kg/h) and Port Pirie (~7200 kg/h). The resulting diluted SO2 concentration, calculated based on winds and mixed layer depth derived from HYSPLIT analysis is in the order of ~0.3 ppb (6 * 109 molecules cm−3) sufficient for a rapid daylight production of the ~106 sulphuric acid molecules cm−3 required for particle formation (Kulmala et al., Citation2013). The co-emitted H2SO4 from Port Augusta is probably too reactive for long range transport. Dilution alone would result in 4 * 106 molecules cm−3. However, for this flight leg we neither know the exact plume location, nor do we have any data on sulphur dioxide concentrations or other substances required for particle growth.
Fig. 2 (a) Average size distribution of ultrafine particles between Broken Hill and Bourke (NSW) (averages over more than 100 size distributions). Blue bars: Average size distribution of the background particle size distributions (55 size distributions) for the road transect 50–100 km south of the flight path under northerly winds between Nyngan and Broken Hill – for comparison. (b) Red: Average distribution for the first 2 hours of the leg from Bourke to Chinchilla. Blue: average size for the last hour before landing. Black: last 30 min. Black dotted line: highest number concentration (13 200 cm−3) size distribution for the last hour. Numbers indicate the size in nm of individual modes. Distance to Port Augusta power station for the graphs in both panels: Panel (a) 350–800 km; Panel (b) red 850–1100 km, blue 1200–1400 km. For more details, see text and Fig. 1.
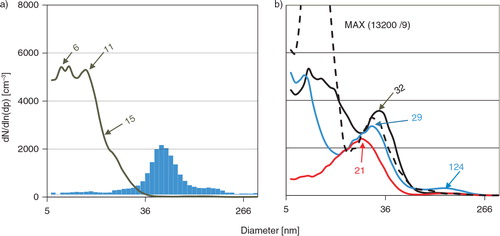
a shows the average of all size distributions of Day 1 (August 24); b shows average size distributions for the first 2 hours, the last hour and the last 30 min of Day 2 before landing at Chinchilla (August 25). All measurements were taken within the boundary layer at approximately 600–900 m AGL. a for comparison also shows the background particle size distribution of air originating from the area below and to the north of the flight path measured 2 weeks later during the vehicle transect on the ground under clear northerly advection (average of all undisturbed ground based size distributions between Nyngan and Broken Hill).
The vehicle-based background measurements in the area south of the flight transect under northerly winds (only data from daytime measurements between 10:00 local time and early afternoon with well-mixed boundary layers were used) always showed lower particle number concentration than what was observed on the aircraft and indicated aged continental particles. They confirm, that no significant sources of UFP exist along that part of the flight. Total particle numbers on this section of the ground-based survey were always in the range of about 1000–1800 cm−3, very similar to previous observations over pristine forested areas in Western Australia (Junkermann et al., Citation2009). Particle numbers in size bins of the nucleation mode (<15 nm) were either very low or not detected.
3.2. Power station surveys
Between Chinchilla, Qld, and north of Rockhampton, Qld, the survey flights concentrated on characterising the emissions and their temporal behaviour from the power stations at Kogan Creek (near Chinchilla), Callide (near Biloela) and Gladstone (near Rockhampton) ( and ). Particle production via sulphuric acid is well known in the engineering community and is the cause of opacity at the chimney (Srivastava et al., Citation2004; Brachert et al., Citation2013, Citation2014). However, the resulting particle emission or formation rate downwind of the chimney is not well known as airborne measurements are required (Pueschel and Van Valin, Citation1978; Whitby et al., Citation1978; Junkermann et al., Citation2011a, Citation2011b). After arriving at Chinchilla on 25 August, an evening survey was flown with south-westerly winds downwind of the Kogan Creek Power Station taking off 30 min before and landing 30 min after sunset. The plume was identified and was crossed three times at distances between 30 and 50 km downwind of the power station with particle number concentrations up to 35 000 cm−3 and geometrical mean diameters between 14 and 19 nm (). The next day, 26 August, under sunny conditions and a generally weak south-easterly wind, a late morning/noon – Lagrangian survey of the Kogan Creek plume was flown (take-off at 11:00 local time). Daytime surveys of the plumes from the power stations near Biloela (Callide), Rockhampton (Stanwell) and Gladstone followed on 27 August.
Fig. 3 Top: Airborne survey in the vicinity of the Kogan Creek Power Station near Chinchilla, Qld. Shown are data from an evening flight on 25 August 2012 (blue) around sunset with prevailing south-westerly winds (three plume cross-sections between 30 and 54 km distance) and from the morning flight (take-off at 11:00 local time) on 26 August 2012 with prevailing south-easterly winds (yellow, plume cross-sections at 12, 48 and 130 km downwind of the power station). Numbers inside the plume cross-sections indicate the maximum particle concentration cm−3 in the plume centre and the geometric mean diameter of the particle size distribution. Also shown is the flight track (red). Bottom: Size distributions measured within the centre of the first (12 km) and last (130 km) plume crossing, blue line with yellow infill for daytime and blue line with blue infill for the sunset survey. The colours indicate the respective plume study, yellow/orange first transect, red last transect, aged plume.
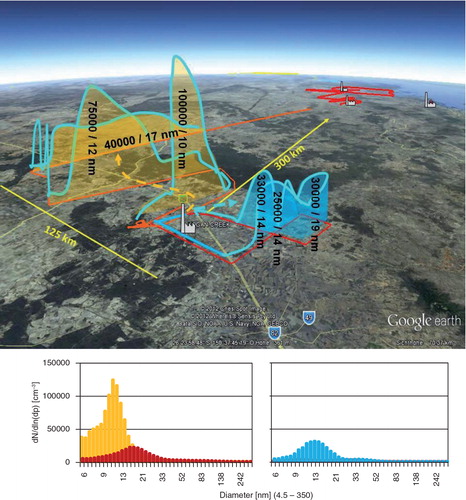
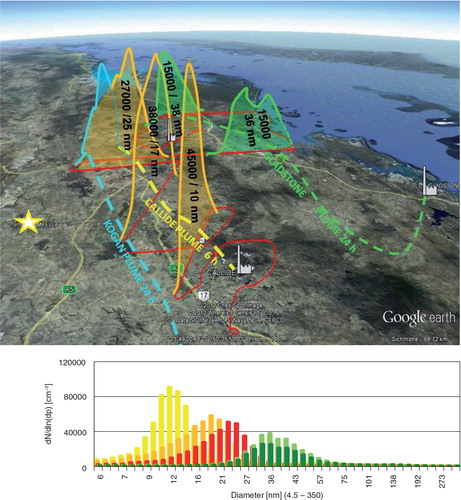
Fig. 4 Airborne survey in the vicinity of the Biloela (Callide) and Gladstone power stations, for the survey flight on 26 August 2012 from Thangool to Rockhampton, take-off at 11:00 local time. Top: Plume cross-sections for the Callide power station (yellow, 20, 50 and 80 km downwind of the power station) and for the combination of sources at Gladstone (green). The dashed lines show the HYSPLIT back-trajectories and the modelled age of the three plumes. The star marks Myella Farm, the location for ground-based measurements shown in Fig. 5. Bottom: Size distributions measured in the centre of the plumes (using the same colour scheme as in the top diagram, yellow – Callide, green – Gladstone). Shown are averages of the three size distributions with the highest number concentration in the plume centre. The colours indicate the respective plume study, yellow/orange: first transects; red: last transect – ageing Callide plume; green: Gladstone plume.
Results of the two plume studies at Kogan Creek are shown in . Within the first cross-section late morning we measured >100.000 particles cm−3, concentrations that are otherwise typical for high levels of urban pollution (Bae et al., Citation2010). Winds were low at about 2–2.5 m/s and PBL increased from ~900 estimated after the first plume transect to about 1600 m in the last cross-section. HYSPLIT reanalysis and in situ estimates agree within 100 m. shows the results of the Callide and Gladstone plume surveys with maximum number concentrations in the plume cross-sections together with the mean geometrical size in nm. On that day (27 August 2012), the Stanwell power station plume could not be located (probably caused by flying the survey legs too close to the source). Stanwell power station nevertheless had been already identified as one of the major sources in the 2011 preliminary study mentioned above and was also identified again later during the vehicle-based survey. Number concentrations measured (using fast CPC and total SMPS number concentrations) are shown in the upper panels of and , size distributions measured in the centre of the plume from the SMPS in the lower panel. Concerning particle number concentrations, sizes and particle growth, all investigated plumes showed very similar characteristics to observations elsewhere (Junkermann et al., Citation2011a, Citation2011b), with very high number concentrations of UFP mainly in the nucleation mode and predominately aged particles in the accumulation mode outside of the plume area. Upwind of individual power stations and outside of the plumes, particle numbers were typically well below 3000–5000 cm−3. In contrast to the expectation that – without further particle production – coagulation during transport would lead to a loss of particles in ageing plumes such as these, increasing total numbers within the plume cross-sections were found for daytime hours. This can be explained by additional gas-to-particle conversion from co-emitted particle precursor gases like sulphur dioxide, nitrogen oxides, etc. following conversion of SO2 to via OH radical chemistry (Lonsdale et al., Citation2012; Pietikäinen et al., Citation2014). Such particle production in sulphur-rich plumes is dependent on the SOX/NOX mixture and on the background pollution levels (Lonsdale et al., Citation2012). The conditions in Queensland with low background pollution are most favourable for such in-plume nucleation mode particle generation.
3.3. Particle budgets and source strengths
As described in Bigg and Turvey (Citation1978), Lelieveld et al. (Citation1987) and Junkermann et al. (2011a, 2011b), particle emission source strengths can be derived from airborne plume cross-section measurements multiplied with the average wind speed measured by the aircraft during the plume transects with an accuracy of about ±25–50% (Lelieveld et al., Citation1987). This accuracy depends on the accuracy of the wind measurement and the estimate of the total plume cross-section (horizontal extend and PBL height). The height of the PBL is derived at least once during each flight from vertical profile measurements of particles, potential temperature and water vapour that are also used to confirm, that the PBL is well mixed. Finally it is also compared to HYSPLIT reanalysis data that also contain the diurnal behaviour of the mixed layer depth. The total number of particles within the plume cross-section was calculated from the number concentration of particles integrated over the area of the plume (all data exceeding twice the background) and background particle concentrations were subtracted. From previous studies in Germany, China and Australia, including the one at the Port Augusta power station (Junkermann et al., Citation2011a, Citation2011b), a particle flux within the first 2 hours of transport in the order of ~2 * 1018 particles per second per ~600 MW of power generation was derived using this method. Very similarly, the estimates for the Queensland power stations were ~3 * 1018 s−1 directly downwind of Kogan Creek (750 MW) on the evening of 25 August, and again within 10% of this estimate for the first plume transect close to the power station (about 20 km) in the late morning of 26 August. Due to the low wind speed at that day (however constant within 20% in all three plume transects) and the varying PBL mixed layer depth between 860 m for the first transect and 1600 m for the third one, the plume budget is less precise, but still estimated to be better than ±40%. The estimate for the first plume transect downwind of the larger station Callide (Callide A, B and C, 1630 MW) around midday of 26 August was ~6 * 1018 s−1 (plume width 23 km, wind speed 9 m/s, PBL 900 m, average number concentration 30 000 cm−3, estimated error ±30%) These values of primary emissions from cross-sections close to the source and at sunset can be taken as a lower limit of the total particle emission rates as the source for these primary emissions inside the flue gas system is independent of any environmental conditions. Secondary production of new particles is than additionally continuing within the plumes due to the co-emitted SO2 reacting with OH radicals under favourable (sunny) conditions (Lonsdale et al., Citation2012) and may increase the total particle number flux in ageing plumes. During daytime, this secondary aerosol production in sulphur rich plumes which is dependent on the SO2/NOx ratio and other variables, not only compensates for coagulation losses, but also leads to a further increase up to a doubling of the particle flux under sunny, clear sky conditions as can be seen in showing the plume transect at about 130 km distance from Kogan Creek which equals approximately 8 hours of transport after emission.
Primary particles are emitted at sizes of a few nm (Srivastava et al., Citation2004; Junkermann et al., Citation2011a; Brachert et al., Citation2013, Citation2014). Observed growth rates derived from mean geometric diameter in the plume centre, an emission size of ~8 nm, and the travelling time from the source derived from HYSPLIT agree with those reported from previous ground based and airborne studies with an initial rate of ~3–8 nm/h up to a diameter of about 25–30 nm (Kulmala et al., Citation2004; Suni et al., Citation2008; Junkermann et al., Citation2011a). The exact size of the primary emitted particles cannot be exactly specified, Brachert et al. (Citation2014) estimated a minimum of 8 nm from a power station stack model, Junkermann et al. (2011a) extrapolated from airborne plume data ~4 nm. The current study indicates a range of 6–8 nm. The final, initial size in the atmosphere may depend on the initial ambient conditions in the plume, temperature and humidity, at the exit of the chimney, when hot and humid flue gas is cooled down and dried rapidly. Growth rates, derived from the size distributions, depend strongly on the mixture of primary emitted and additional secondarily produced particles. As shown in the bottom panels of and , the main size modes within the distributions shift slowly towards larger particles (Junkermann et al., Citation2011a), with the low size bins being refilled during the day by new particle formation (NPF) within the plumes. Laaksonen et al., (Citation2005) report particle growth to CCN sizes within about 10 hours. During the Lagrangian plume studies we were not able to follow the plumes for that long a time, except for the unanticipated and incomplete case study of the Port Augusta plume. In all cases, however, there was no indication that growth would cease after a few hours only.
3.4. Investigations of background air and of possible biogenic or shipping related sources north of Rockhampton
The aim of the survey for another >1000 km, from Rockhampton via Cairns and Townsville to Cape Flattery near Cooktown was to characterise background conditions and to search for other possible ultrafine particle sources, either from (biogenic) nucleation within or above the rainforests (Suni et al., Citation2008), from the GBR (Bigg and Turvey, Citation1978), or from other sources, not identified previously. The flight path basically followed the eastern escarpment of the Great Dividing Ranges, with some minor excursions to the western side of the mountains due to low cloud and showers along the coast between Townsville and Cairns (). Most of the time, easterly winds prevailed leading to advection of maritime air masses.
Particle number concentrations rapidly declined towards concentrations of about 2500 particles cm−3 or less north of Rockhampton with winds turning more easterly ( and ). shows the highly variable particle size distributions at Myella in the plume-affected area 100 km downwind of the two large power stations Callide and Stanwell, and comparison to the ‘background’ north of Rockhampton. shows a comparison of background size distributions in the more remote areas. UFP in the smallest size bins were no longer dominating in all these ‘background’ size distributions. Total particle number concentrations north of Townsville were generally lower over the inland forested and agricultural areas than over the open sea (, averages of >50 size distributions for both areas). The particle size distributions and total numbers observed during this part of the survey were very similar to particles found over the pristine Western Australian forests (Junkermann et al., Citation2009 and unpublished data from a campaign in March 2011). Particle numbers between 1000 and 1700 cm−3 were measured over the rainforest at the escarpment and slightly, but not significantly higher numbers (up to 2500 cm−3, >50 size distributions each) within the marine boundary layer below 500 m over the sea. Such particle levels are typical for Australian clean conditions (Suni et al., Citation2008; Junkermann et al., Citation2009) but are nevertheless larger than the clean background concentrations reported 40 yr ago (Bigg and Turvey, Citation1978). Size modes indicated aged particles larger than 20 nm. Obvious signatures in the size distributions, indicating NPF, i.e. particles in the smallest size ranges between 4.5 and 15 nm were neither found over the sea nor over land in these air masses which were not affected by sulphur emissions from fossil fuel burning industries, even hundreds of kilometres upwind. As shown in , the size distributions over the sea have slightly more particles in the lower size ranges. All particle concentrations along the coast were significantly lower than those over the areas downwind of the power stations. The slightly higher fraction of smaller particles over the sea might originate from ship emissions. However, with the low shipping intensity between the coast and the Reef in this area, a continuous and significant effect of ship emissions was too low to be quantified. Yet, several days of ground-based measurements on the shore north of Townsville and at Lennox Head, the eastern-most point of Australia south of Brisbane, as well as further measurements downwind of the port of Townsville indicate that ship emissions can occasionally and locally increase the particle numbers at the coast to approximately 10 000 cm−3.
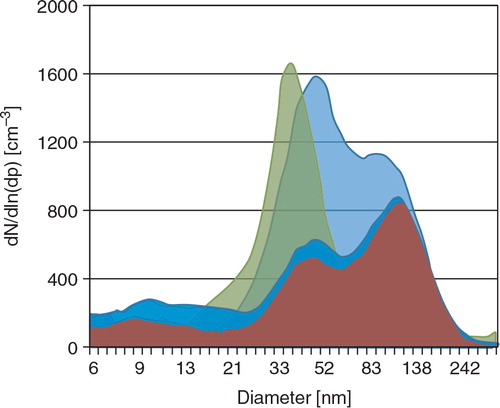
Fig. 5 Average size distributions measured on the ground at Myella Farm (see Figs. 1 and 3 for locations), ~100 km west of Biloela (Callide power station) during daylight hours. Blue: first hour; green: average of low concentration (<6000 cm−3) measurements; red and purple: averages of two half hour episodes with >12 000/cm−3. Black: average of all measurements during the day. HYSPLIT trajectories indicate that Stanwell and Callide power stations are the major ultrafine particle sources. The filled blue curve shows the background size distribution inland between Rockhampton and Cairns (average over 50 size distributions/from about 2 flight hours or 200 km) – for comparison.
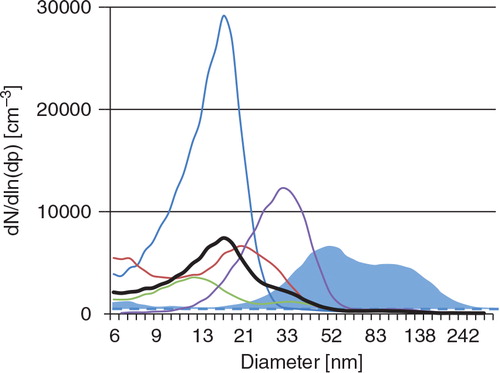
Fig. 6 Background size distributions over the rain forest north of Cairns (red) during the flight to Cape Flattery (Lizard Island) and the return flight to Cairns over the open water (dark blue). Also shown are background size distributions measured over the hinterland forests north of Rockhampton (light blue) and during the vehicle transect in inland northern NSW (green) (average over 50 size distributions/about 2 flight hours or 200 km, road transect – 80 distributions ~500 km or ~8 hours).
3.5. Emissions from other sources
It is interesting to note that at no stage during the current survey with maritime air masses over the forests of the Great Dividing Ranges, nor during all our previous airborne surveys over the forests of Western Australia in 2006, 2007 and 2011 (Junkermann et al., Citation2009, unpublished data from the 2011 campaign during north-westerly air mass advection from the Indian Ocean) were any signatures of biogenic NPF detected, nor were any ultrafine particle emissions found related to open cut mining activities. ‘Typical’ NFP events show nucleation mode particle number concentrations exceeding 10 000 cm−3, as observed over Italy (Laaksonen et al., Citation2005), Finland (O'Dowd et al., Citation2009) and Western Australia (Junkermann et al., Citation2009) with the same instrumentation as used in our study. Very similar to the Bigg and Turvey (Citation1978) survey, all major particle events in the present study with significantly enhanced ultrafine particle numbers could clearly be traced back to industrial installations burning sulphur-containing fossil fuel. Also essential for the particle budget within the first transects close to the power stations is the observation that no significant differences in the particle flux close to the power stations were found between day and night (i.e. at sunset and late morning hours). This further confirms the hypothesis that a significant fraction of the initial steps of the nucleation process and also the particle production already takes place inside the power stations’ smoke stacks and is not photochemistry-driven (Srivastava et al., Citation2004; Junkermann et al., Citation2011a, Citation2011b; Lonsdale et al., 2012; Brachert et al., 2014). Primary particles from such processes, once emitted into the atmosphere, are no longer distinguishable from particles originating from secondary atmospheric nucleation. Due to the elevated emission height of the power station plumes, ground-based measurements in the direct vicinity of the power stations rarely find high particle numbers. Yet, increased particle concentrations were always detectable on the ground approximately 15 to 20 km downwind.
Forest fires, common in Australia for centuries (Crowley and Garnett, Citation2012), can occasionally be a locally dominating source of particulate matter. Measurements of particle emission factors (Janhäll et al., Citation2010) are scarce, but Bigg and Turvey (Citation1978) reported occasional source strengths of up to 1019 s−1 and Warner (Citation1968) discussed a possible effect of sugar cane fires on rainfall. However, as already pointed out in Bigg and Turvey (Citation1978), these sources are not continuous and therefore less important for the total long-term budget than continuous 24 hours, 365 d industrial emissions. In addition, new environmental protection regulations have diminished the occurrence of such anthropogenic fires significantly over recent years.
4. Summary and discussion
This study presents airborne and ground/vehicle-based mobile measurements of the spatial distribution of UFP serving as possible precursors of CCN over inland parts of Northern NSW and along the Queensland coastal areas. This area is an ideal natural laboratory to investigate emissions from an array of coal-fired power stations located in a relatively sparsely inhabited, predominately agricultural and partially forested region. Power stations have clearly been identified as major sources for significant primary emissions of UFP. Natural and biogenic sources for UFP under discussion and addressed within this study were those from forests or from the GBR, as well as from forest fires. The current study confirmed the general apportionment of major anthropogenic aerosol sources over Australia found by Bigg and Turvey (Citation1978) 40 yr ago to the burning of sulphur-containing fossil fuel in power stations and smelters. However, significant changes in the number and locations of these major sources were detected. Since 1974, when only Callide A was operational, eight new large coal-fired power stations were commissioned and existing stations (Callide) were substantially enlarged. Most of the ‘new’ stations are now located in remote areas of the Queensland hinterland. The results presented here revealed that these ‘new’ coal-fired power stations commissioned between 1966 (Callide) and 2008 (Kogan Creek) are major sources for ultrafine particle number concentrations along the Queensland coast and within the first 200 km of the hinterland. It was not possible to locate or quantify any other comparable sources for UFP over 10 flying days and 3600 km distance. During the survey 40 yr ago, Callide A was operational while the Gladstone power station had just been commissioned in the year of the measurements (1976), but the exact date of when its operations started is not known. Both sources could also have easily been missed during the survey with the technology available at the time, consisting of airborne condensation nuclei (CN) number measurements, in situ winds and synoptic weather charts. HYSPLIT back trajectory re-analyses available now for the years of the Bigg and Turvey (Citation1978) measurements indicate that even the 1976 GBR measurements might have been affected by long range transport from these older power stations.
During several days of measurements during our study over ‘clean’ inland and coastal regions outside of the coal mining and coal burning areas, mainly under the advection of maritime air masses, no signatures of biogenic NPF were found from the GBR or such as reported from other Australian forest environments (Suni et al., Citation2008) despite favourable meteorological conditions for such a nucleation (Baranizadeh et al., Citation2014). Anthropogenic plumes however, could always be traced within the PBL, based on the size distributions, real time in-situ wind measurement and HYSPLIT trajectories over several hundreds of kilometres, typically following the local orography.
Conducting plume studies at different times of the day using Lagrangian flight patterns, it was possible to estimate the source strength of primary emissions from individual power stations. Furthermore, these measurements made it possible to address the question of whether the UFP in the plumes are emitted as a result of primary production within the power station itself or are produced later through secondary processes in the atmosphere from gas-to-particle conversion. This question is important for the overall budget of particle production because primary emission runs 24 hours per day while photochemical production is active only during the hours of sunshine. In contrast to previous plume studies which concentrated either on ‘dirty’ (Pueschel and Van Valin, Citation1978; Whitby et al., Citation1978) or on only ‘partially cleaned’ power stations (Brock et al., Citation2002; Zaveri et al., Citation2010), the current study investigated emissions from state-of-the-art ‘clean’ power stations, their size distributions and the temporal development within the ageing plumes. Using highly mobile (in a three-dimensional sense) airborne measurements and size distributions available in real-time during the flights as the primary criteria for source apportionment, it was possible to follow plumes over hundreds of kilometres in Queensland and most probably even for more than 1000 km from SA into south-west Queensland. The particle emission rates derived from the plume studies are well within a range that was observed elsewhere with about ~2–3 * 1018 s−1 for a typical size power station with a capacity of ~700 MW. The particle source strength of the individual power stations was thus in the same order of magnitude as the ultrafine particle emissions estimated for one of the major cities in Australia in 1976 by Bigg and Turvey (Citation1978), Perth in Western Australia. As above, HYSPLIT back trajectory calculations for 1976 confirmed that at that time at least one coal-fired power station Muja (900 MW) upwind of Perth contributed significantly to these previous measurements (Bigg et al., Citation2015). Within the plumes, increasing total particle numbers were found which is in agreement with the current understanding that within such sulphur and nitrogen rich plumes further particle production continues during daytime following initial photochemical conversion of SO2 into sulphuric acid (Lonsdale et al., Citation2012). This additional particle formation compensates a loss of particles due to coagulation under the favourable conditions over Queensland. Such a behaviour was already reported for some of the industrial plumes during the 1974–1976 surveys of Bigg and Turvey (Citation1978) but was not further investigated at that time due to missing information about the aerosol size distributions in these early studies.
Detailed discussions about the production of CCN from UFP and their dependence on size and chemistry are beyond the scope of this paper. They can be found in Pierce and Adams (Citation2007), Zhang et al. (Citation2012), Kerminen et al. (Citation2012) and Westervelt et al. (Citation2013). The conditions in Queensland with high availability of sulphur dioxide and only marginal concentration of fine particulate matter (particles between 100 nm and 2.5 µm, PM 2.5) favour the survival and growth of both, primary emitted or secondary produced, UFP into highly hygroscopic particles (Lonsdale et al., Citation2012). A threshold of 40 nm is considered as a reasonable proxy for such sulphur containing CCN (King et al., Citation2007; Andreae, Citation2009). This threshold would also be in agreement with the clear signature of cloud modification observed from satellites (Rosenfeld, Citation2000) already after less than 2 hours from Port Augusta and Port Pirie, two sources that we investigated in October 2014 during another flight campaign (not published yet) and found to emit ~3.2 * 1018 and ~5.3 * 1018 particles s−1 respectively. Within the surveyed plumes of the current study, 2 hours after emission the majority of the particles was still smaller (Figs. (Citation2–Citation4)). Most of the emitted particles are thus expected to further grow to CCN relevant sizes within a few more hours (Laaksonen et al., Citation2005; Kerminen et al., Citation2012) during transport of up to hundreds of kilometres [see also the extension of the plumes in Ayers et al. (1979), Rosenfeld (Citation2000) and Rosenfeld et al. (Citation2006)].
Emissions associated with industrial activities and mining have previously been reported to show high CCN source strength. A typical example from Australia is the work of Ayers et al., (Citation1979) who studied the industrial source located at Mt. Isa, Qld, with a CCN source strength of 2 * 1018 s−1, making it the most significant source in North Queensland in 1976–1978 and claiming that its production rate was ~0.1% of the global CCN production at that time. Interestingly, the particle budget studies presented in the current study show that even this source, which is still active today, though with reduced sulphur emissions (Manins et al., Citation2001), is now only one of several large sources for UFP in Queensland and is, although still one of the largest Australian SO2 sources (NPI), in terms of ultrafine particle number source strength, surpassed by the agglomeration of power stations in the hinterland between Brisbane and Rockhampton.
The absence of biogenic nucleation events during the current campaign does not mean that such biogenic nucleation does not take place in Queensland. It is only an indication that, biogenic nucleation events are either not every day phenomena in the region, occurring at night, or are too low in concentration (Suni et al., Citation2008) to be detectable from the aircraft flying in the mid or upper half of the mixed boundary layer. Enhanced nucleation mode particles found in previous airborne campaigns could be traced back to ground-based salt lake emissions over agricultural land, which are probably also linked to sulphur chemistry. All primary nucleation mode particle emissions were due to anthropogenic burning of fossil fuel.
Based on the findings by Bigg and Turvey (Citation1978), it was expected to identify at least some particle production from the biogenic activity of the GBR. However, as that study already claims that the reported particle emission was a sporadic event only and not reproducible from additional long term local measurements made on an island between the Reef and the continent, it can be hypothesised, that the reported activity may have rather been the result of long range transport from either Callide or Gladstone power stations instead of from the GBR. This hypothesis is supported by assessments based on HYSPLIT back trajectories for the time of the 1976 research flights.
Considering recent model calculations (Teller and Levin, 2006; Zhao et al., Citation2012) and experimental evidence from other studies (Rosenfeld Citation2000; Rosenfeld et al., 2006), the anthropogenic ultrafine particle production is well within the order of magnitude that can – after further growth to CCN sizes – contribute to rainfall modifications suspected previously (Warner, Citation1968; Pueschel and Van Valin, Citation1978; Rosenfeld Citation2000; Rosenfeld et al., 2006; Bigg, Citation2008; Junkermann et al., Citation2009, Citation2011b) independently of whether 10% (Bigg and Turvey, Citation1978) or 30% (Andreae, Citation2009) of the CN, measured by the CPC's, survive. The Australian Bureau of Meteorology reports clear negative trends in precipitation over land within the area since 1970 (BOM, Citation2014) following 80 yr without rainfall trends from 1890 to 1970. Among the changes reported by the Australian Bureau of Meteorology since 1970 are: a reduction of rainfall days along the Sunshine Coast in SE-Queensland by up to 8 d per decade; a change from low intensity rain events to longer, or more severe drought events; and a shift towards more vigorous single rain events. All of these patterns are consistent with expected consequences of enhanced ultrafine particle number concentrations impact on cloud microphysics and radiation (Teller and Levin, Citation2006; Feingold and Siebert, Citation2009; Li et al., Citation2011). However, from the few and short-term measurements presented in this study, a direct causality relationship cannot be established.
It is, however, interesting to note, that the observed negative trend in rainfall commenced at the same time when the first intense particle source in the area (Callide) began to operate and that the rainfall trend is negatively correlated to the growing total emission of UFP from the increased number of major ultrafine particle sources installed within the area.
According to a regional modelling study by Zhao et al. (Citation2012) covering an area similar in size to eastern Queensland, the aerosol-cloud-precipitation system is particularly sensitive to injection of additional aerosol particles into the boundary layer just below the cloud base. Adding aerosols acting as CCN into that model layer resulted in a significant reduction of rainfall up to 1500 km downwind. As the power station stacks with ~200 m height are emitting the flue gas with UFP into elevations above 300 m above ground, upward mixing to the layers where cloud formation and also longer-range transport takes place can be expected to be rather efficient.
Given the good historical data base since 1900 on meteorological variables, the long term homogeneous landscape and marginal land use change together with the high production rate of additional UFP originating from well-defined sources, which allows to reconstruct the ‘laboratory notebook’ of this experiment, the area of this study would offer a unique opportunity for a regional-scale modelling study investigating aerosol–cloud–precipitation interaction with aerosol and cloud microphysics resolving models (Vogel et al., Citation2009; Zhao et al., Citation2012; Matsui et al., Citation2014), supported by more extensive in-situ measurements of source strengths including detailed size and mass distributions and the partitioning between nucleation and accumulation mode emissions which are essential for CCN production (Pierce and Adams, Citation2009; Wang and Penner, Citation2009).
Finally we would like to add that we did not find a ‘new’ source of nucleation mode particles. Significant CCN production in such plumes was already reported by Pueschel and Van Valin (1978) and Whitby et al. (Citation1978). Emission reduction measures, however, lead to a shift of the emitted particle size distribution towards and an intensification of the nucleation mode (Junkermann et al., Citation2011a, Citation2011b). Also, coal-fired power stations are well known as the major continental sources for sulphur compounds required for the ion clusters initiating nucleation (NPI, 2015; Kulmala et al., Citation2013). However, we found that many of these intensive primary particle sources are now located in a sparsely inhabited remote area specifically sensitive to an increase in changes of cloud microphysics relevant particles. Our study, thus, provides support for consideration of UFP, power plant location, and local cloud modification as additional criteria in consideration for air quality and energy regulatory policy.
5. Acknowledgement
The authors gratefully acknowledge the NOAA Air Resources Laboratory (ARL) for the provision of the HYSPLIT transport and dispersion model and/or READY website (http://www.ready.noaa.gov) used in this publication. Financial support for this campaign was provided by the KIT International Excellence Fund, contract # 120120/17.
References
- Aitken J . On the number of dust particles in the atmosphere. Trans. Roy. Soc. Edinb. 1888; 35(Pt.1): 1–19.
- Albrecht B. A . Aerosols, cloud microphysics, and fractional cloudiness. Science. 1998; 254: 1227–1230.
- Andreae M. O . Correlation between cloud condensation nuclei concentration and aerosol optical thickness in remote and polluted regions. Atmos. Chem. Phys. 2009; 9: 543–556.
- Andreae M. O . The aerosol nucleation puzzle. Science. 2013; 339(911):
- Asmi A. , Coen C. , Ogren M. , Andrews J. A. , Sheridan E. , co-authors . Aerosol decadal trends – Part 2: In-situ aerosol particle number concentrations at GAW and ACTRIS stations. Atmos. Chem. Phys. 2013; 13: 895–916.
- Ayers G. P. , Bigg E. K. , Turvey D. E . Aitken particle and cloud condensation nucleus fluxes in the plume from an isolated industrial source. J. Appl. Meteorol. 1979; 187: 449–459.
- Bae M.-S. , Schwab J. J. , Hogrefe O. , Frank B. P. , Lala G. G. , co-authors . Characteristics of size distributions at urban and rural locations in New York. Atmos. Chem. Phys. 2010; 10: 4521–4535.
- Baranizadeh E. , Arola A. , Hamed A. , Nieminen T. , Mikkonen S. , co-authors . The effect of cloudiness on new-particle formation: investigation of radiation levels. Boreal Environ. Res. 2014; 19(Suppl B): 343–354.
- Bigg E. K . Trends in rainfall associated with sources of air pollution. Environ. Chem. 2008; 5: 184–193.
- Bigg E. K. , Ayers G. P. , Turvey D. E . Measurement of the dispersion of a smoke plume at large distances from the source. Atmos. Environ. 1978; 12: 1815–1818.
- Bigg E. K. , Soubeyrand S. , Morris C. E . Persistent after-effects of heavy rain on concentrations of ice nuclei and rainfall suggest a biological cause. Atmos. Chem. Phys. 2015; 15: 2313–2326.
- Bigg E. K. , Turvey D. E . Sources of atmospheric particles over Australia. Atmos. Environ. 1978; 12: 1643–1655.
- BOM. Australian Bureau of Meteorology. 2014. Online at: http://www.bom.gov.au/cgi-bin/climate/change/trendmaps.cgi.
- Brachert L. , Kochenburger T. , Schaber K . Facing the sulfuric acid aerosol problem in flue gas cleaning: pilot plant experiments and simulation. Aerosol Sci. Technol. 2013; 47: 1083–1091.
- Brachert L. , Mertens J. , Khakharia P. , Schaber K . The challenge of measuring sulfuric acid aerosols, number concentration and size evaluation using a condensation particle counter (CPC) and an electrical low pressure impactor (ELPI). J. Aerosol Sci. 2014; 67: 21–27.
- Brock C. A. , Washenfelder R. A. , Trainer M. , Ryerson T. B. , Wilson J. C. , co-authors . Particle growth in the plumes of coal-fired power plants. J. Geophys. Res. 2002; 107: 4155.
- Cantrell B. K. , Whitby K. T . Aerosol size distributions and aerosol volume formation for a coal fired power plant plume. Atmos. Environ. 1978; 12: 323–333.
- Crowley G. M. , Garnett S. T . Changing fire management in the pastoral lands of Cape York Peninsula of northeast Australia, 1623 to 1996. Aust. Geogr. Stud. 2012; 38: 10–26.
- Draxler R. R. , Rolph G. D . HYSPLIT (Hybrid Single-Particle Lagrangian Integrated Trajectory) Model Access via NOAA ARL READY. 2013. NOAA Air Resources Laboratory, Silver Spring, MD.
- Feingold G. , Siebert H . Heintzenberg J. , Charlson R . Cloud-aerosol interactions from the micro to the cloud scale. Clouds in the Perturbed Climate System. 2009; Cambridge, pp. 319–336: MIT Press.
- Givati A. , Rosenfeld D . Quantifying precipitation suppression due to air pollution. J. Appl. Meteorol. 2004; 43: 1038–1056.
- Gras J. L . CN, CCN and particle size in Southern Ocean air at Cape Grim. Atmos. Res. 1995; 35: 233–251.
- Hacker J. M. , Crawford T . The BAT-Probe: the ultimate tool to measure turbulence from any kind of aircraft (or sailplane). Tech. Soaring. 1999; 23: 43–46.
- Heikes B. G. , Thompson A. M . Effects of heterogeneous processes on NO3, HONO, and HNO3 chemistry in the troposphere. J. Geophys. Res. 1983; 88: 10883–10895.
- Heintzenberg J . Fine particles in the global troposphere, a review. Tellus B. 1989; 41: 149–160.
- Hobbs P. V. , Radke L. F. , Shumway S. E . Cloud condensation nuclei from industrial sources and their apparent influence on precipitation in Washington State. J. Atmos. Sci. 1970; 27(81):
- ISO 15900:2009. Online at: http://www.iso.org/iso/catalogue_detail.htm?csnumber=39573.
- Jaenicke R . On the dynamics of atmospheric Aitken particles. Ber. Bunsenges. Phys. 1978; 82: 1198–1202.
- Janhäll S. , Andreae M. O. , Pöschl U . Biomass burning aerosol emissions from vegetation fires: particle number and mass emission factors and size distributions. Atmos. Chem. Phys. 2010; 10: 1427–1439.
- Junkermann W . The actinic UV-radiation budget during the ESCOMPTE campaign 2001: Results of airborne measurements with the microlight research aircraft D-MIFU. Atmospheric Research. 2005; 74: 461–475.
- Junkermann W. , Hacker J. , Lyons T. , Nair U . Land use change suppresses precipitation. Atmos. Chem. Phys. 2009; 9: 6531–6539.
- Junkermann W. , Hagemann R. , Vogel B . Nucleation in the Karlsruhe plume during the COPS/TRACKS – Lagrange experiment. Q. J. Roy. Meteorol. Soc. 2011a; 137: 267–274.
- Junkermann W. , Vogel B. , Sutton M. A . The climate penalty for clean fossil fuel combustion. Atmos. Chem. Phys. 2011b; 11: 12917–12924.
- Kerminen V.-M. , Paramonov M. , Anttila T. , Riipinen I. , Fountoukis C. , co-authors . Cloud condensation nuclei production associated with atmospheric nucleation: a synthesis based on existing literature and new results. Atmos. Chem. Phys. 2012; 12: 12037–12059.
- Khain P . Notes on state-of-art investigations of aerosol effects on precipitation: a critical review. Environ. Res. Lett. 2009; 4(015004):
- King S. M. , Rosenoern T. , Shilling J. E. , Chen Q. , Martin S. T . Cloud condensation nucleus activity of secondary organic aerosol particles mixed with sulfate. Geophys. Res. Lett. 2007; 34: 24806.
- Konwar M. , Maheskumar R. S. , Kulkarni J. R. , Freud E. , Goswami B. N. , co-authors . Suppression of warm rain by aerosols in rain-shadow areas of India. Atmos. Chem. Phys. Discuss. 2010; 10: 17009–17027.
- Kulmala M. , Kerminen V.-M . On the formation and growth of atmospheric nanoparticles. Atmos. Res. 2008; 90: 132–150.
- Kulmala M. , Kontkanen J. , Junninen H. , Lehtipalo K. , Manninen H. E. , co-authors . Direct observations of atmospheric aerosol nucleation. Science. 2013; 339: 943–946.
- Kulmala M. , Vehkamäki H. , Petäjä T. , Dal Maso M. , Lauri A. , co-authors . Formation and growth rates of ultrafine atmospheric particles: a review of observations. J. Aerosol Sci. 2004; 35: 143–176.
- Laaksonen A. , Hamed A. , Joutsensaari J. , Hiltunen L. , Cavalli F. , co-authors . Cloud condensation nucleus production from nucleation events at a highly polluted region. Geophys. Res. Lett. 2005; 32(6): 06812.
- Lee I. Y. , Hänel G. , Pruppacher H. R . A numerical determination of the evolution of cloud drop spectra due to condensation on natural aerosol particles. J. Atmos. Sci. 1980; 37: 1839–1853.
- Lee L. A. , Pringle K. J. , Reddington C. L. , Mann G. W. , Stier P. , co-authors . The magnitude and causes of uncertainty in global model simulations of cloud condensation nuclei. Atmos. Chem. Phys. 2013; 13: 8879–8914.
- Lelieveld J. , Jansen F. W. , den Tonkelaar J. F . Assessment of transboundary mass fluxes of air pollutants by aircraft measurements: a preliminary survey with reference to a case study. Atmos. Environ. 1987; 21: 2133–2143.
- Li Z. , Niu F. , Fan J. , Liu Y. , Rosenfeld D. , Ding Y . Long-term impacts of aerosols on the vertical development of clouds and precipitation. Nat. Geosci. 2011; 4: 888–894.
- Lohmann U. , Feichter J . Global indirect aerosol effects: a review. Atmos. Chem. Phys. 2005; 5: 715–737.
- Lonsdale C. R. , Stevens R. G. , Brock C. A. , Makar P. A. , Knipping E. M. , co-authors . The effect of coal-fired power-plant SO2 and NOx control technologies on aerosol nucleation in the source plumes. Atmos. Chem. Phys. 2012; 12: 11519–11531.
- Lucas C. A High-quality Historical Humidity Database for Australia. 2010. CAWCR Technical Report 024, CSIRO, Australia. Online at: http://www.cawcr.gov.au/publications/technicalreports/CTR_024.pdf.
- Manins P., Holper P., Suppiah R., Allan R., Walsh K., co-authors. Australia State of the Environment Report 2001 (Theme Report). 2001. Online at: http://www.environment.gov.au/node/21559.
- Matsui H. , Koike M. , Kondo Y. , Fast J. D. , Takigawa M . Development of an aerosol microphysical module: aerosol two-dimensional bin module for foRmation and Aging Simulation (ATRAS). Atmos. Chem. Phys. 2014; 14: 10315–10331.
- Metzger S. , Junkermann W. , Butterbach-Bahl K. , Foken T . Corrigendum to “Measuring the 3-D wind vector with a weight-shift microlight aircraft.”. Atmos. Meas. Tech. 2011; 4: 1421–1444. 1515–1539.
- Merikanto J. , Spracklen D. V. , Mann G. W. , Pickering S. J. , Carslaw K. S . Impact of nucleation on global CCN. Atmos. Chem. Phys. 2009; 9: 8601–8616.
- Nair U. S. , Wu Y. , Kala J. , Lyons T. J. , Pielke R. A. Sr , co-authors . The role of land use change on the development and evolution of the west coast trough, convective clouds, and precipitation in southwest Australia. J. Geophys. Res. 2011; 116: 07103.
- NPI (National Pollution Inventory of Australia). 2015. Online at: www.npi.gov.au/npidata/.
- O'Dowd C. D. , Yoon Y. J. , Junkermann W. , Aalto P. , Kulmala M. , co-authors . Airborne measurements of nucleation mode particles II: boreal forest nucleation events. Atmos. Chem. Phys. 2009; 9: 937–944.
- Pierce J. R. , Adams P. J . Efficiency of cloud condensation nuclei formation from ultrafine particles. Atmos. Chem. Phys. 2007; 7: 1367–1379.
- Pierce J. R. , Adams P. J . Uncertainty in global CCN concentrations from uncertain aerosol nucleation and primary emission rates. Atmos. Chem. Phys. 2009; 9: 1339–1356.
- Pietikäinen J. P. , Mikkonen S. , Hamed A. , Hienola A. I. , Birmili W. , co-authors . Analysis of nucleation events in the European boundary layer using the regional aerosol–climate model REMO-HAM with a solar radiation-driven OH-proxy. Atmos. Chem. Phys. 2014; 14: 11711–11729.
- Pueschel R. F. , Van Valin C. C . Cloud nucleus formation in a power plant plume. Atmos. Environ. 1978; 12: 307–312.
- Qian Y. , Gong D. , Fan J. , Leung L. R. , Bennartz R. , co-authors . Heavy pollution suppresses light rain in China: observations and modeling. J. Geophys. Res. 2009; 114: 00K02.
- Rosenfeld D . Suppression of rain and snow by urban and industrial air pollution. Science. 2000; 287: 1793–1796.
- Rosenfeld D. , Andreae M. O. , Asmi A. , Chin M. , de Leeuw G. , co-authors . Global observations of aerosol-cloud-precipitation-climate interactions. Rev. Geophys. 2014a; 52: 750–808.
- Rosenfeld D. , Lensky I. M. , Peterson J. , Gingis A . Potential impacts of air pollution aerosols on precipitation in Australia. Clean Air Environ. Qual. 2006; 40: 43–49.
- Rosenfeld D. , Lohmann U. , Raga G. B. , O'Dowd C. D. , Kulmala M. , co-authors . Flood or drought: how do aerosols affect precipitation?. Science. 2008; 321: 1309–1313.
- Rosenfeld D. , Sherwood S. , Wood R. , Donner L . Climate effects of aerosol-cloud-interactions. Science. 2014b; 343: 379–380.
- Spracklen D. V. , Carslaw K. S. , Kulmala M. , Kerminen V. M. , Sihto S. L. , co-authors . Contribution of particle formation to global cloud condensation nuclei concentrations. Geophys. Res. Lett. 2008; 35: L06808.
- Spracklen D. V. , Carslaw K. S. , Pöschl U. , Rap A. , Forster P. M . Global cloud condensation nuclei influenced by carbonaceous combustion aerosol. Atmos. Chem. Phys. 2011; 11: 9067–9087.
- Srivastava R. K. , Miller C. A. , Erickson C. , Jambhekar R . Emissions of sulfur trioxide from coal-fired power plants. J. Air Waste Manage. Assoc. 2004; 54: 750–762.
- Stevens R. G. , Pierce J. R . A parameterization of sub-grid particle formation in sulfur-rich plumes for global- and regional-scale models. Atmos. Chem. Phys. 2013; 13: 12117–12133.
- Suni T. , Kulmala M. , Hirsikko A. , Bergman T. , Laakso L. , co-authors . Formation and characteristics of ions and charged aerosol particles in a native Australian Eucalypt forest. Atmos. Chem. Phys. 2008; 8: 129–139.
- Teller A. , Levin Z . The effects of aerosols on precipitation and dimensions of subtropical clouds: a sensitivity study using a numerical cloud model. Atmos. Chem. Phys. 2006; 6: 67–80.
- Twomey S . On the nature and origin of natural cloud nuclei. Bull. Obs. Puy de Dome. 1960 1 1–20.
- Twomey S . Pollution and the planetary albedo. Atmos. Environ. 1974; 8: 1251–1256.
- Twomey S . On the minimum size of particle for nucleation in clouds. J. Atmos. Sci. 1977; 34: 1832–1835.
- Twomey S. , Warner J . Comparison of measurements of cloud droplets and cloud nuclei. J. Atmos. Sci. 1967; 24: 702–703.
- Vogel B. , Vogel H. , Bäumer D. , Bangert M. , Lundgren K. , co-authors . The comprehensive model system COSMO-ART – radiative impact of aerosol on the state of the atmosphere on the regional scale. Atmos. Chem. Phys. 2009; 9: 8661–8680.
- Wang M. , Penner J. E . Aerosol indirect forcing in a global model with particle nucleation. Atmos. Chem. Phys. 2009; 9: 239–260.
- Warner J . A reduction in rainfall associated with smoke from sugar-cane fires – an inadvertent weather modification. J. Appl. Meteorol. 1968; 7: 247–251.
- Westervelt D. M. , Pierce J. R. , Riipinen I. , Trivitayanurak W. , Hamed A. , co-authors . Formation and growth of nucleated particles into cloud condensation nuclei: model–measurement comparison. Atmos. Chem. Phys. 2013; 13: 7645–7663.
- Whitby K. T. , Cantrell B. K. , Kittelson D. B . Nuclei formation rate in a coal fire power plant plume. Atmos Environ. 1978; 12: 313–321.
- Wiedensohler A. , Birmili W. , Nowak A. , Sonntag A. , Weinhold K. , co-authors . Mobility particle size spectrometers: harmonization of technical standards and data structure to facilitate high quality long-term observations of atmospheric particle number size distributions. Atmos. Meas. Tech. 2012; 5: 657–685.
- Zaveri R. A. , Berkowitz C. M. , Brechtel F. J. , Gilles M. K. , Hubbe J. M. , co-authors . Nighttime chemical evolution of aerosol and trace gases in a power plant plume: Implications for secondary organic nitrate and organosulfate aerosol formation, NO3 radical chemistry, and N2O5 heterogeneous hydrolysis. J. Geophys. Res. 2010; 115: 12304.
- Zhao Z. , Pritchard M. S. , Russell L . Effects on precipitation, clouds, and temperature from long-range transport of idealized aerosol plumes in WRF-Chem simulations. J. Geophys. Res. 2012; 117: 05206.
- Zhang R. , Khalizov A. , Wang L. , Hu M. , Xu W . Nucleation and growth of nanoparticles in the atmosphere. Chem. Rev. 2012; 112: 1957–2011.