
Abstract
A 12-month investigation of total mercury (Hg) in event-based precipitation was performed in China's biggest industrial base, Yangtze River Delta, a hotspot of anthropogenic Hg emissions. Concentrations of total Hg in precipitation were measured, and the spatial and temporal variations of Hg were addressed. The results show that Hg concentrations (median=92 ng L−1) are comparable to the reports of other cities in China, but higher than those of remote sites. In spatial, Hg levels are significantly higher in urban and suburban precipitation than in rural samples. The pH, precipitation depth and antecedent drying period appear to be potential factors influencing Hg concentrations in precipitation, but in general no strong correlation was found between Hg and individual parameters. A seasonal variation of Hg in precipitation was found, and the concentrations in winter are generally higher, possibly associated with fossil fuel combustion. In addition, the dominant wind direction was found to be a factor influencing seasonal pattern of Hg by atmospheric transport of air pollutants. The backward trajectories suggest that local sources, for example, emissions from coal combustion and industry activities, are possibly important contributors to Hg in precipitation.
1. Introduction
Mercury (Hg) is a highly toxic element in the environment. A number of investigations have suggested that Hg is a potential threat to the health of people and wildlife in different environmental compartments even at trace levels (Janssens et al., Citation2003; Dabeka et al., Citation2004; Zahir et al., Citation2005). It is reported that a low dose of Hg can affect the nervous system, rental system, reproduction, immune system, cardiovascular system, motor activity, genome and molecular mechanisms (Zahir et al., Citation2005 and references therein). Minamata, one of the top 10 environmental disasters of the 20th century, which occurred in Japan through the 1950s and 1960s, is associated with the consumption of Hg-contaminated seafood. Over the past few decades, Hg contamination episodes have also been reported in other regions, such as the US and China (Renner, Citation2004; Jiang et al., Citation2006). Thus, there is great concern over Hg accumulation, for its characteristics of toxicity, persistence and bioaccumulation.
Hg in the environment is from both natural emissions and anthropogenic activities. Natural sources mainly include geothermal springs, fires, volcanoes, geologic deposits and ocean evasion (Fulkerson, Citation2006; Pirrone et al., Citation2010). However, accumulation of Hg in the environment is believed to be associated with human activities, especially in the urban and industrialised areas. Over the past century, Hg deposition rates have increased by a factor of 1.5–3 due to human emissions from industry, agriculture, domestic sources, etc. (United Nations Environment Programme, Citation2002), and anthropogenic Hg emitted to the atmosphere was estimated to be 3.4×10⁹ g a−1 around 2008(Selin et al., Citation2008). The intensive anthropogenic emissions and volatilisation of Hg have caused environmental Hg pollution on a global scale, even in the remote polar regions (Fitzgerald et al., Citation1998; Macdonald et al., Citation2000; Riget et al., Citation2000; Shi et al., Citation2015).
In the atmosphere, Hg exists in three primary forms, that is, elemental gaseous Hg (Hg0), divalent gaseous Hg [Hg(II)] and divalent particulate Hg (pHg). Occasionally, trace levels of methylmercury (MeHg) are also present. The Hg0, generally unreactive, is the most common form in anthropogenic and natural emissions to the atmosphere, and the residence time of Hg0 is estimated to be around 1 yr (Schroeder and Munthe, Citation1998). In the atmosphere, Hg0 is rather insoluble, and thus not scavenged by rainfall (Sommar et al., Citation2001). However, under certain conditions, Hg0 can be oxidised to Hg(II), which is scavenged by the precipitation effectively because of its properties of high solubility (Lee et al., Citation2001). In the regional and local Hg cycles, atmospheric deposition is considered to be the primary mechanism by which Hg enters both terrestrial and water ecosystems (Landis et al., Citation2002). Atmospheric deposition of Hg is a combination of both dry and wet processes (Lindberg and Stratton, Citation1998), and the wet and dry deposition contributes proportionally to the total atmospheric Hg deposition (Zhang et al., Citation2012). Wet deposition is thought to play a more important role in the regions with higher precipitation rates (Sakata and Marumoto, Citation2005). After entering the terrestrial ecosystems, Hg can be transformed to the more toxic form, MeHg, via biotransformation by microorganisms (Schroeder and Munthe, Citation1998; Colombo et al., Citation2013). Thus, it is of great significance to investigate the spatial and temporal variability of atmospheric Hg deposition, for a better understanding of Hg cycles in the environment.
China is regarded as the world's largest atmospheric Hg emission source and contributes about 28% of the global emissions of Hg (Pacyna et al., Citation2006). In the anthropogenic Hg emission inventory of China, about 45% of the Hg originates from the non-ferrous metal smelting and 38% from coal combustion (Streets et al., Citation2005). Yangtze River Delta (YRD) industrial base, the most industrialised region of China, accounting for 20% of China's gross domestic product, is regarded as the Hg emission hotspot in China (Pan et al., Citation2008). In previous investigations, Hg accumulation in dry atmospheric deposition in YRD has been characterised in detail (Huang et al., Citation2009; Shi et al., Citation2012). However, Hg concentrations and its spatio-temporal variability in precipitation remain understudied. Therefore, we carried out an event-based rainfall collection over 12 months focusing on the total Hg concentrations and its variability in the YRD.
2. Materials and methods
2.1. Sample collection
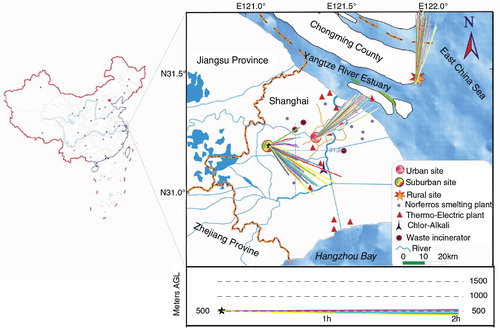
Three sampling sites were set up in the YRD, that is, urban, suburban and rural stations. The urban station is in downtown Shanghai, and the suburban station is located in the western part of Shanghai, where both industrial park and farmland are distributed. The rural station is located at the eastern Chongming Island in the Yangtze River estuary, and agricultural activities are dominant in Chongming. Three sampling sites are all more than 0.5 km away from the main roads, industrial areas and significant emission sources (e.g. smoke stack).
The sampling campaigns were carried out on the building rooftop. Precipitation was collected with a high-density PE rain gauge with a 500 cm2 aperture, which was placed 180 cm above the rooftop. Samplers and buckets were not installed until the rainfall/snowfall started, and the precipitation sampling was carried out manually. Samples were collected as soon as the precipitation event was over, that is, on an event basis. If the period between two events was less than 4 h, the samples were mixed together as an event. The bucket may be filled up during a heavy continuous rain. In this case the bucket was emptied to continue the sampling, and the collected volumes were merged to constitute one sample at the end. Samples were discarded when a single precipitation event was not enough for analysis (typically <0.5 mm). In addition, samples that contained impurities, such as leaves and insects, were also rejected for analysis.
A 12-month sampling campaign was performed synchronously at the three sites. In total, 148 precipitation events were involved in chemical analysis, including 49, 63 and 36 samples for urban, suburban and rural sites, respectively.
In addition, about 100 ml Milli-Q water poured into the rain gauge was taken as the field blanks to examine the possible contamination during the collection process. Two field blanks were prepared at individual stations, and a total of six field blanks were obtained during the sampling campaign.
2.2. Sample analysis
Samples were weighted and an aliquot was determined for pH with a glass electrode as soon as the precipitation event was over. The samples were separated into two parts: one filtered through 0.7 µm microglass fibre filters (Waterman), which were leached with Milli-Q water and baked in a muffle furnace for 4 h at 500 °C, for measurements of organic carbon (OC); and the other unfiltered was acidified to pH=1 by concentrated HCl (Optima, Fisher Scientific) for determination of total Hg. The filtered samples were preserved in 20 ml pre-muffled glass vials, and then were kept in a refrigerator at 4°C. The acidified samples were preserved in pre-cleaned 100 ml narrow mouth polytetrafluoroethylene bottles, kept frozen at −20°C. The same treating procedures were also employed to field blanks. It is noted that all of the samples were analysed within 30 d after sampling.
The OC measurement was conducted with the aid of a Liquid TOC II analyser (Elementar Co., Hanau, Germany). The standards of OC were prepared from potassium hydrogen phthalate. The quality of the data was assured by inserting certified reference material (GSB07-1967–2005, DOC=24.4 mg L−1), supplied by the National Research Center for Certified Reference Materials in China (NRCCRM), in each run of samples. The field blanks were generally below the detection limit 60 µg L−1.
Total Hg concentrations were determined using atomic fluorescence spectrometry (AFS930, Beijing Titan Co. Ltd, Beijing, China), with the oxidiser of 0.5‰ K2Cr2O7 and reducing reagent of KBH4. The national standard GSB04-1729-2004 from the NRCCRM was used to calibrate the total Hg concentration in precipitation. Three blanks (5% HCl solution, vol/vol) and three certified reference materials (GSBZ50016-90, Lot No. 202023, with certified total Hg concentration of 5.17 µg L−1, supplied by the NRCCRM) were measured synchronously in each run of samples, to control the analysis quality. The recovery of reference materials ranged from 93 to 101%, with a mean of 95%. Furthermore, duplicated samples (n=5) were also examined throughout all analysis experiments to check the measurement accuracy, and the relative standard deviation (1σ) at different runs of samples ranged from 3 to 6% (mean=5%).
The detection limit for Hg concentration was estimated as three standard deviations of the blank (i.e. 5% HCl), which was run 10 times. The detection limit and quantification limit were estimated to be 0.3 and 0.8 ng L−1, respectively. Hg concentrations of the field blanks were generally in the range of 0.2–0.5 ng L−1, thus blank correction was not performed.
Very careful precautions were taken to ensure that all of the samples were free of potential contamination throughout the collection and analysis processes, that is, (1) personnel wore disposal polyethylene gloves; (2) samples were treated in a class 1000 clean room; (3) all of the precipitation samplers and experimental containers were washed successively using tap water, diluted HCl (20%) and Milli-Q water; and (4) the resistance of Milli-Q water used in this campaign was >18.2 MΩ. It is acknowledged that polytetrafluoroethylene samplers are necessary for Hg analysis in precipitation, while polyethylene samplers were used in this observation. Hg concentrations in field blanks were comparable to the detection limit, and these values, in general, will be negligible when compared with those of samples (in the order of tens to hundreds of ng L−1). In this case, the potential effects of polyethylene samplers on measurements of Hg in precipitation can be neglected in this study.
2.3. Meteorological data
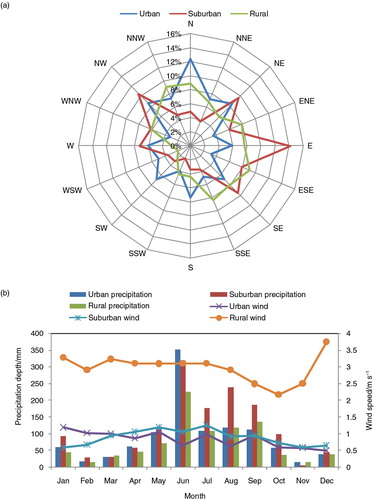
There are manned weather stations near the urban and suburban stations, while an automated weather station was set up at a rural site. Based on weather station records, meteorological data over the sampling period are statistically summarised in . During wintertime northerly winds were dominant, while easterly winds were the prevailing pattern in summer. In terms of wind speed (b), rural values are higher than those of urban and suburban sites. In general, the study region was under the influence of the East Asian monsoon, and the precipitation mainly occurred in summertime, that is, June to August (b).
Fig. 1 Summary statistics of the meteorological data at urban, suburban and rural sampling sites. The wind rose diagrams are shown in (a), and (b) illustrates monthly precipitation depth and wind speed.
2.4. Statistical method
Correlation analysis of the data in this work was carried out by means of SPSS v.11.5 software packages. The correlation between Hg concentrations and other factors was present in the form of non-parametric Pearson correlation coefficients.
The calculation of backward air mass trajectories was performed with the aid of the Hybrid Single Particle Lagrangian Integrated Trajectory (HYSPLIT) model, developed at the Air Resources Laboratory of NOAA (Draxler and Rolph, Citation2013). Trajectory maps were generated using the GDAS database for a 72 h (or 2 h) hind-cast starting at 500 m above ground level.
3. Results
3.1. Hg concentrations in precipitation
Hg concentrations at the three stations are statistically summarised in . The medians (means) of Hg at urban, suburban and rural stations are 113 (257), 122 (190) and 62 (114) ng L−1, respectively. It is noted that there is a difference between medians and means of Hg, possibly due to the great variability of Hg in precipitation [i.e. Cv, one standard deviation versus mean is 1.3 (urban), 1.0 (suburban) and 1.1 (rural)]. A significant variability of Hg in precipitation was also reported in previous observations (Zhang et al., Citation2012; Huang et al., Citation2013).
Fig. 2 Summary statistics of Hg concentrations in precipitation collected at urban, suburban and rural sites.
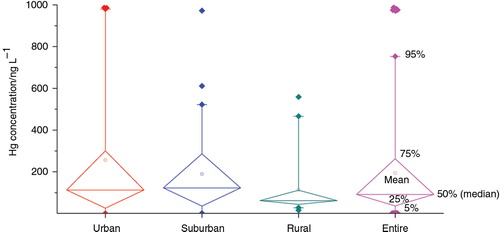
In terms of spatial pattern, both medians and means of Hg are higher at urban and suburban sites than at rural station (), and independent-sample t test shows that Hg levels are significantly higher in urban and rural precipitation than in rural samples (p<0.05). This spatial trend is generally consistent with the reports of other regions (Wang et al., Citation2012; Gichuki and Mason, Citation2013).
Hg concentrations in precipitation in different regions are listed in . In general, Hg concentrations in this study are comparable to the values of other cities in China. It is notable that Hg levels in precipitation are generally higher in the cities of China than in other regions, possibly related to anthropogenic emissions (e.g. fossil fuel combustion; Jiang et al., Citation2006; Zhang et al., Citation2015). Specifically, total coal consumption in 2013 in China was 1925 million tonnes oil equivalent, accounting for about half of the world coal consumption (3827 million tonnes oil equivalent; BP Statistical Review of World Energy; www.bp.com/content/dam/bp/pdf/Energy-economics/statistical-review-2014). In terms of spatial variation, precipitation Hg levels are generally higher at urban sites than in rural and remote areas, such as mountains (e.g. Nam Co and Lhasa in China) and open oceans (e.g. Pacific Ocean, Indian Ocean and Bermuda). This spatial pattern is likely indicative of the variability in intensity of anthropogenic emissions (Pan et al., Citation2008; Pirrone et al., Citation2010). It is notable that very high Hg values (>500 ng L−1) were occasionally reported, and an extremely high Hg level up to 3400 ng L−1 was found in the rain in Minnesota (Glass et al., Citation1986), much higher than the maximum values in this study.
Table 1. Comparison of total Hg concentrations in precipitation in different regions/ng L−1
3.2. Hg pollution assessment in precipitation
Hg reaches the surface water primarily via atmospheric deposition and it is estimated that wet deposition accounts for 50–90% of the Hg load to most inland water bodies (Mason et al., Citation1997; Landis and Keeler, Citation2002; Prestbo and Gay, Citation2009). Thus, Hg pollution in precipitation poses a threat to the surface water potentially.
Pollution levels of Hg in precipitation can be assessed by comparing the quality standards for surface water in China [National Standard GB 3838-2002, five grades classified (I, II, III, IV and V) with lower grades corresponding to higher water quality requirements]. In general, about one-third of Hg values is lower than 50 ng L−1, corresponding to grade I (mainly for source water and nature protection areas). It is noted that more than half of Hg concentrations in urban (53%) and suburban (54%) samples fall in the range of 100–1000 ng L−1 (grade V, mainly for farmland water areas and water areas for general landscape requirement). In this case, urban and suburban precipitation could be a potential contribution to surface water Hg, considering that drinking water mainly comes from surface water in YRD, and measures must be taken to mitigate Hg pollution in the atmosphere for protecting the source water in the study region.
4. Discussions
4.1. The pH and its relationship to Hg concentrations in precipitation
The pH ranges in urban, suburban and rural precipitation are 3.0–7.3, 3.0–6.8 and 2.6–6.9, respectively, with the respective means of 5.0, 5.0 and 4.9. In total, 74% of the pH values are lower than 5.6, a typical value of rainwater in equilibrium with atmospheric CO2 (Charlson and Rodhe, Citation1982); while more than half of pH values are less than 5.0, a typical value of acid rain. The low pH values (i.e. the acid rain) are likely associated with large amounts of NOx and SOx emissions in the study region (Teng et al., Citation2010).
The pH is thought to be a factor influencing Hg concentrations in precipitation, possibly due to co-emissions of Hg and acid gases (e.g. NOx and SOx) and/or the transformations of atmospheric Hg (Sheu and Lin, Citation2011). In this study, a positive correlation was found between Hg levels and pH at urban (r=0.42, p=0.01) and rural (r=0.35, p=0.04) sites, but none for suburban samples (r=−0.05, p=0.7). It is interesting that no relationship was observed between Hg levels and pH (2.9–7.3, close to our data) in precipitation in Chongqing (an inland city in China), where atmospheric Hg was mainly attributed to coal combustion emissions (Wang et al., Citation2012).
The oxidation of Hg0 in both gaseous and aqueous phase contributes a considerable fraction of Hg in rainwater (Lin and Pehkonen, Citation1998), and increased Hg0 oxidation reactions have been observed in the presence of high particle concentrations in the atmosphere (Kim et al., Citation2012 and references therein). The pH of rainwater is closely related to the alkaline constituents (e.g. Ca) in particulate matter (Shukla and Sharma, Citation2010). In this case, a relationship of pH versus Hg levels would be expected given that particulate matter levels affect pH. On the other hand, the pH is thought to be a critical parameter for the chemical speciation of Hg(II), with higher pH favouring reduction of Hg(II) (Lin and Pehkonen, Citation1998), and this mechanism has been used to explain the low Hg levels at pH>4 in cloud water (Sheu and Lin, Citation2011). In this observation, the elevated Hg levels corresponding to high pH is likely explained by the former mechanism. However, the data of Ca2+ are unavailable in this study, limiting further testing of this speculation. It is noted that changes in one or more variables (e.g. pH and Hg source, discussed in the following) do not always result in a clear relationship between Hg concentrations and pH. Thus, the correlation between Hg and pH in this study possibly suggests that Hg levels in precipitation are not controlled by a single atmospheric chemistry [e.g. oxidation of Hg0 or reduction of Hg(II)], and the emission sources could play an important role.
4.2. Precipitation dilution effects on Hg concentrations
Previous reports suggested a dilution effect of precipitation on Hg levels, but this relationship is unstable (Prestbo and Gay, Citation2009; Wang et al., Citation2012; Sheu and Lin, Citation2013). A negative relationship between Hg and precipitation depth is thought to be the contribution of scavenging of atmospheric Hg [mainly reactive gaseous Hg (RGM) and pHg] to rainwater during the early stages of a precipitation event (Selin and Jacob, Citation2008). It is noted that the diluting effects were found to be rather minor at some sites. For instance, in Illinois, precipitation depth accounted for 5–12% of the variability in Hg concentration (Gratz et al., Citation2013), and this value was close to that of Steubenville, OH (7%; White et al., Citation2009).
In this observation, no significant relationship was found between precipitation amount and Hg levels at urban (r=−0.14, p=0.4), suburban (r=0.16, p=0.2) and rural (r=−0.36, p=0.06) sites, possibly suggesting that dilution effects are negligible. In addition, it is proposed that 5 mm may be a threshold value for the largest wash-out capability to Hg (i.e. diluting effects may be noticeable when the rainfall amount >5 mm) (Wang et al., Citation2012), but no correlation was found between rainfall amount and Hg levels in our samples even when the events <5 mm removed.
Hg concentrations in precipitation are influenced by a variety of factors, including the sources and atmospheric chemistry of Hg, so it is possible that the diluting effects have been obscured by other factors. Still, our data do not support a significant influence of precipitation depth on Hg levels.
4.3. Effects of antecedent dry period on Hg concentrations
In addition to the factors discussed above (i.e. the pH and precipitation depth), the length of dry period prior to precipitation event may be another factor influencing Hg concentrations given that pollutants emitted locally could build up in the boundary layer (Fulkerson, Citation2006). However, the relationship between the antecedent dry days and Hg levels in precipitation has not been reported extensively. Here, no significant correlation was found between the two parameters, with r-values of 0.16 (p=0.27; urban), 0.30 (p=0.02; suburban) and 0.12 (p=0.5; rural), possibly suggesting that dry period preceding the precipitation is less influential.
Hg in precipitation is mainly from the scavenging of RGM and pHg in the atmosphere. Although the length of dry period can affect the levels of atmospheric fine particles, the effective scavenging coefficient during rain event depends on a variety of factors (Andronache et al., Citation2006). In this case, a clear relationship between the length of dry period and Hg levels would not be expected. Based on our data, it is hard to attribute the variation of Hg to the length of non-raining period, although the impacts of this factor cannot be ruled out.
4.4. Seasonal pattern and the possible sources of Hg
Hg concentrations in different seasons are shown in . Results obtained during 12 months were grouped by season, March–May for spring, June–August for summer, September–November for fall and December–February for winter. Seasonal patterns of Hg concentrations in urban and rural samples are similar, with an increasing order of spring<summer<fall<winter; while suburban samples show a different trend, with elevated concentrations in summer and fall. A number of investigations pointed out that atmospheric Hg levels in winter were relatively high (Fang et al., Citation2004; Huang et al., Citation2010; Wang et al., Citation2012). However, reports from North America showed that Hg concentrations in precipitation were high in summer months (Hall et al., Citation2005; Choi et al., Citation2008), similar to the suburban pattern of this study.
Fig. 3 Seasonal variation of Hg and organic carbon (OC) in precipitation at urban, suburban and rural sampling sites. The four closed circles are OC concentrations in spring, summer, fall and winter. Error bars denote one standard deviation (1σ).
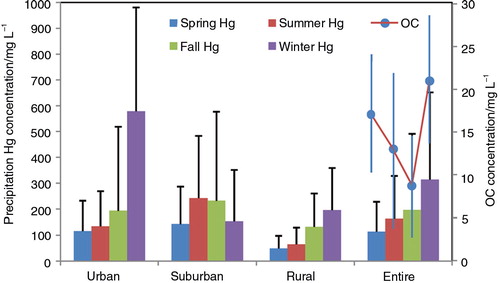
The seasonal variability of Hg may be closely related to the main sources of atmospheric Hg. In specific, the biofuel and coal combustion for space heating is common in wintertime in YRD; as a result, a large amount of Hg is emitted to the atmosphere (Chio et al., Citation2004; Obrist et al., Citation2007). In this observation, a correlation was found between Hg and OC in precipitation (r=0.24, p<0.01), and high OC concentration is observed in winter (). In Eastern Asia, atmospheric OC was thought to be mainly associated with fossil fuel combustion (Yan and Kim, Citation2012). In combination with the fact that coal-fired power generation is the main method of energy supply in Shanghai, where more than 10 electric power plants are distributed (), it is reasonable to attribute the higher Hg levels in winter to fossil fuel combustion. This is consistent with previous reports that coal combustion is a main contributor to Hg in rainwater (Keeler et al., Citation2006; Landing et al., Citation2010; Wang et al., Citation2012).
Fig. 4 The 2 h backward trajectories of precipitation events with high Hg levels at the three sampling sites, that is, 986, 973 and 559 ng L−1 for urban, suburban and rural precipitation, respectively. The end-point elevation of the trajectories is 500 m above ground level (AGL). The vertical velocity model was selected for the calculation of vertical motion.
In addition, the YRD is dominated by Asian monsoon, favouring east–south oceanic air mass in summer and west–north airflow in winter (). In this case, the shift of dominant winds can also be a factor influencing seasonal patterns of Hg by transporting atmospheric pollutants. The air masses associated with the change of wind directions can be identified with the HYSPLIT model, and the backward trajectories of precipitation events with high and low Hg concentrations are shown in . Higher Hg levels were found to be linked to the air masses transported from inland China (a–c), where pollution-intensive industries may be an important contribution to atmospheric Hg (Pan et al., Citation2008). On the contrary, lower Hg concentrations are associated with easterly oceanic air (d–f). It is interesting that a relationship was found between monthly Hg levels and wind directions (in degree) (r=0.47, p<0.01), possibly supporting the impacts of dominant winds on atmospheric Hg levels in the study region. Similarly, atmospheric total gaseous Hg levels in Shanghai were found to be closely related to the predominant wind direction (Friedli et al., Citation2011; Dou et al., Citation2013).
Fig. 5 The 72 h backward trajectories of precipitation events with higher and lower Hg levels at the three sampling sites. (a), (b) and (c) present the higher Hg concentration events at urban (987 ng L−1), suburban (610 ng L−1) and rural (559 ng L−1) sites, respectively; while figures (d), (e) and (f) are for the events with low Hg levels at urban (1 ng L−1), suburban (2 ng L−1) and rural sites (2 ng L−1), respectively. The method is the same as that of .
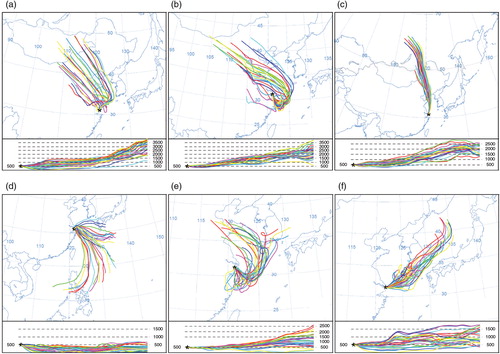
The oceanic Hg evasion is thought to be an important natural source of atmospheric Hg (representing more than half of total natural sources; Mason, Citation2009; Pirrone et al., Citation2010); thus, this source should be considered given that the sampling sites are located in coastal region. In general, a high temperature favours oceanic Hg evasion (Braune et al., Citation2015), mainly in the form of Hg0 (Strode et al., Citation2007). However, low Hg levels were usually found in summer precipitation, which is mainly associated with oceanic air masses ( and 5d–f). In this case, the oceanic emission does not appear to be a factor controlling Hg in precipitation.
To explore the possible local sources of atmospheric Hg, the 2 h backward trajectories of three rainfall events with elevated Hg concentrations are shown in . As for the urban event, the emissions from coal-fired power plants and metal smelting plants were found to be the potential contribution; while incineration of waste, chlor-alkali production and metal production are possibly contributors to Hg in suburban sample. It is noted that Shanghai Chlor-Alkali Chemical Co., Limited (), one of the biggest chlor-alkali producing companies in China, is likely an important source of atmospheric Hg (Jiang et al., Citation2006). Different from urban and suburban events, it seems like that local sources contribute less to Hg in rural precipitation (), and the long-range transport of air pollutants may contribute to the elevated Hg levels (c).
5. Conclusions
We carried out a year-round investigation of Hg in precipitation in the YRD, the largest industrial base in China. Results show that Hg concentrations are in the range of 1–987 ng L−1, with a median of 92 ng L−1. A spatial gradient of Hg concentration was observed, with elevated values in urban and suburban precipitation and lower concentrations in rural samples. In general, precipitation Hg levels of this study are comparable to the values of other cities in China, but higher than the levels of remote regions (e.g. open oceans).
A correlation between pH and Hg concentrations in precipitation was found, but the variability of Hg is not likely to be controlled by pH. It is found that precipitation dilution effects on Hg concentrations are rather minor, while the impacts of antecedent drying period on Hg levels are generally negligible. An obvious seasonal pattern of precipitation Hg was found, with high values in winter and lower levels in spring for urban and rural samples. Wind direction is likely a factor influencing seasonal pattern of Hg, that is, air masses from inland China transport more pollutants while easterly oceanic air is relatively clean. In addition, the local emissions from coal combustion, metal production, possibly waste incineration and chlor-alkali production are important contributors to Hg in precipitation.
Overall, Hg in precipitation is largely dependent on source strengths and atmospheric processes, and changes in one or more environmental factors do not always result in a clear relationship between Hg concentrations and individual parameters. More studies are needed to clarify the mechanisms of individual parameters determining Hg levels in precipitation.
Acknowledgements
The authors thank Shanghai Meteorological Data Center for providing meteorological data of the sampling stations. The authors also thank Prof. Annica Ekman and three anonymous reviewers for their help in the development and improvement of this article. This project was supported by the National Science Foundation of China (Grant No. 41206188) and Shanghai Municipal Natural Science Foundation (Grant No. 11ZR1441100).
References
- Ahn M.-C. , Yi S.-M. , Holsen T. M. , Han Y.-J . Mercury wet deposition in rural Korea: concentrations and fluxes. J. Environ. Monit. 2011; 13: 2748–2754.
- Andronache C. , Grönholm T. , Laakso L. , Phillips V. , Venäläinen A . Scavenging of ultrafine particles by rainfall at a boreal site: observations and model estimations. Atmos. Chem. Phys. 2006; 6: 4739–4754.
- Braune B. , Chételat J. , Amyot M. , Brown T. , Claydon M. , co-authors . Mercury in the marine environment of the Canadian Arctic: review of recent findings. Sci. Total. Environ. 2015; 509–510: 67–90.
- Charlson R. , Rodhe H . Factors controlling the acidity of natural rainwater. Nature. 1982; 295: 683–685.
- Chio C.-P. , Cheng M.-T. , Wang C.-F . Source apportionment to PM10 in different air quality conditions for Taichung urban and coastal areas, Taiwan. Atmos. Environ. 2004; 38: 6893–6905.
- Choi H.-D. , Sharac T. J. , Holsen T. M . Mercury deposition in the Adirondacks: a comparison between precipitation and throughfall. Atmos. Environ. 2008; 42: 1818–1827.
- Colombo M. J. , Ha J. , Reinfelder J. R. , Barkay T. , Yee N . Anaerobic oxidation of Hg(0) and methylmercury formation by Desulfovibrio desulfuricans ND132. Geochim. Cosmochim. Acta. 2013; 112: 166–177.
- Connan O. , Maro D. , Héberta D. , Roupsard P. , Goujon R. , co-authors . Wet and dry deposition of particles associated metals (Cd, Pb, Zn, Ni, Hg) in a rural wetland site, Marais Vernier, France. Atmos. Environ. 2013; 67: 394–403.
- Dabeka R. , McKenzie A. , Forsyth D. , Conacher H . Survey of total mercury in some edible fish and shellfish species collected in Canada in 2002. Food Addit. Contam. 2004; 21: 434–440.
- Dou H. , Wang S. , Wang L. , Zhang L. , Hao J . Characteristics of total gaseous mercury concentrations at a rural site of Yangtze Delta, China. Environ. Sci. 2013; 34: 1–7.
- Draxler R. R. , Rolph G. D . HYSPLIT (HYbrid Single-Particle Lagrangian Integrated Trajectory) Model. 2013; College Park, MD: NOAA Air Resources Laboratory.
- Dutt U. , Nelson P. F. , Morrison A. L. , Strezov V . Mercury wet deposition and coal-fired power station contributions: an Australian study. Fuel Process. Technol. 2009; 90: 1354–1359.
- Ebinghaus R. , Jennings S. , Schroeder W. , Berg T. , Donaghy T. , co-authors . International field intercomparison measurements of atmospheric mercury species at Mace Head, Ireland. Atmos. Environ. 1999; 33: 3063–3073.
- European Commission. Ambient Air Pollution by Mercury (Hg) Position Paper. 2001; Luxembourg: Office for Official Publications of the European Communities.
- Fang F. , Wang Q. , Li J . Urban environmental mercury in Changchun, a metropolitan city in Northeastern China: source, cycle, and fate. Sci. Total. Environ. 2004; 330: 159–170.
- Fitzgerald W. F. , Engstrom D. R. , Mason R. P. , Nater E. A . The case for atmospheric mercury contamination in remote areas. Environ. Sci. Technol. 1998; 32: 1–7.
- Fostier A.-H. , Forti M. , Guimarães J. , Melfi A. , Boulet R. , co-authors . Mercury fluxes in a natural forested Amazonian catchment (Serra do Navio, Amapá State, Brazil). Sci. Total. Environ. 2000; 260: 201–211.
- Friedli H. , Arellano A. Jr. , Geng F. , Cai C. , Pan L . Measurements of atmospheric mercury in Shanghai during September 2009. Atmos. Chem. Phys. 2011; 11: 3781–3788.
- Fulkerson M . Atmospheric Mercury Deposition in an Urban Environment.
- Ghadaksaz zadeh M. , Sekhavatjou M. S. , Hosseini Alhashemi A. , Taghinia Hejabi A . Transferring of Hg concentration from ambient air to rain water and surface soil in an industrial urban area. Int. J. Environ. Res. 2014; 8: 479–482.
- Gichuki S. W. , Mason R. P . Mercury and metals in South African precipitation. Atmos. Environ. 2013; 79: 286–298.
- Gichuki S. W. , Mason R. P . Wet and dry deposition of mercury in Bermuda. Atmos. Environ. 2014; 87: 249–257.
- Glass G. E. , Leonard E. N. , Chan W. H. , Orr D. B . Airborne mercury in precipitation in the Lake Superior region. J. Great Lakes. Res. 1986; 12: 37–51.
- Gratz L. E. , Keeler G. J. , Miller E. K . Long-term relationships between mercury wet deposition and meteorology. Atmos. Environ. 2009; 43: 6218–6229.
- Gratz L. E. , Keeler G. J. , Morishita M. , Barres J. A. , Dvonch J. T . Assessing the emission sources of atmospheric mercury in wet deposition across Illinois. Sci. Total. Environ. 2013; 448: 120–131.
- Guentzel J. L. , Landing W. M. , Gill G. A. , Pollman C. D . Processes influencing rainfall deposition of mercury in Florida. Environ. Sci. Technol. 2001; 35: 863–873.
- Guo Y. , Feng X. , Li Z. , He T. , Yan H. , co-authors . Distribution and wet deposition fluxes of total and methyl mercury in Wujiang River Basin, Guizhou, China. Atmos. Environ. 2008; 42: 7096–7103.
- Hall B. , Manolopoulos H. , Hurley J. , Schauer J. , St Louis V. , co-authors . Methyl and total mercury in precipitation in the Great Lakes region. Atmos. Environ. 2005; 39: 7557–7569.
- Huang J. , Choi H.-D. , Hopke P. K. , Holsen T. M . Ambient mercury sources in Rochester, NY: results from principle components analysis (PCA) of mercury monitoring network data. Environ. Sci. Technol. 2010; 44: 8441–8445.
- Huang J. , Kang S. , Wang S. , Wang L. , Zhang Q. , co-authors . Wet deposition of mercury at Lhasa, the capital city of Tibet. Sci. Total. Environ. 2013; 447: 123–132.
- Huang J. , Kang S. , Zhang Q. , Yan H. , Guo J. , co-authors . Wet deposition of mercury at a remote site in the Tibetan Plateau: concentrations, speciation, and fluxes. Atmos. Environ. 2012; 62: 540–550.
- Huang S. , Tu J. , Liu H. , Hua M. , Liao Q. , co-authors . Multivariate analysis of trace element concentrations in atmospheric deposition in the Yangtze River Delta, East China. Atmos. Environ. 2009; 43: 5781–5790.
- Janssens E. , Dauwe T. , Pinxten R. , Bervoets L. , Blust R. , co-authors . Effects of heavy metal exposure on the condition and health of nestlings of the great tit (Parus major), a small songbird species. Environ. Pollut. 2003; 126: 267–274.
- Jiang G. , Shi J. , Feng X . Mercury pollution in China. Environ. Sci. Technol. 2006; 40: 3672–3678.
- Keeler G. J. , Landis M. S. , Norris G. A. , Christianson E. M. , Dvonch J. T . Sources of mercury wet deposition in eastern Ohio, USA. Environ. Sci. Technol. 2006; 40: 5874–5881.
- Kim P.-R. , Han Y.-J. , Holsen T. M. , Yi S.-M . Atmospheric particulate mercury: concentrations and size distributions. Atmos. Environ. 2012; 61: 94–102.
- Kocman D. , Vreca P. , Fajon V. , Horvat M . Atmospheric distribution and deposition of mercury in the Idrija Hg mine region, Slovenia. Environ. Res. 2011; 111: 1–9.
- Lai S.-O. , Holsen T. M. , Hopke P. K. , Liu P . Wet deposition of mercury at a New York state rural site: concentrations, fluxes, and source areas. Atmos. Environ. 2007; 41: 4337–4348.
- Landing W. , Caffrey J. , Nolek S. , Gosnell K. , Parker W . Atmospheric wet deposition of mercury and other trace elements in Pensacola, Florida. Atmos. Chem. Phys. 2010; 10: 4867–4877.
- Landis M. S. , Keeler G. J . Atmospheric mercury deposition to Lake Michigan during the Lake Michigan mass balance study. Environ. Sci. Technol. 2002; 36: 4518–4524.
- Landis M. S. , Vette A. F. , Keeler G. J . Atmospheric mercury in the Lake Michigan basin: influence of the Chicago/Gary urban area. Environ. Sci. Technol. 2002; 36: 4508–4517.
- Laurier F. J. , Mason R. P. , Whalin L. , Kato S . Reactive gaseous mercury formation in the North Pacific Ocean's marine boundary layer: a potential role of halogen chemistry. J. Geophys. Res. 2003; 108
- Lee D. S. , Nemitz E. , Fowler D. , Kingdon R . Modelling atmospheric mercury transport and deposition across Europe and the UK. Atmos. Environ. 2001; 35: 5455–5466.
- Lin C.-J. , Pehkonen S. O . Two-phase model of mercury chemistry in the atmosphere. Atmos. Environ. 1998; 32: 2543–2558.
- Lindberg S. A. , Stratton W . Atmospheric mercury speciation: concentrations and behavior of reactive gaseous mercury in ambient air. Environ. Sci. Technol. 1998; 32: 49–57.
- Liu J. , Wang W. , Peng A . The source of mercury in rainfall in Beijing. Environ. Sci. 2000; 2: 77–80.
- Lombard M. , Bryce J. , Mao H. , Talbot R . Mercury deposition in southern New Hampshire, 2006–2009. Atmos. Chem. Phys. 2011; 11: 7657–7668.
- Macdonald R. , Barrie L. , Bidleman T. , Diamond M. , Gregor D. , co-authors . Contaminants in the Canadian Arctic: 5 years of progress in understanding sources, occurrence and pathways. Sci. Total. Environ. 2000; 254: 93–234.
- Mason R. , Fitzgerald W. , Vandal G . The sources and composition of mercury in Pacific Ocean rain. J. Atmos. Chem. 1992; 14: 489–500.
- Mason R. P . Mason R. , Pirrone N . Mercury emissions from natural processes and their importance in the global mercury cycle. Mercury Fate and Transport in the Global Atmosphere. 2009; New York: Springer. 173–191.
- Mason R. P. , Lawson N. M. , Sullivan K. A . Atmospheric deposition to the Chesapeake Bay watershed-regional and local sources. Atmos. Environ. 1997; 31: 3531–3540.
- Munthe J. , Hultberg H. , Iverfeldt Å . Mechanisms of deposition of methylmercury and mercury to coniferous forests. Water Air. Soil Pollut. 1995; 80: 363–371.
- Nguyen H. , Leermakers M. , Kurunczi S. , Bozo L. , Baeyens W . Mercury distribution and speciation in Lake Balaton, Hungary. Sci. Total. Environ. 2005; 340: 231–246.
- Obrist D. , Moosmüller H. , Schürmann R. , Chen L.-W. A. , Kreidenweis S. M . Particulate-phase and gaseous elemental mercury emissions during biomass combustion: controlling factors and correlation with particulate matter emissions. Environ. Sci. Technol. 2007; 42: 721–727.
- Pacyna E. G. , Pacyna J. M. , Steenhuisen F. , Wilson S . Global anthropogenic mercury emission inventory for 2000. Atmos. Environ. 2006; 40: 4048–4063.
- Pan L. , Carmichael G. R. , Adhikary B. , Tang Y. , Streets D. , co-authors . A regional analysis of the fate and transport of mercury in East Asia and an assessment of major uncertainties. Atmos. Environ. 2008; 42: 1144–1159.
- Pirrone N. , Cinnirella S. , Feng X. , Finkelman R. , Friedli H. , co-authors . Global mercury emissions to the atmosphere from anthropogenic and natural sources. Atmos. Chem. Phys. 2010; 10: 5951–5964.
- Prestbo E. M. , Gay D. A . Wet deposition of mercury in the US and Canada, 1996–2005: results and analysis of the NADP mercury deposition network (MDN). Atmos. Environ. 2009; 43: 4223–4233.
- Renner R . Mercury woes appear to grow. Environ. Sci. Technol. 2004; 38: 144A.
- Riget F. , Asmund G. , Aastrup P . The use of lichen (Cetraria nivalis) and moss (Rhacomitrium lanuginosum) as monitors for atmospheric deposition in Greenland. Sci. Total. Environ. 2000; 245: 137–148.
- Sakata M. , Marumoto K . Wet and dry deposition fluxes of mercury in Japan. Atmos. Environ. 2005; 39: 3139–3146.
- Sanei H. , Outridge P. , Goodarzi F. , Wang F. , Armstrong D. , co-authors . Wet deposition mercury fluxes in the Canadian sub-Arctic and southern Alberta, measured using an automated precipitation collector adapted to cold regions. Atmos. Environ. 2010; 44: 1672–1681.
- Schroeder W. H. , Munthe J . Atmospheric mercury- an overview. Atmos. Environ. 1998; 32: 809–822.
- Selin N. E. , Jacob D. J . Seasonal and spatial patterns of mercury wet deposition in the United States: constraints on the contribution from North American anthropogenic sources. Atmos. Environ. 2008; 42: 5193–5204.
- Selin N. E. , Jacob D. J. , Yantosca R. M. , Strode S. , Jaegle L. , co-authors . Global 3-D land-ocean-atmosphere model for mercury: present-day versus preindustrial cycles and anthropogenic enrichment factors for deposition. Global Biogeochem. Cycles. 2008; 22
- Seo Y.-S. , Han Y.-J. , Choi H.-D. , Holsen T. M. , Yi S.-M . Characteristics of total mercury (TM) wet deposition: scavenging of atmospheric mercury species. Atmos. Environ. 2012; 49: 69–76.
- Sheu G.-R. , Lin N.-H . Mercury in cloud water collected on Mt. Bamboo in northern Taiwan during the northeast monsoon season. Atmos. Environ. 2011; 45: 4454–4462.
- Sheu G.-R. , Lin N.-H . Characterizations of wet mercury deposition to a remote islet (Pengjiayu) in the subtropical Northwest Pacific Ocean. Atmos. Environ. 2013; 77: 474–481.
- Shi G. , Chen Z. , Teng J. , Bi C. , Zhou D. , co-authors . Fluxes, variability and sources of cadmium, lead, arsenic and mercury in dry atmospheric depositions in urban, suburban and rural areas. Environ. Res. 2012; 113: 28–32.
- Shi G. , Teng J. , Ma H. , Li Y. , Sun B . Metals and metalloids in precipitation collected during CHINARE campaign from Shanghai, China to Zhongshan Station, Antarctica: spatial variability and source identification. Global Biogeochem. Cycles. 2015; 29
- Shukla S. P. , Sharma M . Neutralization of rainwater acidity at Kanpur, India. Tellus B. 2010; 62: 172–180.
- Sommar J. , Gårdfeldt K. , Strömberg D. , Feng X . A kinetic study of the gas-phase reaction between the hydroxyl radical and atomic mercury. Atmos. Environ. 2001; 35: 3049–3054.
- Streets D. G. , Hao J. , Wu Y. , Jiang J. , Chan M. , co-authors . Anthropogenic mercury emissions in China. Atmos. Environ. 2005; 39: 7789–7806.
- Strode S. A. , Jaeglé L. , Selin N. E. , Jacob D. J. , Park R. J. , co-authors . Air-sea exchange in the global mercury cycle. Global Biogeochem. Cycles. 2007; 21: GB1017.
- Teng J. , Shi G. , Xue W. , Guoxian S. , Tang C . Acidity characteristics of wet deposition in Chongming Dongtan. Environ. Chem. 2010; 29: 649–653.
- United Nations Environment Programme. Global Mercury Assessment. 2002; Geneva: UNEP Chemicals.
- Wang Y. , Wang D. , Meng B. , Peng Y. , Zhao L. , co-authors . Spatial and temporal distributions of total and methyl mercury in precipitation in core urban areas, Chongqing, China. Atmos. Chem. Phys. 2012; 12: 9417–9426.
- Wetang'ula G . Preliminary assessment of total mercury in bulk precipitation around Olkaria area, Kenya. J. Environ. Sci. Eng. 2011; 5: 1585–1595.
- White E. , Keeler G. , Landis M . Spatial variability of mercury wet deposition in Eastern Ohio: summertime meteorological case study analysis of local source influences. Environ. Sci. Technol. 2009; 43: 4946–4953.
- Yan G. , Kim G . Dissolved organic carbon in the precipitation of Seoul, Korea: implications for global wet depositional flux of fossil-fuel derived organic carbon. Atmos. Environ. 2012; 59: 117–124.
- Zahir F. , Rizwi S. J. , Haq S. K. , Khan R. H . Low dose mercury toxicity and human health. Environ. Toxicol. Pharm. 2005; 20: 351–360.
- Zhang L. , Wang S. , Wang L. , Wu Y. , Duan L. , co-authors . Updated Emission Inventories for Speciated Atmospheric Mercury from Anthropogenic Sources in China. Environ. Sci. Technol. 2015; 49: 3185–3194.
- Zhang X. , Siddiqi Z. , Song X. , Mandiwana K. L. , Yousaf M. , co-authors . Atmospheric dry and wet deposition of mercury in Toronto. Atmos. Environ. 2012; 50: 60–65.