
Abstract
Desert dust (DD) aerosols reach the El Arenosillo observatory (southwest Spain) following two characteristic pathways at sea level, each showing significant differences in its aerosol microphysical and optical properties. These differences, in turn, determine the influence on the radiative forcing over the region. For these events, the meteorological scenarios show a depression located over North Africa at ground level. A Mediterranean pathway occurs when: (1) the depression is located over North Africa and the Mediterranean Basin or (2) it is coupled to a high pressure in higher latitudes. A North Africa pathway is observed when the depression is located only over North Africa. In our inventory, there are clear DD episodes under the Mediterranean flow, whereas other specific DD events take place under a mixture of Mediterranean and North African flows. The pure Mediterranean flow is associated with a higher increase of particle volume and scattering coefficient within the sub-micron than the super-micron size ranges. This result indicates that the contribution to the radiative forcing through the scattering processes over the region for particles with D<1 µm is larger than for particles with D>1 µm. In contrast, the episodes with a mixture of Mediterranean and North African flows show a similar effect of sub- and super-micron size ranges on radiative forcing. The size range with the largest impact on the scattering processes is 0.3 µm<D<0.6 µm. Similar temporal variability of in situ and columnar-integrated aerosol properties on episodes with mixed flow suggests that the amounts of aerosols within the super-micron size range at the surface and aloft are correlated. During the episodes with pure Mediterranean flow, the amounts of aerosol vary independently within all size ranges, but the particle size distributions at surface and aloft are similar.
1. Introduction
Desert dust (DD) aerosols represent approximately 40% of the aerosols injected each year into the troposphere (Andreae, Citation1995). They are capable of travelling medium distances to Spain and, in addition, can affect the optical, chemical and microphysical aerosol properties (e.g. Lyamani et al., Citation2005; Toledano et al., Citation2007; Guerrero-Rascado et al., Citation2008; Córdoba-Jabonero et al., Citation2011; Antón et al., Citation2012). The atmospheric aerosol particles have a direct radiative forcing because they scatter and absorb solar and infrared radiation in the atmosphere (e.g. Cachorro et al., Citation2008). Aerosol particles decrease the precipitation efficiency of warm clouds and, hence, cause an indirect radiative forcing that is directly associated with the changes in cloud properties (e.g. Yum et al., Citation2007; Su et al., Citation2008). During recent years, the semi-direct effect has also been studied, in which the absorption of solar radiation by aerosols leads to changes in cloud cover and liquid water path (e.g. Lindeman et al., Citation2011; Sakaeda et al., Citation2011).
The atmospheric aerosol is characterised by large spatial and temporal heterogeneities due to the wide variety of sources, spatial variability, lifetime and the physical and chemical processes in the atmosphere. To demonstrate the climate influence of atmospheric aerosol and to characterise the high variability of aerosol properties, research on the levels and effects of aerosol particles has been declared a priority (e.g. NRC, Citation2005). Better estimates of aerosol optical properties (both the absorbing and scattering processes) at surface level can also be useful for reducing the error in satellite estimates of atmospheric aerosol content or atmospheric correction processes (e.g. Antón et al., Citation2012). Therefore, the physical and radiative characterisation of atmospheric aerosol particles constitutes a significant scientific issue.
In this work, an evaluation of the aerosol–radiation interaction of DD particles is made, and metric such as particle volume size distribution is proposed to carry out the inventory of episodes at surface level. Surface measurements of aerosol optical, separately for fine and coarse modes (scattering coefficient, Ångström exponent, backscattering fraction and sub-micron scattering fraction) and microphysical (volume size distribution, PM10 and sub-micron volume fraction) properties, are presented in terms of DD and non-DD air mass origin. The aim is focused on: (1) combining the aerodynamic and electrical mobility diameter into a single distribution for obtaining the volume size distribution, which has also been used for light-scattering computations for spheroids particles in an extension of the present study (CitationSorribas et al., 2015b), (2) comparing the observed and the computed optical properties using the spherical particle approximation to clarify the uncertainties associated with the measurements, (3) identifying the meteorological scenarios during DD events at ground level as an extension of the studies presented by Escudero et al. (Citation2006) and Toledano et al. (Citation2007); and (4) evaluating the relationship between the optical properties measured by in situ and remote-sensing techniques and the in situ particle volume size distribution, as a tool to evaluate potential changes in the aerosol properties of the dust plume. The points are based on the volume particle concentration as a new metric for episode identification, instead of metrics most widely used as PM10 mass on a filter substrate. This approach, complemented by meteorological models, speeds up the detection of DD episodes. To our knowledge, it is the first analysis at ground level in the Mediterranean region, based on a size-resolved characterisation of optical properties in fine and coarse modes. The multi-instrumental study of aerosol properties was carried out at El Arenosillo Station (southwest Spain) from May to September 2009.
2. Methodology
2.1. Sampling site
‘El Arenosillo’ – Atmospheric Sounding Station is located in southwestern Spain (37.1°N, 6.7°W, 40 m a.s.l.), in the province of Huelva, on the coast of the Atlantic Ocean (~1 km) and close to the Mediterranean Sea and North African coast. The study site is situated in a protected rural environment (Doñana National Park), which is extensively covered with pine forest. More information regarding this observatory can be found in Prats et al. (Citation2008) and Sorribas et al. (Citation2011), Sorribas et al. (Citation2015a).
The aerosol measurements at surface were carried out with a sampling inlet placed at 8 m above ground level and 3 m above the forest. The aerosol sampling was carried out according to Sheridan et al. (Citation2001), with an initial flow rate under turbulent conditions and later under laminar flow in each sampling line towards the instruments. The sample flow rate was 980 l min−1 with a Reynolds Number Re=13650, using a vertical stainless steel pipe (9.8 cm inner diameter and 550 cm length). This outer pipe was placed around two inner pipes: in-pipe-l with 1 cm inner diameter and 120 cm length, and in-pipe-2 with 2.2-cm diameter and 150-cm length. Both pipes transported the sampled aerosol particles into the laboratory with a broad curve. The flow rate and Re in-pipe-1 were 13.3 and 1820 l min−1, respectively. It carried the aerosol particles into the flow splitter and later into the scanning mobility particle sizer (SMPS) and aerodynamic particle sizer (APS) particle spectrometers. Sample flows for SMPS and APS were dried using a Nafion dryer (Perma Pure, Inc., Toms River, NJ, USA) by supplying under-pressured dry air to the sheath of the dryer. In the in-pipe-2, the flow rate was 30 l min−1 and Re=1880, and it conducted the aerosol into the nephelometer. More information about the different instruments will be shown in Section 2.2. The sampling system efficiency (including the dryers) was calculated according to Willeke and Baron (Citation1993) and the AEROCAL program available from P. Baron's website www.aerosols.wustl.edu/AAARworkshop08/html/calculator.htm. The efficiency was 98% for the 0.0165–1 µm particle mobility diameter range and ranged from 98% for 1 µm to 50% for 10 µm.
2.2. Data set
2.2.1. The sub-micron and super-micron particle number and volume size distribution
The sub-micron and super-micron particle size distributions were assumed to be (D<1 µm) and (1 µm<D<10 µm) in aerodynamic diameter, respectively. The dry sub-micron size distribution was monitored by a SMPS (Electrostatic Classifier TSI Mod. 3080 and a Condensation Particle Counter TSI Mod. 3776) with a time resolution of 10 min (Knutson and Whitby, Citation1975). The hourly data availability was 85% for the SMPS instrument. The data were obtained within the 0.0143–0.6753 µm particle mobility diameter range (Ds) using aerosol and sheath flow rates of 0.3 and 3.0 l min−1, respectively. The data sets were corrected for losses caused by diffusion processes and multiple charges inside the instrument using the AIM software (version 9.0.0., TSI, Inc., St Paul, MN, USA). The uncertainties in the concentration of the measured size distributions are assumed to be ±10% from 20 to 200 nm while above this size range it increases to 30% (Wiedensohler et al., Citation2012). The volume size distribution [V(Ds)] within the SMPS size range was calculated by assuming spherical particles in accordance with the following equation:1
where n(Ds) is the particle number concentration with diameter Ds, and D0 and D1 are 0.0143 and 0.6753 µm, respectively.
The dry sub-micron size distribution within the 0.542–1 µm aerodynamic diameter (Da) and the super-micron size distribution within 1–10 µm diameter were monitored by an APS (TSI Mod. 3321) with a time resolution of 30 min (Holm et al., Citation1997). The uncertainty in the concentration of the APS is approximately 10%. The hourly data availability was 82% for the APS instrument. The volume size distribution [V*(Da)] within the 0.542–10 µm size range was calculated from the following equation:2
The aerodynamic volume size distribution measured by APS is referred to as V*, and this will be referred to as V when the Q-assumption (see Section 2.3) is applied, where V represents the mobility volume size distribution.
Conversion of the aerodynamic particle number distribution into the mobility diameter was performed using the algorithm described by Buonnano et al. (Citation2009) and Kaaden et al. (Citation2009). The relationship between Ds and Da is dependent on the particle density (ρ) and shape factor (χ), which are assumed to be independent of particle size within the integration range, as given by3
where ρ0=1 g cm−3 and Q=, which is the so-called size correction factor. Using this relationship and eq. (2), eq. (1) can be expressed as
4
Thus, using a Q-value (Q-assumption), the size distributions measured by the SMPS and APS systems are expressed in the same units and are comparable.
2.2.2. Aerosol scattering properties
An integrating nephelometer (TSI Mod. 3563) was used to measure aerosol scattering and back-scattering at 450, 550 and 700 nm wavelengths, over angular ranges of 7°–170° (total) and 90°–170° (backscatter%3B e.g. Anderson et al., Citation1996). This nephelometer runs within the framework of the NOAA/ESRL aerosol network (www.esrl.noaa.gov/gmd/aero/net/arn/index.html), where the measurements are corrected for known instrumental non-idealities (e.g. Anderson and Ogren, Citation1998). A span check of the nephelometer was carried out every week using CO2 and filtered air, and a zero signal was measured every hour.
Scattering coefficient measurements can be used to determine the aerosol-intensive properties, which are related to the character of the aerosol. The Ångström exponent (å) is calculated as the negative slope of the scattering coefficient versus wavelength curve when plotted on a log–log scale (e.g. Sheridan et al., Citation2001). It is an indicator of the average particle size, where smaller values of å are associated with larger particles. In our work, å is calculated using σsp at 450 and 550 nm, following eq. (5),5
The fraction of backscattered light (b) is defined as the ratio of the integral of the volume scattering function over the backward half solid angle (σbsp) divided by the integral of the volume scattering function over the full solid angle (e.g. Charlson et al., Citation1974).6
A switched impactor system provided for size-segregated aerosol light scattering. The nephelometer measured the aerosol light scattering for particles nominally smaller than 10-µm aerodynamic diameter through the use of a Thermo PM10 inlet located outside the laboratory. Every 5 min, a valve was opened or closed to measure the alternating sub-micron (Da<1 µm) and sub-plus-super-micron (Da<10 µm) size ranges. When the valve was closed, super-micron particles were removed by a multiple orifice impactor with a cutpoint of 1-µm aerodynamic diameter, using Vaseline as the collection substrate. Hence, the apportionment of light scattering into the sub-micron and super-micron size ranges can be evaluated by the sub-micron scattering ratio (Rsp), as eq. (7) shows7
Because the aerosol sampling system of the nephelometer was not conditioned to achieve a low relative humidity, in this study, only data sets with relative humidity values lower than 60% were used. The hourly data availability was 51% for the nephelometer instrument, and the relative humidity had a mean value of 48±8%. By measuring the aerosol at different humidities inside the instruments (SMPS and APS with RH<30% and nephelometer with RH<60%), the comparison between the aerosol microphysical and optical properties may show some discrepancies. With the aim to quantify the effect of different RH on our analysis, the recent results regarding the aerosol particle hygroscopicity in the southeast of Spain are used (Titos et al., Citation2014). The scattering enhancement factor at a RH value of 60% [f(RH=60%)] is the ratio between the scattering coefficient at RH=60% and the scattering coefficient at dry conditions. Considering the air masses without the pollutant contribution picked up when the air mass was travelling at very low levels in their way to the southeast of Spain, which are not representative of the atmospheric circulation in the present work, the most frequent values for f(RH=60%) comprised between 1.0 and 1.05. Therefore, at RH=60% the scattering may have been shifted towards higher values by <5%.
2.2.3. PM10 mass concentration
The PM10 measurement was carried out at the Mazagón Station. It locates 6 km northwest at El Arenosillo in the surroundings of Mazagón Town, which belongs to the air quality monitoring network from the Andalusia Autonomous Government. The PM10 measurement was carried out by an instrument with a measurement technique that is based on the attenuation of β-radiation (FAG FH-62-N); the instrument was equipped with a PM10 inlet. This instrument has an estimated measurement uncertainty of ±1 µg m−3 (e.g. Salminen and Karlsson, Citation2003). The hourly data availability was 96%. It is known that this instrument gives significantly lower results than the gravimetric reference method when measuring PM10, due to the removal of semi-volatile aerosols at the elevated operating temperatures (e.g. Butterfield and Quincey, Citation2007). The reference methodology consists of a PM10 sampling inlet that is directly coupled with a filter substrate and a regulated flow device, followed by a gravimetric mass determination of the collected particulate matter (e.g. Williams and Brockmann, Citation2002). Hence, the air quality monitoring network from the Andalusia Autonomous Government carried out a test protocol to compare the result from the beta samplers with a reference PM10 sampler at all stations in the network. The corrected data sets provide daily averages of PM10.
2.2.4. Integrated-column data set
The integrated-column data set was recorded by an automatic Cimel sun-photometer, which belongs to the NASA Aerosol Robotic Network (AERONET; www.aeronet.nasa.gsfc.nasa.gov). The Cimel measures direct solar and sky radiation at four wavelength channels: 440, 670, 870 and 1020 nm (Holben et al., Citation1998). The aerosol optical depth (AOD) and the Ångström exponent provided by AERONET (level 2.0, cloud screened and quality assured) were analysed in our study. Fine mode fraction (FMF) of AOD, defined as the ratio of small mode optical depth to the total AOD, was also used to give some information about the size range most important to AOD.
2.2.5. Complementary information
The influence of atmospheric transport scenarios on the aerosol properties was analysed by means of atmospheric back-trajectory analysis using the HYSPLIT (Hybrid Single Particle Lagrangian Integrated Trajectory) model (Draxler and Rolph, Citation2003). To represent the atmospheric flows at three altitudes (500, 1500 and 3000 m), the air mass back-trajectories were evaluated. Each set of kinematic 3-D back-trajectories at three altitudes was calculated each hour from 1 May to 30 September 2009, using the GDAS (Global Data Analysis System) meteorological files as the data input for the HYSPLIT model.
Additionally, to confirm the occurrence of DD events over our sampling site, dust load forecast models, such as BSC/DREAM (Dust Regional Atmospheric Model, www.bsc.es/projects/earthscience/DREAM) and NAAPS (Navy Aerosol Analysis and Prediction System, www.nrlmry.navy.mil/aerosol/#currentaerosolmodelling), were used to collect the surface-level information.
2.3. The Q-assumption
The Q-assumption, which describes the dependence of the aerodynamic volume size distribution [eq. (4)] on the particle density and the shape factor, was introduced in Section 2.2.1. Uncertainties in the particle density and shape factors represent the main contribution to the total volume concentration uncertainty (e.g. Shen et al., Citation2002; Buonnano et al., Citation2009). In the following discussion, the values for both the parameters used in this study are discussed.
The particle density was estimated from the average chemical composition of the aerosol, which was sampled during 2004–2006 using a MCV high-volume sampler (CAVF-PM1025) equipped with PM10 and PM2.5 inlets (González-Castanedo, Citation2007; Sánchez de la Campa et al., Citation2009). The PM2.5 data set was used to estimate the particle density within the sub-micron size range (ρ1), while the PM10–2.5 data set was used for the super-micron size range (ρ10–1) based on eq. (8) (Hand and Kreidenweis, Citation2002):8
where Xi is the mass fraction for species i, and ρi is the individual species density (g·cm−3) within the sub-micron and super-micron size ranges.
The chemical composition of the sub-micron aerosols consisted of 31.4% secondary inorganic compounds (anthropogenic SO4 2−, nitrate NO3 − and ammonium NH4 +), 8.1% crustal compounds (CO3 2−, SiO2, AlO3, Ca, K, Mg and Fe), 4.6% marine aerosols (marine SO4 2−, Cl, Na and Mg), 0.46% elemental carbon, 31.6% organic matter and 23.8% undetermined matter. Assuming the density for each chemical constituent reported by Khlystov et al. (Citation2004) but considering a density of 2.2 g cm−3 for marine and crustal components, ρ1 is estimated to be 2.2 g cm−3. With respect to the chemical composition of the super-micron aerosols, the mass concentrations for these species were 19.5% secondary inorganic compounds, 39.6% crustal compounds, 24.1% marine aerosols, 2% elemental carbon, 5.7% organic matter and 9.1% undetermined matter. Thus, the average density within the super-micron size range, ρ10–1, was also 2.2 g cm−3. These values are consistent with the previous analyses of average density, which estimated the value from chemical measurements taken over a coastal environment (e.g. Marshall et al., Citation2007) and over a site influenced by DD episodes (e.g. Reid et al., Citation2003, Citation2008).
It should be noted that errors may be introduced into the density estimation in different ways. There is a high fraction undetermined in our chemical analysis for sub-micron and super-micron particles of up to 23.8 and 9.1%, respectively, which could affect the average density. To demonstrate the magnitude of the error, a short analysis was performed, assuming the extreme density values used in this work (i.e. 1.4 and 2.2 g cm−3) for the density of the undetermined matter. Thus, ρ1 and ρ10–1 were estimated to shift by less than ~20 and ~10%, respectively, to lower values. Other possible error sources are: (1) the density estimation based on 2 yr of chemistry measurements (different period), (2) the assumption of a constant value through the particle size distribution as the composition and the physical properties of ambient particles usually vary with size, (3) the different temporal coverage of each measurement, as the chemical compounds are measured with a 24-h integrated time resolution and particle size distribution is averaged to hourly values and (4) particles may have an effective density, which is lower than material density due to internal voids. In spite of all these error sources, the uncertainties for the estimation of an average density using chemical compounds (Hand and Kreidenweis, Citation2002) or the bibliography references (e.g. Chen et al., Citation2011; Ma et al., Citation2014) may be high but it is essential to carry out similar analysis or closure studies between microphysical and optical properties.
No information on aerosol morphological properties was available for deriving the shape factor. El Arenosillo Station is a rural site, and the particle size distribution is characterised by the presence of aged particles and sporadic episodes of industrial pollution under a specific wind direction in addition to the absence of local traffic and residential influences (Sorribas et al., Citation2011). El Arenosillo Station is also a coastal site in proximity to the African continent as well as sea-salt and DD aerosols, which show χ>1; such occurrences are very frequent during the summer time when the data set used in this study was gathered. Some references quantify χ=1.5 for DD aerosols (e.g. Davies, Citation1979; Endo et al., Citation1998; Kaaden et al., Citation2009). With respect to the marine aerosol fraction, χ=1.08 was obtained in the studies of Wex et al. (Citation2010) and Niedermeier et al. (Citation2008). Taking into account the chemical composition and if a weighted average for χ is considered, based on eq. (8) for particle density, χ is estimated to be 1.0 and 1.2 for the sub- and super-micron size ranges, respectively. These values are consistent with the results found by the previous analyses (e.g. Reid et al., Citation2003, Citation2006; Wex et al., Citation2010). The errors introduced into the shape factor estimation could be similar than those derived for the density in the previous paragraph. And as the power of the shape factor is three times as high as the one of density, the influence of the shape factor dominates in eq. (4).
Therefore, by assuming the ρ1, ρ10–1, χ1 and χ10–1 values, Q1 and Q10–1 are estimated to be 1.5 and 1.1, respectively, following the definition of the size correction factor provided in Section 2.2.1.
The nephelometer measured over two size ranges separated at 1 µm aerodynamic diameter, while the SMPS measures the particle size distribution within 14.3–675.3 nm mobility diameter. Taking into account the values of Q and eq. (3), the highest mobility diameter measured by the SMPS (675.3 nm) corresponds to 1.013 µm aerodynamic diameter. Therefore, with the aim to compare the microphysical and optical aerosol properties, the sub-micron (Da<1 µm) size range was characterised by the SMPS data and the similar size fraction measured by the nephelometer data, while the super-micron (1 µm<Da<10 µm) size range was described by the APS and similar size fraction measured by the nephelometer. Given that, the APS channels measuring below 1 µm were not used to describe the super-micron aerosol size distribution. Therefore, the volume size distribution was called Vi, where (i=1) if Da<l µm, (i=10–1) if 1 µm<Da<10 µm and (i=10) if Da<10 µm.
3. Results and discussion
3.1. Particle scattering closure assessment
To clarify the uncertainties associated with the measurements of microphysical and optical aerosol properties, the observed σsp and σbsp were compared to the computed values derived from the Mie Theory (spherical particles approximation).
Using the hourly averages of the SMPS-APS data and refractive indexes (m) of 1.482 and 1.527 within the (Da<1 µm, fine mode) and (1 µm<Da<10 µm, coarse mode) size ranges, respectively, the Mie Theory presented in Bohren and Huffman (Citation1983) was used to compute the scattering coefficient at wavelengths 450, 550 and 700 nm. The particle size used for the Mie calculations was the mobility diameter, which was assumed to be similar to the geometric diameter. The calculation of m was performed using a volume-weighted method (Hand and Kreidenweis, Citation2002) and the particle composition given in Section 2.3, assuming the refractive indices of marine aerosols 1.5+10−8·i (Chamaillard et al., Citation2010), ammonium sulphate 1.521 (Virkkula et al., Citation2011), crustal compounds 1.54+0.004·i (Chen et al., Citation2011), elemental carbon 1.87–0.22·i (Schkolnik et al., Citation2007) and organics 1.43+3.754·10−4·i (Marshall et al., Citation2007). Because the effect of the imaginary refractive index on the calculated σsp is negligible (Virkkula et al., Citation2011), it was not considered in the Mie Theory computations.
a.1–a.3 compares the computed and observed scattering values for particles with Da<1 µm, assuming a refractive index of 1.482, at 450, 550 and 700 nm, respectively.
Fig. 1 A close assessment of the scattering distributions: observed versus computed by the Mie Theory. The computations are based on the (Da<1 µm) particle size distributions measured by a SMPS particle spectrometer: (a.1) at 450 nm, (a.2) at 550 nm and (a.3) at 700 nm and the (1 µm<Da<10 µm) particle size distributions measured by an APS particle spectrometer: (c.1) at 450 nm, (c.2) at 550 nm and (c.3) at 700 nm. A close assessment of the backscattering distributions is also shown in b and d. The 1:1 line is the dashed line. On each panel, the nephelometer wavelength, the refractive index, the slope±SE of the fit (blue line) and the R correlation coefficient are shown.
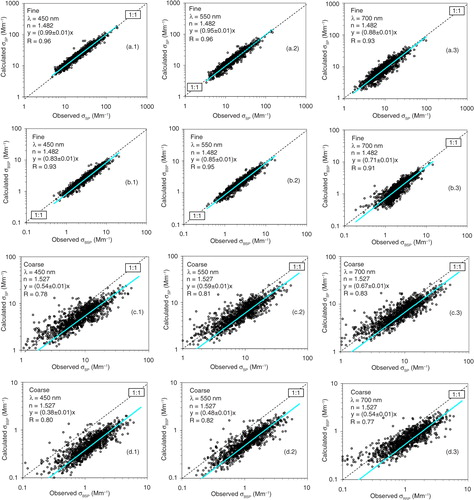
The results show a strong correlation between computed and observed values and, in this sense, a good agreement between the optical, microphysical and chemical aerosol properties. The experimental uncertainty can be explained by the uncertainties associated with the variability of the nephelometer data during each scan of the size distribution measurements (the scans of both instruments have different resolution time). Other influences on the uncertainties of the observed data could be the photon-counting statistics, the precision of the determination of zero background signals and errors of the gas calibrations (Heintzenberg et al., Citation2006). The uncertainties in the computed σsp (Da<1 µm) can be associated with the uncertainties in the measured size distribution (see Section 2.2.1). Other influences on the uncertainties of the computed scattering could be due to the input data of the Mie Theory (e.g. refractive index; Kahnert et al., Citation2007) and those found in the Q-assumption (Buonnano et al., Citation2009).
The observed backscattering measurements have been also compared with computed backscattering, and the linear fits can be found in b.1–b.3. The correlation values (R) of σbsp are lower than those of σsp, with values from 0.91 at 700 nm to about 0.94 at 450 and 550 nm. Moreover, the correlation slopes are lower than 1, indicating the underestimation by the computed data.
c.1–c.3 shows the computed versus observed correlations, σsp (1 µm<Da<10 µm), suggesting that the Mie Theory computations underestimate the scattering coefficient by 46, 41 and 33%, respectively. And d.1–d.3 shows an underestimation of the backscattering coefficient of 62, 52 and 46%, respectively. Previous ground-based scattering closure studies demonstrated that the differences between the observed and computed values (coarse mode) can be attributed to the effect of non-spherical particles (e.g. Marshall et al., Citation2007; Chen et al., Citation2011). These differences could be highest for large particles, such as marine (e.g. Kleefeld et al., Citation2002) or DD aerosols (e.g. Dubovik et al., Citation2002), which dominate the super-micrometre part of the total particle size distribution at the El Arenosillo site.
3.2. A statistical summary of the data set
3.2.1. Microphysical aerosol properties
The mean hourly values for the studied microphysical and optical aerosol variables are shown in .
Table 1. Statistics for the main microphysical and optical aerosol parameters (for dry conditions) from 1 May to 30 September 2009, at El Arenosillo Station
The mean value of N10–1 was 1.9±1.9 cm−3 with an 84-percentile value of 3.4 cm−3, where the largest number concentrations were related to DD episodes (). The mean value of N1 during summer time is reported in Sorribas et al. (Citation2011). The mean sub-micron volume concentration (V1) was 7±4 µm3 cm−3; in contrast, within the super-micron size range, V10–1 was 5±3 µm3 cm−3. The largest volume concentrations for V1 and V10-1 were achieved during DD episodes. also shows the mean sub-micron to total volume concentration ratio, Rv=[V(Da<1 µm)/V(Da<10 µm)] with a value of 0.55±0.16, indicating a similar contribution to the total volume for fine and coarse particles. These means are analysed in detail in Section 3.3, in terms of DD and non-DD days.
Note that the PM10 mean concentration registered at regional background stations over the Iberian Peninsula is characterised by a seasonal evolution with the maxima obtained during the spring–summer period (Querol et al., Citation2004); furthermore, these maxima are in the range of the mean concentration shown in with (27±12) µg m−3.
3.2.2. Optical aerosol properties: relationship with microphysical properties
also shows the optical parameters. The hourly values of σsp were analysed within the (Da<10 µm) and (Da<1 µm) size ranges. σsp (Da<10 µm) showed a mean±SD value of 29±2 Mm−1, while σsp (Da<1 µm) was 17±2 Mm−1. The arithmetic mean-scattering coefficient within the (Da<10 µm) size range is quite similar to that of 39±27 Mm−1 reported in a previous work by López et al. (Citation2011), where 2 yr of data from El Arenosillo Station were used. The values of the summer mean-scattering coefficient for Da<10 µm found at other sampling sites, also located in the Iberian Peninsula, are higher than the mean value at El Arenosillo, namely: the background urban sampling stations of Evora, 50±70 Mm−1 (Pereira et al., Citation2011), Granada, 50±23 Mm−1 (Lyamani et al., Citation2008, Citation2010) and Valencia, 80±40 Mm−1, approximately (Esteve et al., Citation2012). Additionally, the aerosol scattering values in a background rural site in northwest Spain are shown in Pandolfi et al. (Citation2011), who reported a mean σsp (Da<10 µm) of 27±23 Mm−1, which increased by 30–40 Mm−1 during the regional and Saharan episodes during summer time.
Mean values of å(Da<10 µm) and å(Da<1 µm) were 1.3±0.4 and 2.0±0.3, respectively, dropping when an increase in coarse particle contributions occurred under DD air masses. a shows the relationship between the sub-micron scattering fraction (RSP) and the Ångström exponent [å(Da<10 µm)]. The figure shows that for å(Da<10 µm) >1.0, the scattering of the sub-micron size range predominated over the total scattering (RSP>0.5). Additionally, some references indicate that approximately 60–70% of scattered light is scattered by sub-micron particles (0.6<RSP<0.7) for å(Da<10 µm) of 1.50 (Sheridan et al., Citation2001; Delene and Ogren, Citation2002). Our study shows similar results (see a).
Fig. 2 Mean hourly sub-micron scattering ratio (RSP) versus Ångström exponent (å) and RSP ratio and fraction of backscattered light (b) versus sub-micron volume ratio (RV) during the analysed period. The mean values (black lines) were calculated over 0.1 Mm−1 σSP and 0.1 RV bins.
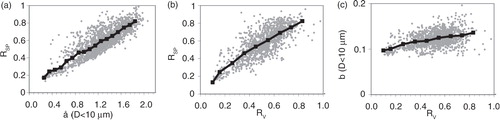
The value of the mean sub-micron scattering fraction (RSP), 0.59±0.17, suggested that the common predominance of the sub-micron size range over the total scattering during summer time. Comparing RSP values at El Arenosillo to those presented in Delene and Ogren (Citation2002) for several stations, they are lower than the recorded at the regional monitoring station of Bondville (0.85±0.09) and larger than those at the marine station of Sable Island (0.36±0.19). Similar RSP values were found at El Arenosillo and Barrow stations, both with a large contribution of sea-salt particles. b shows the relationship between RSP and RV, showing the sensitivity of RSP to changes in the relative amount of sub-micron volume concentration: if there are more particles within (Da<1 µm) size range, there is enhanced sub-micron particle scattering, showing a curve closer to (1:1) line.
The mean hemispheric backscattering fraction (b) in the (Da<1 µm) and (Da<10 µm) size ranges was 0.14±0.02 and 0.12±0.02, respectively, corroborating that as particles get smaller, their b increases (Seinfeld and Pandis, 1998). However, in our study, no clear linkage with particle concentration (b and V1) was found. It is illustrated in c, which corroborates the results found by Aaltonen et al. (Citation2006), who studied the environment of northern Finland. The values of b are similar to the reported data by Delene and Ogren (Citation2002), which was recorded during the summer time for different environments in the United States. Other values of b found at Granada, in the Iberian Peninsula (urban environment background), were close to 0.14 (Lyamani et al., Citation2010), and at Evora were close to 0.13 (Pereira et al., Citation2011).
3.3. Analysis of the DD episodes
3.3.1. Methodology to identify DD episodes
The inventory of African DD events at 1500 m over El Arenosillo, based on an AERONET Cimel sun-photometer, was previously reported (Toledano et al., Citation2007); some of these dust episodes are also observed at ground level.
For the identification of periods under DD influence at ground level on our sampling site, the operational predictions published daily by the CALIMA project has been used (www.calima.ws). CALIMA is based on the prediction of the particle concentration at ground level by models (SKIRON, DREAM and NAAPS), and by meteorology tools such as back-trajectories or wind maps. The confirmation of the selected dates is carried out using the daily PM10 data set measured in background environments such the EMEP stations (European Monitoring and Evaluation Programme, www.emep.int).
For each DD episode, the analysis of the particle size distributions is carried out by a visual inspection of the volume concentration within (Da<1 µm), (1 µm<Da<10 µm) and (Da<10 µm) size ranges, V1, V10–1 and V10. For example, a shows the volume concentrations of the DD episode observed from 25 to 26 July 2009. The influence of DD at ground level is significant on 25 July 2009 at 23:00 GMT when V1, V10–1 and V10 increase towards a maximum at midday on 26 July. The influence of DD aerosols decreases on 27 July at 00:00 GMT, when the previous volume concentration levels are achieved. The impact of the DD at ground level is supported by the daily plots of the dust surface concentration provided by the BSC/DREAM model over the Iberian Peninsula, as presented in b, which presents a composite following the BSC/DREAM daily evolution plots from 32°N to 44°S latitude and 12°W to 7°E longitude.
Fig. 3 Desert dust episode at El Arenosillo Station observed during 25–26 July 2009. (a) Sub-micron volume concentration (V1), super-micron volume concentration (V10–1) and total volume concentration (V10) measured by the SMPS-APS system. (b) Daily plots of the dust surface concentration (in µg m−3), provided by the BSC/DREAM model over the Iberian Peninsula from 25 to 27 July. The hours elapsed since the forecasts are indicated between brackets (www.bsc.es/projects/earthscience/DREAM). El Arenosillo Station is identified as a blue dot in the first (b).
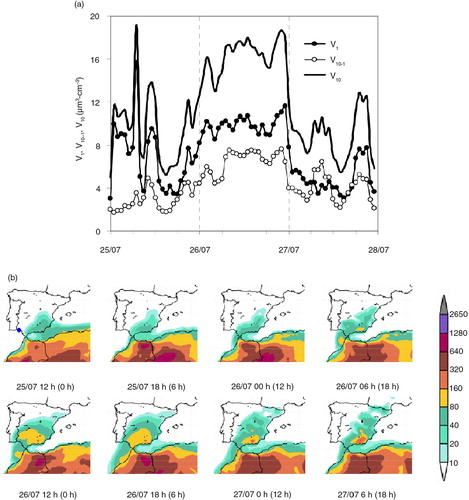
In next step, the start and end times of the episodes are established. It is carried out by a visual analysis of the information about particle surface concentration from the NAAPS and BSC/DREAM models and the 24-d back-trajectories calculated at 500 m using the HYSPLIT model (Section 2.2.5). This step is performed because the CALIMA predictions only show the start and end day of the episode but not the exact time.
From May to September 2009, the DD plumes are detected at ground level during 11 episodes, accounting for 37% of the studied data set. The intensity of the DD episodes is highly variable, as well as the duration with a mean value of 5±5 d. The longest event has a temporal extent of 14 d.
3.3.2. Meteorological scenarios during DD events
The synoptic conditions favouring the arrival of DD from North Africa to the Iberian Peninsula have been previously reported (e.g. Escudero et al., Citation2006; Toledano et al., Citation2007). To characterise the daily atmospheric scenarios during our DD inventory, the NCEP meteorological maps (www.esrl.noaa.gov/psd/data/gridded/data.ncep.html) have been used. The typical summer scenario is related to a thermal low over North Africa, which produces large amounts of dust to be lifted to high altitudes. This dust is transported towards the Iberian Peninsula in upper levels due to a high pressure over North Africa and in lower levels due to the development of the Saharan thermal lows. The second scenario observed in our inventory is called North African depression, which is the main atmospheric scenario responsible for the transport of DD over the eastern Mediterranean Basin. This dust is transported under the influence of a depression in lower and upper altitudes over North Africa.
The arrival of atmospheric flows with DD particles at ground level over El Arenosillo is dependent on the location of the depression in both synoptic conditions. There is a Mediterranean flow: (1) if the depression is located over North African and the Mediterranean Basin or (2) if it is coupled to a high pressure in higher latitudes (over England or Central Europe). However, there is a North Africa flow if the depression is located only over North Africa. In our inventory, the visual inspection of the back-trajectories for each DD episode allows identifying that there are DD episodes only under the Mediterranean flow at ground level, while other specific DD events are under a mixture of Mediterranean and North African flows due to the movement of the depression between high and lower latitudes. These specific DD events have been classified as the mixture of Mediterranean and African Flows days (DD-MAF days). In our data set during 2009 summer time, five DD-MAF episodes were identified. When the lowest altitudes were only influenced by the Mediterranean flow, the DD events were classified as Mediterranean Flows days (DD-MF days). Six DD-MF episodes are identified in our database.
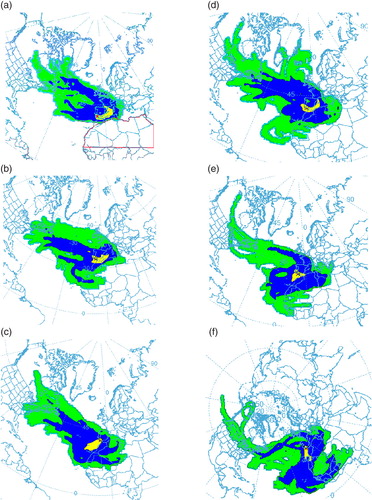
Back-trajectory frequency maps are calculated to confirm the origin of air masses arriving at El Arenosillo during the two classes of DD days (). In the free troposphere level (3000 m), the highest frequency corresponds to an area in the Atlantic Ocean near the African coast (c and f). In the transition level (1500 m), during DD-MF days, the highest frequency is observed over the Mediterranean Basin (b) and during DD-MAF days over the North coast of Africa (e). During all DD situations, wind comes from the Mediterranean Basin at the lowest levels of 500 m (a and d). The important difference for our study between both DD classes is found at 500 m: during DD-MF (a), there are no observed back-trajectories coming from the DD source area (red line), whereas there are some air masses on DD-MAF days (d).
Fig. 4 The back-trajectory frequency evaluated by the HYSPLIT Model at three altitudes, calculated every hour during the desert dust (DD) events. The air flows during the DD-MF days at (a) 500 m, (b) 1500 m and (c) 3000 m and during the DD-MAF days at (d) 500 m, (e) 1500 m and (f) 3000 m. El Arenosillo Station is identified as a red star and the source area of DD as a red line in (a). The colours indicate the frequency (in %) of a backward trajectory crossing over a geographical point (green: >0.1%, dark blue: >1% and yellow: >10%).
The DD particle contribution at ground level during all DD events is demonstrated in Section 3.3.1 using atmospheric transport models and experimental data. And thanks to the meteorological scenarios described for both DD classes, the influence of Mediterranean air masses is also known. In our sampling period, DD events at ground level without Mediterranean influence were not observed. During DD-MF days, the DD contribution is incorporated in the air mass as it advects from the Mediterranean Basin to the sampling area, and whereas during DD-MAF days, the DD is added with the mixed flow coming from Mediterranean and from the North Africa.
3.3.3. Aerosol microphysical and optical properties during DD episodes
The statistical parameter (arithmetic or geometric means) to test the differences in diverse populations (e.g. DD vs. N-DD cases) depends on the frequency distribution. Q–Q plots (quartile–quartile plots) are used to analyse the distribution of each aerosol parameter, concluding that the extensive properties (N, V, PM10 and σSP) are described better by a log–normal distribution and so, we report geometric means (SDs). But the intensive properties (RV, b, å and RSP) have a normal distribution, and they are reported as the arithmetic means±SDs. shows the mean hourly aerosol microphysical and optical properties during N-DD, DD-MF and DD-MAF days. presents the statistics (absolute and relative differences). The question under consideration is whether an aerosol property for N-DD days is significantly different than that property for DD-MF or DD-MAF days, at some chosen level of significance. For that, a 95% level of confidence and a two-tailed test have been used. All the differences are significant, except those values indicated in with an asterisk.
Table 2. Mean hourly values of the primary microphysical and optical aerosol parameters (for dry conditions) during the N-DD, DD-MF and DD-MAF days from 1 May to 30 September 2009
Table 3. Statistics (absolute and relative differences) of microphysical and optical properties (for dry conditions) between desert dust and non-desert dust days (N-DD & DD-MF and N-DD & DD-MAF)
Larger values of N10–1, V1 and V10–1 are observed on DD days than on N-DD days. The sub-micron to total volume concentration ratio (RV) during N-DD days is 0.54±0.15, reaching the highest value, RV ratio of 0.65±0.12, during DD-MF days. Comparing the two classes of DD days, V1 during the DD-MF days is 34% higher than during DD-MAF days. In contrast, V10–1 during the DD-MAF days is larger by 42% than during DD-MF days, reaching a RV ratio of 0.46±0.15.
In conclusion, there are significant differences in the aerosol microphysical properties between the two classes of DD episodes: the particle contribution in the super-micron size range is larger during DD-MAF days. This means that during DD-MF days some particles within the super-micron mode could be influenced by the strength of emissions of the dust and rain-out events. In contrast, the particle contribution in the sub-micron size range is larger during DD-MF days. It might be because of the increase of particles concentration due to a higher Mediterranean particle contribution.
The differences in the aerosol microphysical properties also cause differences in the aerosol scattering properties because the scattering is an aerosol extensive property and depends on the particle concentration. During DD days, σsp (Da<10 µm) and σsp (Da<1 µm) were higher than during N-DD days. The higher impact of the aerosol on the scattering processes is apparent during the DD-MF days (see Table and 3 ). The topography and synoptic scale patterns in the western Mediterranean inhibit the renewal of the air masses and favour the accumulation of atmospheric particles (e.g. Castell et al., 2008). The contribution of mineral dust mixed with a higher contribution of particles coming from the Mediterranean Basin could be the cause of the increase observed on the scattering processes.
During DD-MF days, the RSP ratio indicates the predominance of the sub-micron size range on scattering. It suggests that the contribution to the radiative forcing over the region through the scattering processes for particles with Da<1 µm is larger than for particles with Da>1 µm. The aerosol scattering effectiveness on solar radiation for anthropogenic particles is higher than for DD particles (Córdoba-Jabonero et al., Citation2011), and it may explain this increase on RSP during DD-MF days. However, during DD-MAF days, the RSP ratio indicates that the sub- and super-micron size ranges have similar contributions to light scattering.
During the DD-MF days, å (Da<10 µm) was also higher than during the N-DD days (). This finding is in agreement with the higher contribution of the mixed aerosol (DD with Mediterranean pollution) to the volume concentration of fine mode in comparison to coarse mode (see RV ratio, Table and 3 ).
A technique for fitting the median volume size distribution has been used in our work to compare the modal parameters for each category (N-DD, DD-MF and DD-MAF). The data were fitted using two log-normal modes: one sub-micron and other super-micron (a–c). The obtained modal parameters are also given in . The modal parameters shown in a–c illustrate that the geometric diameters for sub-micron mode are shifted to greater diameters during DD days with respect to N-DD days, while they are shifted to lower diameters for the super-micron mode.
Fig. 5 Mean size distribution of V and σsp and the fitting size distributions of the two log-normal modes and their sum for each type of day (N-DD, DD-MF and DD-MAF). (a, b and c): dV/d log D and (d, e and f): dσsp/d log D. The modal parameters (geometric mean diameter, Dg, the geometric SDs, σg, and the total mode concentration), V and σsp are also shown.
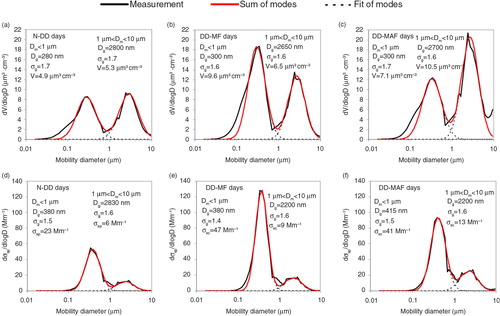
The dependence of the scattering coefficient on particle size, the particle scattering size distribution, has been computed using Mie Theory. The hourly scattering size distributions for each type of day were averaged, and the mean values are presented in d–f. The log-normal fit function, depending on the type of day for the scattering size distribution, was also evaluated, and the modal parameters are also shown in . The size range with the highest impact on total scattering was 0.3 µm<D<0.6 µm in all cases, with about 42% during the N-DD days and DD-MAF days, and 50% during the DD-MF days.
In contrast, the average contribution to the total scattering of super-micron particles did not depend on the atmospheric pathway. The super-micron size range must be considered carefully because, as presented in Section 3.1, the disagreement in the calculated and observed σsp (Da<10 µm) suggests that the Mie Theory calculation underestimates the super-micron scattering coefficient. This underestimation might explain the discrepancies between the calculated scattering size distributions (f) and the sub-micron scattering fraction (RSP) (Table and 3 ) during DD-MAF. This air mass category has a mean RSP of (0.54±0.10), indicating a similar contribution to the total scattering of particles within the sub-micron and super-micron size ranges. However, note that in f, the contribution to the total scattering of particles within the sub-micron size range is higher than those within the super-micron mode.
Finally, the influence of DD on the PM10 is clear (see Table and 3 ). During DD days, there is an increase of more than 50% in PM10, leading to a mean value of 33 (1.5) µg m−3. The increase in PM levels as a result of the high mineral load of the DD air masses has been previously and extensively studied over the Iberian Peninsula (Rodríguez et al., Citation2001; Querol et al., Citation2004). PM10 showed similar values during DD-MF and DD-MAF days. In this way, for a detailed classification of DD events as a function of the pathway followed by the air masses, the new metrics based on volume size distribution are more appropriate than those based on PM10.
3.4. A comparison between the surface-level and integrated-column data sets
Atmospheric aerosol properties can be measured by various techniques (i.e. in situ, ground level and satellite remote sensing). The relationship between these techniques can provide additional information regarding: the homogeneity of the mixed layer (e.g. Estellés et al., Citation2012), the particle levels filling the gaps between the ground level networks (Schaap et al., Citation2009) or the limitations associated with the different retrieval techniques used to calculate the aerosol properties (e.g. Preißler et al., Citation2012; Fernández-Gálvez et al., Citation2013).
Recently, several studies have used the AOD from Cimel measurements and the PM10 and PM1 concentrations from high-volume samplers to correlate column-integrated and surface-level data sets. A summary of the references considering the correlation between both instruments can be found in Estellés et al. (Citation2012). One of the limitations associated with the AOD-PM correlation is the unique temporal coverage of each measurement, as the AOD is measured during daylight hours and cloud-free conditions, while PM is measured with a 24-h integrated time resolution (e.g. Smirnov et al., Citation2000).
In our work, the correlation sub-micron/super-micron/total volume concentration to fine mode/coarse mode/total AOD at 500 nm is studied. To do so, the uncertainty due to temporal coverage has been removed by computing the average in situ parameters and AOD only for those times during each day when the Cimel data were retrievable. The correlation between both can be broken down into its components parts, as the following equation shows:9
where k and i identified the different size ranges: k=fine, coarse or total (fine plus coarse) modes and i=1, 10-1 or 10 following the nomenclature used in previous sections. This approach requires the assumption that the fine and coarse modes of AOD are separated at 1 µm aerodynamic diameter.
The first term in brackets describes the relationship between the optical and microphysical measurements at ground level (σsp and V), which represents the dependency of the scattering processes, and so the particle radiative effects, with respect to the particle concentration. And the second term in brackets links the surface optical measurement with the integrated-column optical measurement (AOD and σsp). It is known that the vertical structure is an important factor affecting the relationship between integrated-column and in situ measurements. Additionally, in situ measurements can approximate the vertical structure of the aerosol when the mixing layers are well mixed and no inhomogeneous vertical aerosol profile is present in the troposphere and boundary layers (e.g. Chaudhry et al., Citation2007; Schaap et al., Citation2009). This representativeness can be also observed when the aerosol particles are mainly contained within a layer close to ground level, such as the urban environment (e.g. Schäfer et al., Citation2008; Boyouk et al., Citation2010). In our work, no information was obtained for the mixing layer, but current studies under development are trying to solve this gap.
shows the correlation coefficients (R) between AOD and V within different particle size ranges, as well as, between RSP and RV with FMF. And Table 5 presents the coefficient of the linear regression V=a·AOD+b for the cases with R values higher than 0.7, which are emphasised in bold in Table 4.
During the N-DD days, the highest correlation was found for AOD (Fine)&V1, yielding a value of R=0.73. In a previous work carried out at El Arenosillo Station (Estellés et al., Citation2012), the correlation coefficients between AOD (total)&PM1 were obtained from a GRIMM monitor. This study also used simultaneous measurements, obtaining values that were higher (R=0.80) than those obtained in our study. However, note that the earlier work was focused on a 1-week campaign, while our study is based on a data set of 5 months, which ensures greater variability in the aerosol type and atmospheric conditions. From eq. (9), the AOD (Fine)&V1 is studied in terms of σsp (Da<1 µm)&V1 and AOD (Fine)&σsp (Da<1 µm). The correlation coefficient of both terms is high with values greater than 0.80 (they are not shown in ), concluding that the amounts of particles within sub-micron size range at ground level are connected to the particles aloft during N-DD days.
Table 4. Pearson's correlation coefficients (R) obtained by linear regression of AOD (500 nm) versus V within several particle size ranges, as well as, between RSP and RV with FMF
Table 5. The coefficients a and b of the linear regression V=a·AOD+b, for R>0.7, as shown in Table 4.
During the DD days, we observed an increase in particle concentrations in both the fine and coarse size ranges (Section 3.3.3). We also found that dust advection is corroborated by back-trajectories analysis (Section 3.3.2). The increase in particle concentrations causes an improvement in the correlation coefficient between AOD and the volume concentration of particles within the super-micron size range. For that reason, the highest correlation for AOD (Coarse)&V10–1 with the value of R=0.81 was found during DD-MAF days. In contrast, the relationship between AOD and the volume concentration of particles within the sub-micron size range disappears during all DD days. From eq. (9), we observe a high correlation for σsp (Da<1 µm)&V1 but a poor relationship for AOD (Fine)&σsp (Da<1 µm). These relationships show that the optical properties at surface and aloft are independent.
According to the meteorological scenarios shown in Section 3.3.2, poor agreement between the column-integrated and in situ aerosol properties was found during the DD-MF days within the sub-micron size range (). DD-MF days were characterised by decoupled atmospheric levels, producing the arrival of air masses from the Mediterranean Basin mixed with DD aerosol at ground level and only DD plumes in layers at high altitudes. Therefore, at ground level there was a contribution of a second aerosol source (Mediterranean aerosol) influencing the particle scattering processes.
During DD-MF, the R value for AOD (Coarse)&V10–1 was 0.68 indicating a weaker relationship than during DD-MAF. also shows the highest R value between RV&FMF during DD-MF, indicating that the size distributions of the particles at the surface and aloft are similar.
Finally, the correlation of FMF&RSP is shown in , indicating a poor agreement between both optical quantities. The correlation of FMF&RV is also low; Müller et al. (Citation2012) suggested that it could be related to a retrieval error for AERONET-FMF or because the in situ measurements do not cover the all atmospheric column as remote-sensing data. Nonetheless, the mean values of FMF during N-DD and DD days were 0.48±0.13 and 0.62±0.13, respectively, suggesting an increase in the extinction of solar radiation for particles within the fine size fraction during DD days. This behaviour supports the result previously shown in Section 3.3.3 by the mean values of sub-micron scattering fraction (RSP), which also increase during DD episodes.
4. Conclusions
Aerosol optical and microphysical properties of air masses arriving at El Arenosillo Station have been analysed from May to October 2009. The analysis of differences of aerosol properties during DD conditions compared with non-DD provides valuable information that can be used for radiative forcing estimation over the area. In our study, a new metric to identify the DD events is proposed, the volume particle size distribution, which was measured by a SMPS-APS system.
Two atmospheric flow pathways transporting the DD at southwest Spain have been identified. The Mediterranean flow when the depression is located over North African and the Mediterranean Basin or when it is coupled to a high pressure in higher latitudes (over England or Central Europe). The North Africa flow takes place when the depression is located only over North Africa. These results have identified two classes of DD episodes: (1) those events that were observed only under Mediterranean flow at ground level and (2) other specific DD events that were observed under a combination of Mediterranean and North African flows (due to the movement of the depression from higher to lower latitudes during the DD event).
The particle contribution within the super-micron size range is larger during the DD events under the mixed flow from Mediterranean and North Africa areas than during events under a pure Mediterranean flow. This result suggests that during the pure Mediterranean flow the strength of emissions of the dust and rain-out events might play an important role in size distribution change.
Differences in the aerosol microphysical properties also cause differences in the aerosol optical properties. During DD days, the scattering process is higher than during non-DD days, especially during the pure Mediterranean flow at ground level. The higher contribution of the particles coming from the Mediterranean Basin causes the increase observed on the scattering processes. Moreover, the predominance of the sub-micron size range on scattering is also observed during the pure Mediterranean flow. It suggests that the contribution to the radiative forcing over the region through the scattering processes for particles with Da<1 µm is larger than for particles with Da>1 µm.
The median contribution of different size ranges to the total particle scattering has been analysed. The highest impact on total scattering is within (0.3 µm<D<0.6 µm) size range with a contribution between ~42% during non-desert desert days and ~50% during the episodes with mixed flow. In contrast, the average contribution to the total scattering of super-micron particles was not dependent on the atmospheric flows.
The analysis of the relationship between microphysical and optical parameters by in situ and columnar-integrated techniques provides additional information regarding the representativeness of the amounts of aerosol and the particle size distribution in terms of the altitudes. Thereby, during the episodes with the mixed flow, the amounts of aerosols within the super-micron size range at the surface and aloft vary dependently. And during the episodes with pure Mediterranean flow, the amounts of aerosol for all size range vary independently, but the particle size distributions were similar at ground level and higher altitudes.
5. Acknowledgements
M. Sorribas thanks MINECO for the postdoctoral grant award (Juan de la Cierva) and Fulbright Commission for the travel grant award (Ruth Lee Kennedy). This work was partially supported by the Andalusian Regional Government through projects P10-RNM-6299 and P12-RNM-2409, the Spanish Ministry of Science and Technology through projects CGL2010-18782, CGL2011-24891/CLI and CGL2013-45410-R, and European Union through ACTRIS project (EU INFRA-2010-1.1.16-262254). We also thank the Andalusia Autonomous Government for PM10 of Mazagón Station. We also really thank the technical support of NOAA/ESRL aerosol network by the nephelometer and the HYSPLIT back-trajectories and the University of Valladolid and AERONET by the sun-photometer data.
References
- Aaltonen V. , Lihavainen H. , Kerminen V.-M. , Komppula M. , Hatakka J. , co-authors . Measurements of optical properties of atmospheric aerosols in northern Finland. Atmos. Chem. Phys. 2006; 6: 1155–1164.
- Anderson T. L. , Covert D. S. , Marshall S. F. , Laucks M. L. , Charlson R. J. , co-authors . Performance characteristics of a high-sensitivity, three-wavelength total scatter/backscatter nephelometer. J. Atmos. Ocean. Technol. 1996; 13: 967–986.
- Anderson T. L. , Ogren J. A . Determining aerosol radiative properties using the TSI 3563 integrating nephelometer. Aerosol Sci. Technol. 1998; 29(1): 57–69.
- Andreae M. O . Henserson-Sellers A . Climatic effects of changing atmospheric aerosol levels. World Survey of Climatology. Vol. 16: Future Climates of the World. 1995; Amsterdam, The Netherlands: Elsevier. 341–392.
- Antón M. , Sorribas M. , Bennouna Y. , Vilaplana J. M. , Cachorro V. E. , co-authors . Effects of an extreme desert dust event on the spectral ultraviolet irradiance at El Arenosillo (Spain). J. Geophys. Res. 2012; 117: 03205. DOI: 10.1029/2011JD016645.
- Bohren C. F. , Huffman D. R . Absorption and Scattering of Light by Small Particles. 1983; New York: John Wiley & Sons.
- Boyouk N. , León J.-F. , Delbarre H. , Podvin T. , Deroo C . Impact of the mixing boundary layer on the relationship between PM2.5 and aerosol optical thickness. Atmos. Environ. 2010; 44: 271–277.
- Buonnano G. , Dell'lsola M. , Stabile L. , Viola A . Uncertainty budget of the SMPS-APS system in the measurement of PM1, PM2.5 and PM10. Aerosol Sci. Technol. 2009; 43(11): 1130–1141.
- Butterfield D. , Quincey P . Measurement Science Issues Relating to PM10 and PM2.5 Airborne Particles. 2007; United Kingdom: National Physical Laboratory. ISSN 1754-2928.
- Cachorro V. E. , Toledano C. , Prats N. , Sorribas M. , Mogo S. , co-authors . The strongest desert dust intrusion mixed with smoke over the Iberian Peninsula registered with Sun photometry. J. Geophys. Res. 2008; 113: 14S04. DOI: 10.1029/2007JD009582.
- Castell N. , Mantilla E. , Millan M. M . Analysis of tropospheric ozone concentration on a Western Mediterranean site: Castellon (Spain). Environmental Monitoring and Assessment. 2008; 136: 3–11. [PubMed Abstract].
- Chamaillard K. , Jennings S. G. , Ceburnis D. , Yoon Y. J. , O'Dowd C . Effect of instrumental particle sizing resolution on the modeling of aerosol radiative parameters. J. Quant. Spectrosc. Radiat. Transf. 2010; 111: 753–771.
- Charlson R. J. , Porch W. M. , Waggoner A. P. , Ahlquist N. C . Background aerosol light scattering characteristics: nephelometric observations at Mauna Loa Observatory compared with results at other remote locations. Tellus. 1974; XXVI: 345–360.
- Chaudhry Z. , Martins J. V. , Li Z. , Tsay S.-C. , Chen H. , co-authors . In situ measurements of aerosol mass concentration and radiative properties in Xianghe, southeast of Beijing. J. Geophys. Res. 2007; 112: 23S90. DOI: 10.1029/2007JD009055.
- Chen G. , Ziemba L. D. , Chu D. A. , Thornhill K. L. , Schuster G. L. , co-authors . Observations of Saharan dust microphysical and optical properties from the eastern Atlantic during NAMMA airborne field campaign. Atmos. Chem. Phys. 2011; 11: 723–740. DOI: 10.5194/acp-11-723-2011.
- Córdoba-Jabonero C. , Sorribas M. , Guerrero-Rascado J. L. , Adame J. A. , Hernández Y. , co-authors . Synergetic monitoring of Saharan dust plumes and potential impact on surface: a case study of dust transport from Canary Islands to Iberian Peninsula. Atmos. Chem. Phys. 2011; 11: 3067–3091.
- Davies C. N . Particle-fluid interaction. J. Aerosol Sci. 1979; 10: 477–513.
- Delene D. J. , Ogren J. A . Variability of aerosol optical properties at four North American surface monitoring sites. J. Atmos. Sci. 2002; 59: 1135–1150.
- Draxler R. R. , Rolph G. D . HYSPLIT (Hybrid Single-Particle Lagrangian Integrated Trajectory). 2003; Silver Spring, MD: NOAA Air Resources Laboratory. Online at: http://www.arl.noaa.gov/ready/hysplit4.html .
- Dubovik O. , Holben B. , Lapynok T. , Sinyuk A. , Mishchenko M. I. , co-authors . Non-spherical aerosol retrieval method employing light scattering by spheroids. Geophys. Res. Lett. 2002; 29: 1415. DOI: 10.1029/2001GL014506.
- Endo Y. , Chen D.-R. , Pui D. Y. H . Effects of particle polydispersity and shape factor during dust cake loading on air filters. Powder Technol. 1998; 98(3): 241–249.
- Escudero M. , Stein A. , Draxler R. R. , Querol X. , Alastuey A. , co-authors . Determination of the contribution of northern Africa dust source areas to PM10 concentrations over the central Iberian Peninsula using the Hybrid Single-Particle Lagrangian Integrated Trajectory model (HYSPLIT) model. J. Geophys. Res. 2006; 111: 06210. DOI: 10.1029/2005JD006395.
- Estellés V. , Martínez-Lozano J. A. , Pey J. , Sicard M. , Querol X. , co-authors . Study of the correlation between columnar aerosol burden, suspended matter at ground and chemical components in a background European environment. J. Geophys. Res. 2012; 117: 04201. DOI: 10.1029/2011JD016356.
- Esteve A. R. , Estellés V. , Utrillas M. P. , Martínez-Lozano J. A . In-situ integrating nephelometer measurements of the scattering properties of atmospheric aerosols at an urban coastal site in western Mediterranean. Atmos. Environ. 2012; 47: 43–50.
- Fernández-Gálvez J. , Guerrero-Rascado J. L. , Molero F. , Lyamani H. , Revuelta M. A. , co-authors . Aerosol size distribution from inversion of solar radiances and measured at ground-level during SPALI10 campaign. Atmos. Res. 2013; 127: 130–140.
- González-Castanedo Y . Caracterización geoquímica y contribución de fuentes de material particulado atmosférico en El Arenosillo, SW de la Península Ibérica. 2007; University of Huelva, Huelva, Spain: Diplome of Advances Studies.
- Guerrero-Rascado J. L. , Ruiz Reverter B. , Alados-Arboledas L . Multi-spectral Lidar characterization of the vertical structure of Saharan dust aerosol over southern Spain. Atmos. Environ. 2008; 42: 2668–2681.
- Hand J. L. , Kreidenweis S. M . A new method for retrieving particle refractive index and effective density from aerosol size distribution data. Aerosol Sci. Technol. 2002; 36(10): 1012–1026.
- Heintzenberg J. , Wiedensohler A. , Tuch T. M. , Covert D. S. , Sheridan P. , co-authors . Intercomparisons and aerosol calibrations of 12 commercial integrating nephelometers of three manufactures. J. Atmos. Ocean. Technol. 2006; 23: 902–914.
- Holben B. N. , Eck T. F. , Slutsker I. , Tanré D. , Buis J. P. , etal. AERONET – a federated instrument network and data archive for aerosol characterization. Remote Sens. Environ. 1998; 66: 1–16. DOI: 10.1016/S0034-4257(98)00031-5.
- Holm R. L. , Caldow R. , Hairston P. P. , Quant F. R. , Sem G. J . An enhanced time-of-flight spectrometer that measures aero-dynamic size plus light-scattering intensity. J. Aerosol Sci. 1997; 28: S1, S11, S12.
- Kaaden N. , Massling A. , Schladitz A. , Müller T. , Kandler K. , co-authors . State of mixing, shape factor, number size distribution, and hygroscopic growth of the Saharan anthropogenic and mineral dust aerosol at Tinfou, Morocco. Tellus B. 2009; 61: 51–63.
- Kahnert M. , Nousiainen T. , Räisänen P . Mie simulations as an error source in mineral aerosol radiative forcing calculations. Q. J. Roy. Meteorol. Soc. 2007; 133: 299–307.
- Khlystov A. , Stanier C. , Pandis S. N . An algorithm for combining electrical mobility and aerodynamic size distributions data when measuring ambient aerosol. Aerosol Sci. Technol. 2004; 38(S1): 229–238.
- Kleefeld C. , O'Dowd C. D. , O'Reilly S. , Jennings S. G. , Aalto P. , co-authors . Relative contribution of submicron and supermicron to aerosol light scattering in the marine boundary layer. J. Geophys. Res. 2002; 107: 8103. DOI: 10.1029/2000JD000262.
- Knutson E. O. , Whitby K. T . Aerosol classification by electric mobility: apparatus, theory and applications. J. Aerosol Sci. 1975; 6: 443–451.
- Lindeman J. D. , Boybeyi Z. , Guttepe I . An examination of the aerosol semi-direct effect for a polluted case of the ISDAC field campaign. J. Geophys. Res. 2011; 116: 00T10. DOI: 10.1029/2011JD015649.
- López J. F. , Cachorro V. E. , Sorribas M. , De la Morena B. A. , De Frutos A. M . Analysis of aerosol scattering coefficient measurements between 2006 and 2008 at El Arenosillo station. Óptica Pura Aplicada. 2011; 44(4): 683–687.
- Lyamani H. , Olmo F. J. , Alados-Arboledas L . Saharan dust outbreak over southeastern Spain as detected by Sun-photometer. Atmos. Environ. 2005; 39: 7276–7284.
- Lyamani H. , Olmo F. J. , Alados-Arboledas L . Light scattering and absorption properties of aerosol particles in the urban environment of Granada, Spain. Atmos. Environ. 2008; 42: 2630–2642.
- Lyamani H. , Olmo F. J. , Alados-Arboledas L . Physical and optical properties of aerosols over an urban location in Spain: seasonal and diurnal variability. Atmos. Chem. Phys. 2010; 10: 239–254.
- Ma N. , Birmili W. , Müller T. , Tuch T. , Cheng Y. F. , co-authors . Tropospheric aerosol scattering and absorption over central Europe: a closure study for the dry particle state. Atmos. Chem. Phys. 2014; 14: 6241–6259.
- Marshall J. , Lohmann U. , Leaitch W. R. , Leaitch W. R. , Lehr P. , co-authors . Aerosol scattering as a function of latitude in a coastal environment. J. Geophys. Res. 2007; 112: 142203. DOI: 10.1029/2006JD007793.
- Müller D. , Lee K.-H. , Gateiger J. , Tesche M. , Weinzierl B. , co-authors . Comparison of optical and microphysical properties of pure Saharan mineral dust observed with AERONET Sun photometer, Raman lidar, and in situ instruments during SAMUM 206. J. Geophys. Res. 2012; 117: 07211. DOI: 10.1029/2011JD016825.
- Niedermeier D. , Wex H. , Voigtländer J. , Stratmann F. , Brüggemann E. , co-authors . LACIS-measurements and parameterization of sea-salt particle hygroscopic growth and activation. Atmos. Chem. Phys. 2008; 8: 579–590.
- NRC (National Research Council). Radiative Forcing of Climate Change: Expanding the Concept and Addressing Uncertainties. 2005; Washington, DC: National Academy Press.
- Pandolfi M. , Cusak M. , Alastuey A. , Querol X . Variability of aerosol optical properties in the western Mediterranean Basin. Atmos. Chem. Phys. 2011; 11: 8189–8203.
- Pereira S. N. , Wagner F. , Silva A. M . Seven years of measurements of aerosol scattering properties, near the surface, in the southwestern Iberia Peninsula. Atmos. Chem. Phys. 2011; 11: 17–29.
- Prats N. , Cachorro V. E. , Sorribas M. , Mogo S. , Berjón A. , co-authors . Columnar aerosol optical properties during ‘El Arenosillo 20 04 summer campaign’. Atmos. Environ. 2008; 42(11): 2643–2653.
- Preißler J. , Wagner F. , Pereira S. , Guerrero-Rascado J. L . Multi-instrumental observation of an exceptionally strong Saharan dust outbreak over Portugal. J. Geophys. Res. 2012; 116(27): 03299. DOI: 10.1029/2011JD016527.
- Querol X. , Alastuey A. , Rodríguez S. , Viana M. M. , Artíñano B. , co-authors . Levels of particulate matter in rural, urban and industrial sites in Spain. Sci. Total Environ. 2004; 334–335: 359–376.
- Reid J. S. , Brooks B. , Crahan K. K. , Hegg D. A. , Eck T. F. , co-authors . Reconciliation of coarse mode sea-salt aerosol particle size measurements and parameterizations at a subtropical ocean receptor site. J. Geophys. Res. 2006; 111: 02202. DOI: 10.1029/2005jd006200.
- Reid J. S. , Jonsson H. H. , Maring H. B. , Smirnov A. , Savoie D. L. , co-authors . Comparison of size and morphological measurements of coarse mode dust particles from Africa. J. Geophys. Res. 2003; 108: 8593. DOI: 10.1029/2002jd002485.
- Reid J. S. , Reid E. A. , Walker A. , Piketh S. , Cliff S. , co-authors . Dynamics of southwest Asian dust particle size characteristics with implications for global dust research. J. Geophys. Res. 2008; 113: 14212. DOI: 10.1029/2007jd009752.
- Rodríguez S. , Querol X. , Alastuey A. , Kallos G. , Kakaliagou O . Saharan dust contributions to PM10 and TSP levels in southern and eastern Spain. Atmos. Environ. 2001; 35(14): 2433–2447.
- Sakaeda N. , Wood R. , Rasch P. J . Direct and semidirect aerosol effects of southern African biomass burning aerosol. J. Gephys. Res. 2011; 116: 12205. DOI: 10.1029/2010JD015540.
- Salminen K. , Karlson V . Comparability of low-volume PM10 sampler with β-attenuation monitor in background air. Atmos. Environ. 2003; 37: 3707–3712.
- Sánchez de la Campa A. M. , Pio C. , De la Rosa J. D. , Querol X. , Alastuey A. , co-authors . Characterization and origin of EC and OC particulate matter near the Doñana National Park (SW Spain). Environ. Res. 2009; 109: 671–681.
- Schaap M. , Apitulry A. , Timmermans R. M. A. , Koelemeijer R. B. A. , De Leeuw G . Exploring the relation between aerosol optical depth and PM2.5 at Cabauw, The Netherlands. Atmos. Chem. Phys. 2009; 9: 909–925. DOI: 10.519/acp-9-909-2009.
- Schäfer K. , Harbusch A. , Emeis S. , Koepke P. , Wiegner M . Correlation of aerosol mass near the ground with aerosol optical depth during two seasons in Munich. Atmos. Environ. 2008; 42: 4036–4046. DOI: 10.1016/j.atmosenv.2008.01.060.
- Schkolnik G. , Chand D. , Hoffer A. , Andreae M. O. , Erlick C. , co-authors . Constraining the density and complex refractive index of aerosol EC and OC - a new approach to optical closure. Atmos. Environ. 2007; 41: 1107–1118.
- Seinfeld J. H. , Pandis S. N . Atmospheric chemistry and physics: from air pollution to climate change. 1st edition . 1998; New York: J. Wiley.
- Shen S. , Jaques P. A. , Zhu Y. , Geller M. D. , Sioutas C . Evaluation of the SMPS-APS system as a continuous monitor for measuring PM2.5, PM10 and coarse (PM2.5–10) concentrations. Atmos. Environ. 2002; 36: 3939–3950.
- Sheridan P. J. , Delene D. J. , Ogren J. A . Four years of continuous surface aerosol measurements from the Department of Energy's Atmospheric Radiation Measurement Program Southern Great Plains Cloud and Radiation Testbed site. J. Geophys. Res. 2001; 106(18): 20735–20747.
- Smirnov A. , Holben B. N. , Savoie D. , Prospero J. M. , Kaufman Y. J. , co-authors . Relationship between column aerosol optical thickness and in situ ground based dust concentrations over Barbados. Geophys. Res. Lett. 2000; 27(11): 1643–1646. DOI: 10.1029/1999GL011336.
- Sorribas M. , Adame J. A. , Olmo F. J. , Vilaplana J. M. , Gil-Ojeda M. , co-authors . Long-term study of new particle formation in a coastal environment: meteorology, gas phase and solar radiation implications. Sci. Total Environ. 2015a; 511: 723–737.
- Sorribas M. , De la Morena B. A. , Wehner B. , López J. F. , Prats N. , co-authors . On the sub-micron aerosol size distribution in a coastal-rural site at El Arenosillo Station (SW-Spain). Atmos. Chem. Phys. 2011; 11: 11185–11206.
- Sorribas M. , Olmo F. J. , Quirantes A. , Lyamani H. , Gil-Ojeda M. , co-authors . Role of spheroidal particles in closure studies for aerosol microphysical-optical properties. Q. J. Roy. Meteorol. Soc. 2015b. DOI: 10.1002/qj.2557.
- Su J. , Huang J. , Fu Q. , Minnis P. , Ge J. , co-authors . Estimation of Asian dust aerosol effect on cloud radiation forcing using Fu-Liou radiative model and CERES measurements. Atmos. Chem. Phys. 2008; 8: 2763–2771.
- Titos G. , Lyamani H. , Cazorla A. , Sorribas M. , Foyo-Moreno I. , co-authors . Study of the relative humidity dependence of aerosol light-scattering in southern Spain. Tellus B. 2014; 66: 24536. http://dx.doi.org/10.3402/tellusb.v66.24536 .
- Toledano C. , Cachorro V. E. , De Frutos A. M. , Sorribas M. , Prats N. , co-authors . Inventory of African desert dust events over the southwestern Iberian Peninsula in 2000–2005 with an AERONET Cimel Sun Photometer. J. Geophys. Res. 2007; 112: 21201. DOI: 10.1029/2006JD008307.
- Virkkula A. , Backman J. , Aalto P. P. , Hulkkonen M. , Riuttanen L. , co-authors . Seasonal cycle, size dependencies, and source analyses of aerosol optical properties at the SMEAR II measurement station in Hyytiälä, Finland. Atmos. Chem. Phys. 2011; 11: 4445–4468.
- Wex H. , Fuentes E. , Tsagkogeorgas G. , Voigtländer J. , Clauss T. , co-authors . The influence of algal exudate on the hygroscopicity of sea spray particles. Adv. Meteorol. 2010; 2010: 1–11. DOI: 10.1155/2010/365131.
- Wiedensohler A. , Birmili W. , Nowak A. , Sonntag A. , Weinhold K. , co-authors . Mobility particle size spectrometers: harmonization of technical standards and data structure to facilitate high quality long-term observations of atmospheric particle number size distributions. Atmos. Meas. Tech. 2012; 5: 657–685. DOI: 10.5194/amt-5-657-2012.
- Willeke K. , Baron P. A . Aerosol Measurements Principles, Techniques and Applications. 1993; New York, NY: Van Nostrand Reinhold. 143–195.
- Williams M. , Bruckmann P . Guidance to Member States on PM10 Monitoring and Intercomparisons with the Reference Method. 2002; European Union: European Commision Working Group on Particulate Matter.
- Yum S. S. , Roberts G. , Kim J. H. , Song K. , Kim D . Submicron aerosol size distributions and cloud condensation nuclei concentrations measured at Gosan, Korea, during the Atmospheric Brown Clouds-East Asian Regional Experiment 2005. J. Geophys. Res. 2007; 112: 22S32. DOI: 10.1029/2006JD008212.